1. B Movement and Position
1/26
Earn XP
Description and Tags
Physics Edexcel IGCSE Distance - Time and Velocity - Time graphs
Name | Mastery | Learn | Test | Matching | Spaced | Call with Kai | Chat |
|---|
No analytics yet
Send a link to your students to track their progress
27 Terms
What is speed?
How fast you are going
The distance travelled per unit of time
What is velocity?
How fast you are going
The distance travelled per unit of time in a given direction
What is the difference between speed and velocity?
Speed is a scalar and so only has size (e.g 20m/s) whereas velocity is a vector and so has both size and direction (e.g 20 m/s North). This means that an object can have a constant speed but a changing velocity because their speed could be the same, but their direction could be changing.
What is the formula to calculate speed?
Average speed (you could also use velocity here) = distance moved / time taken
If we have displacement moved (rather than distance moved) we could use the formula to calculate velocity as you would now also have a direction in the formula. The number you would get at the end of the formula would be the same for speed and velocity and if you used displacement and distance the only difference would be that there would be a direction at the end. E.g 55m/s South instead of just 55m/s
What is acceleration?
The change in velocity per unit of time
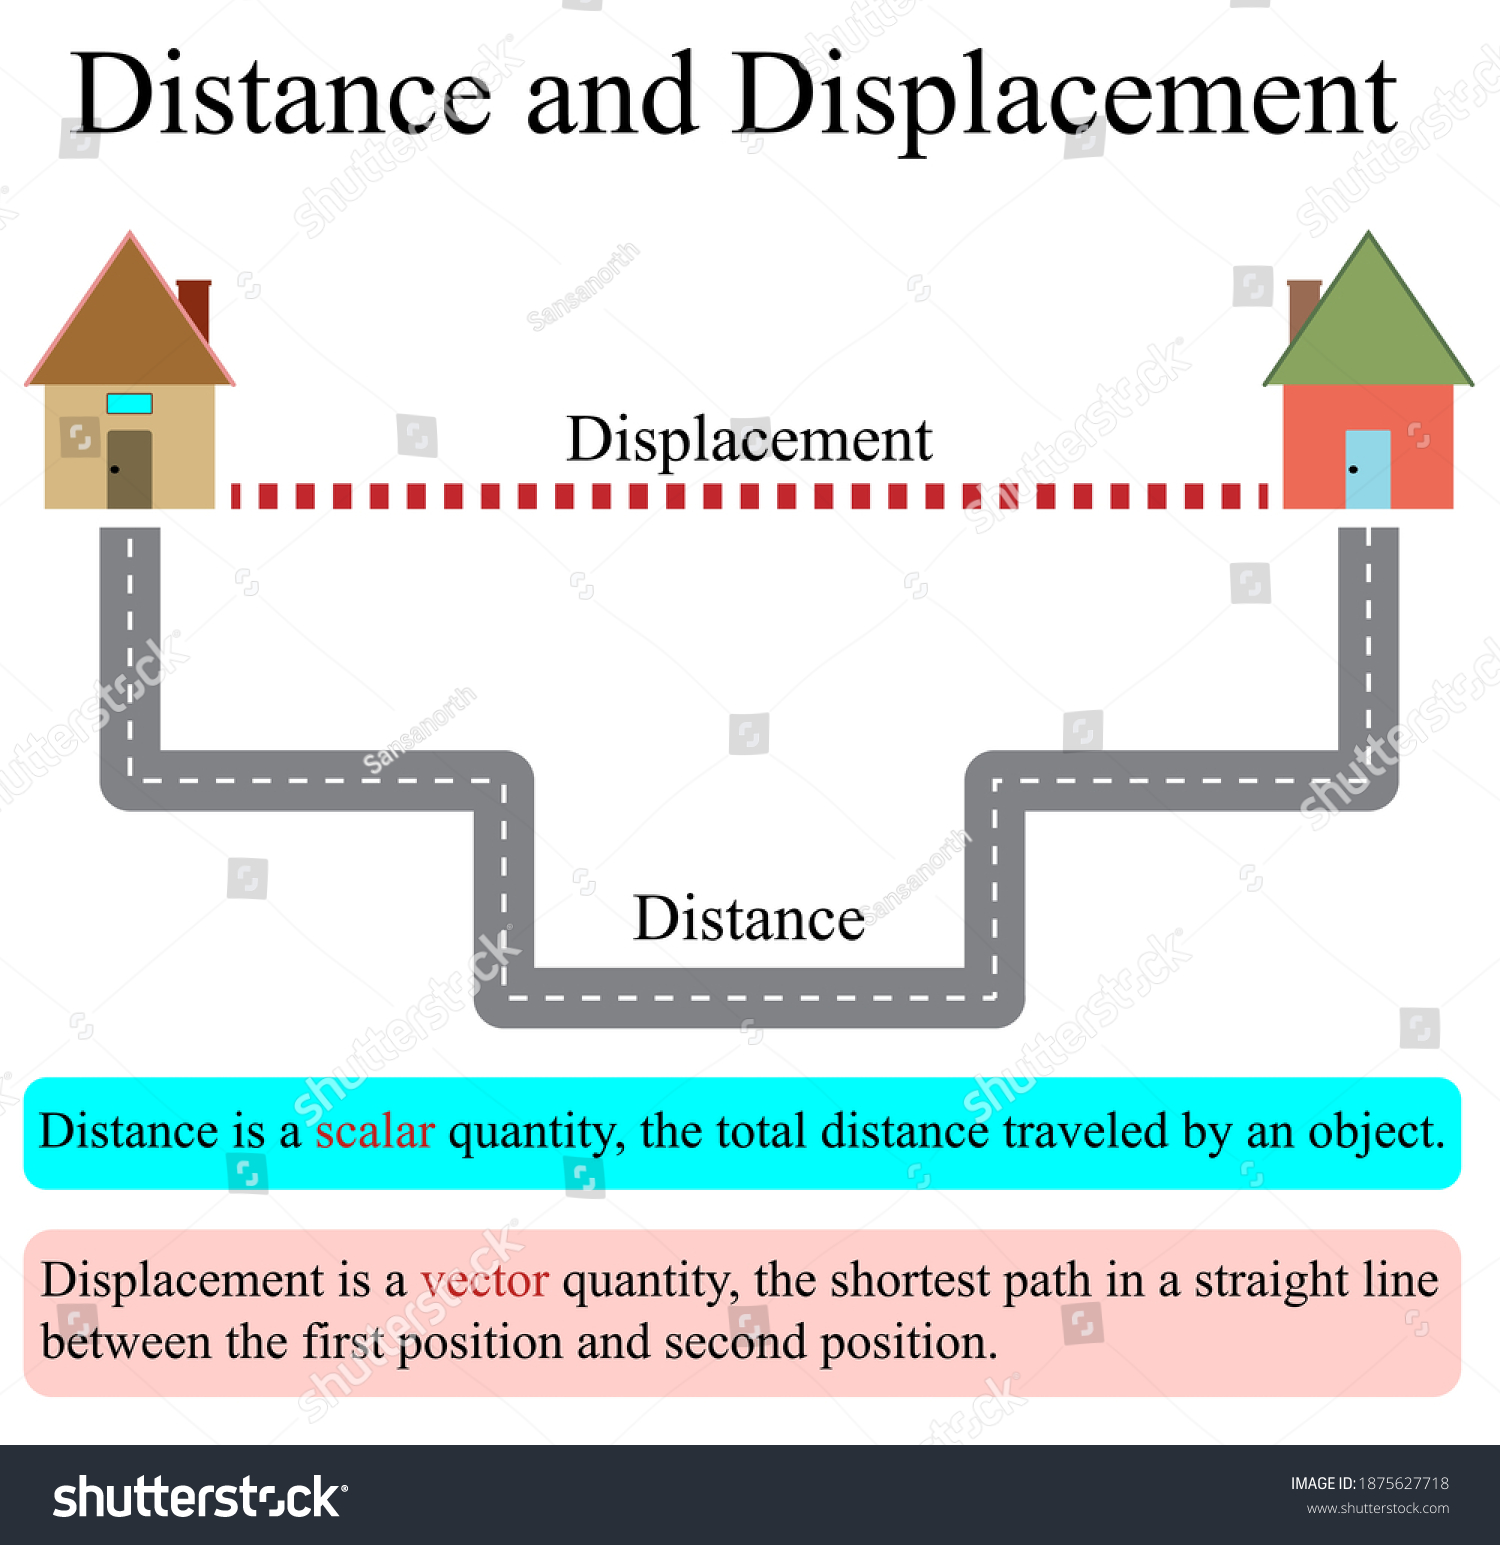
What is distance?
Distance is how far an object moves
Distance is a scalar quantity
What is displacement?
Displacement is the distance an object moves in a straight line from the starting point to the end point
Displacement is a vector quantity
What is the difference between distance and displacement?
Distance is a scalar, displacement is a vector
Distance is how far you have travelled in total
Displacement is how far point A is from point B
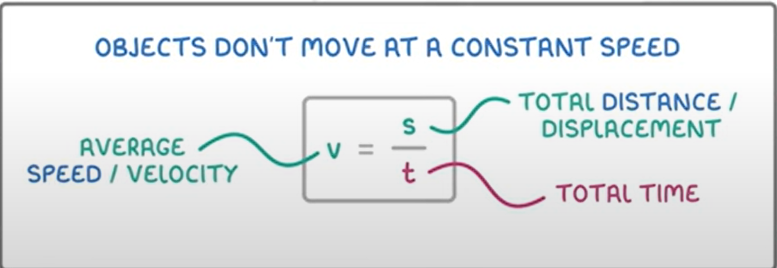
What is the formula to calculate speed when it isn’t constant in an object?
Average speed/velocity = total distance/displacement divided by total time
What is the formula for acceleration? 1
Acceleration = change in velocity/time taken
Please note, change in velocity can also be seen as:
△V (triangle means change in and the v means velocity)
V - U (V=final velocity, U=initial velocity)
What is the formula for acceleration? 2
V2 = u2 +2as
(Final velocity2 = initial velocity2 + 2 x acceleration x distance travelled)
What do distance-time graphs do?
They tell you how far something has travelled in a certain period of time
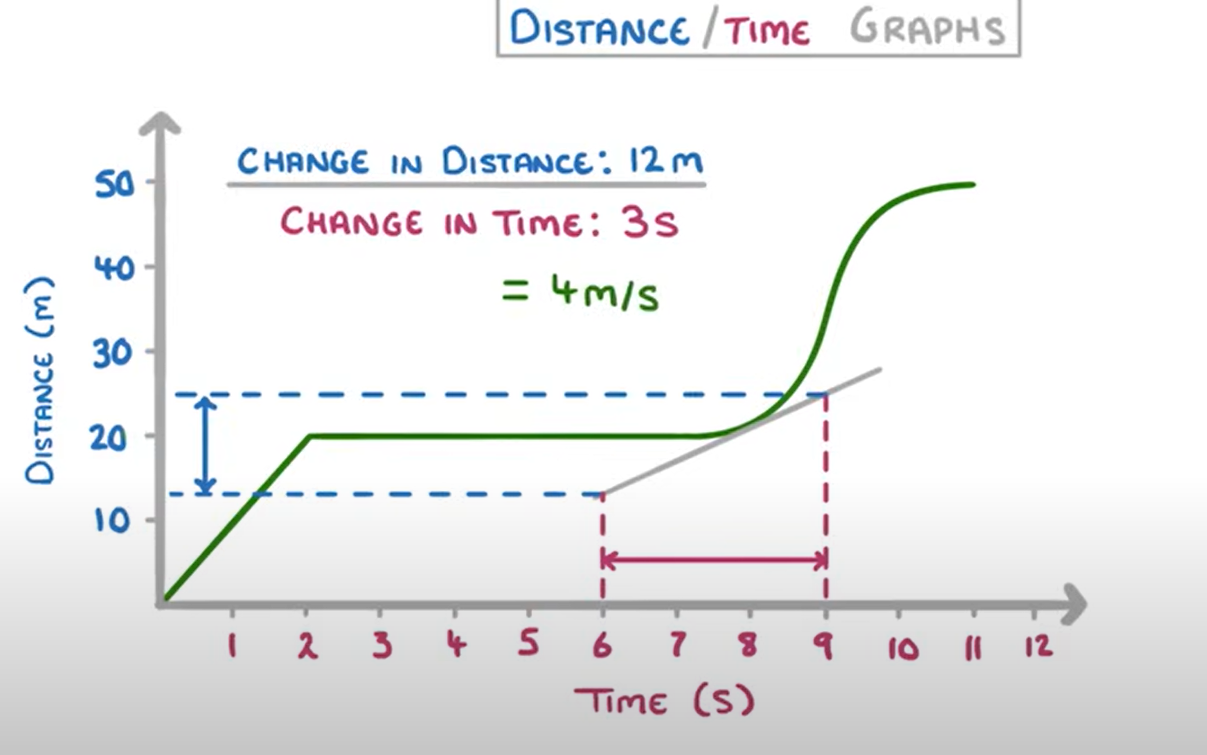
What does the gradient of the line of a distance - time graph tell you?
The speed the object is travelling
To work this out you would do the distance/time or rise/run

What does line A show on the graph?
Constant speed

What does line B show on the graph?
The object was stationary

What does line C show on the graph?
Constant speed (but faster than line A because the gradient is steeper)

What does line D show on the graph?
Returning to start point (as the distance is decreasing)
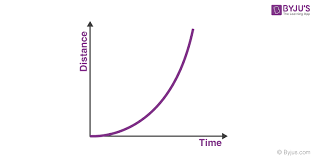
What does this line show on the graph?
Acceleration
What does this line show on the graph
Deceleration
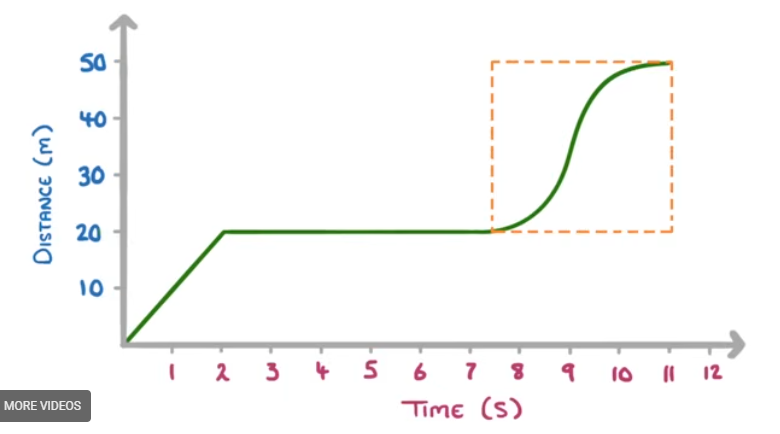
How do you work out the speed of an object on a distance - time graph when it is accelerating?
If we wanted to find the speed at 8 seconds, we would have to draw a tangent to the curve at that point (the tangent is a straight line with exactly the same gradient as the curve at that point)
Once we have the tangent, we can work out the gradient by using our usual method
What do velocity - time graphs tell us?
How an object’s velocity changes over time
What does the gradient of a velocity - time graph tell you?
The acceleration of an object (change in velocity/change in time)

What does line A and C show on the graph?
The object is constantly accelerating
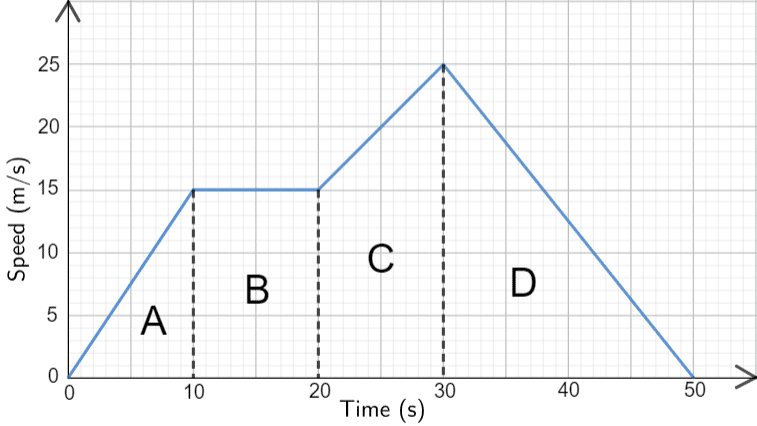
What does line B show on the graph?
The object is travelling at a constant speed - we can find this out by looking at the y axis. Line B is travelling at a constant speed of 15 m/s

What does line D show on the graph?
The object is constantly decelerating
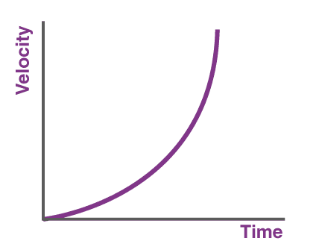
What does this line show on the graph?
That the gradient is increasing and so the rate of acceleration is increasing
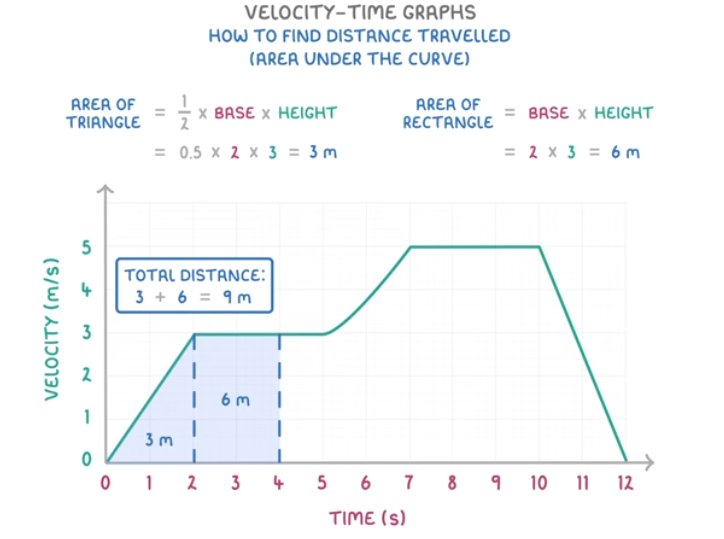
How do you find the distance travelled on a velocity - time graph?
You find the area of the shapes underneath the lines on the graph (see photo)
When you have a curved line, you have to count up the squares and slightly estimate the number of squares/area of the shape.