AP Human Geography: All Models
1/78
There's no tags or description
Looks like no tags are added yet.
Name | Mastery | Learn | Test | Matching | Spaced | Call with Kai |
|---|
No analytics yet
Send a link to your students to track their progress
79 Terms
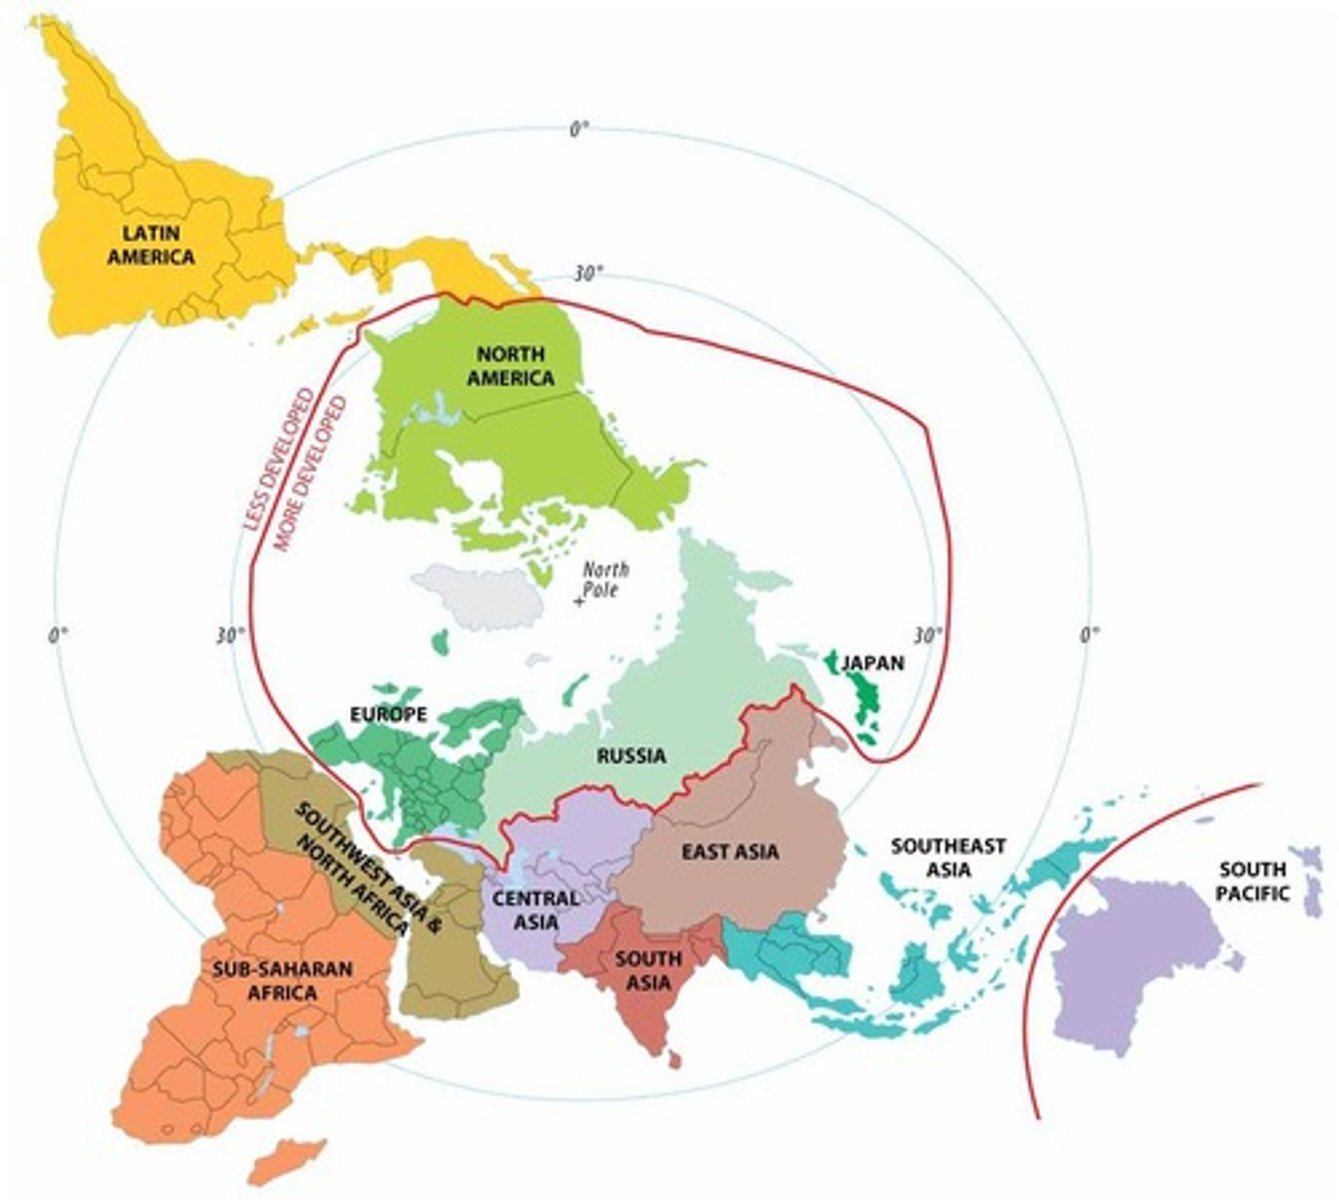
Core-Periphery Model
spatial structure of development where "Core" regions (MDCs) dominate and exploit "Periphery" regions (LDCs)
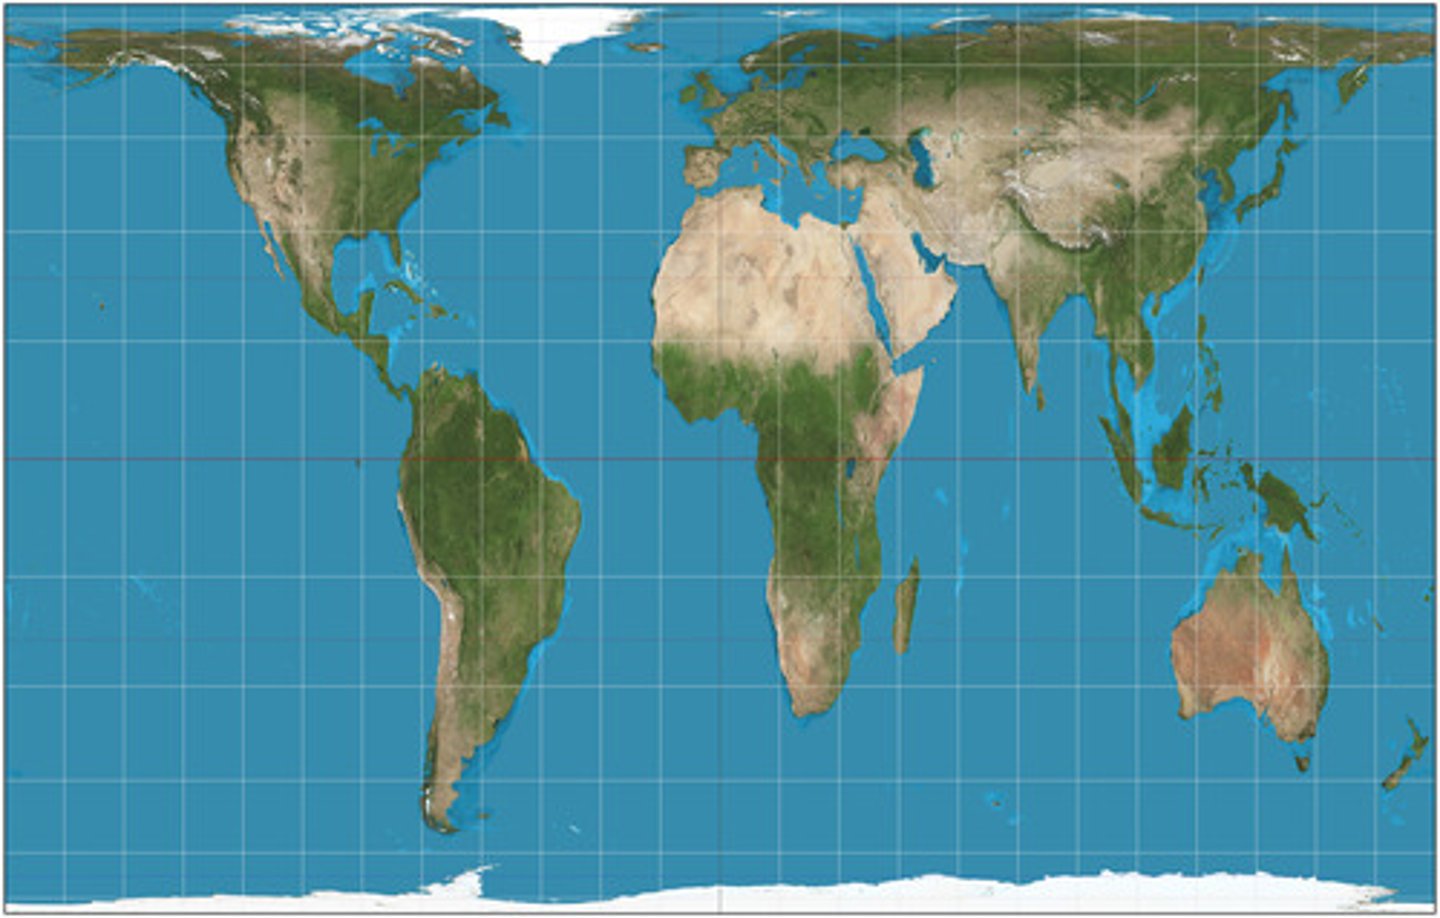
Peter's Projection
rectangular map that preserves size (area) but drastically distorts shape; often used to show the true scale of the Global South
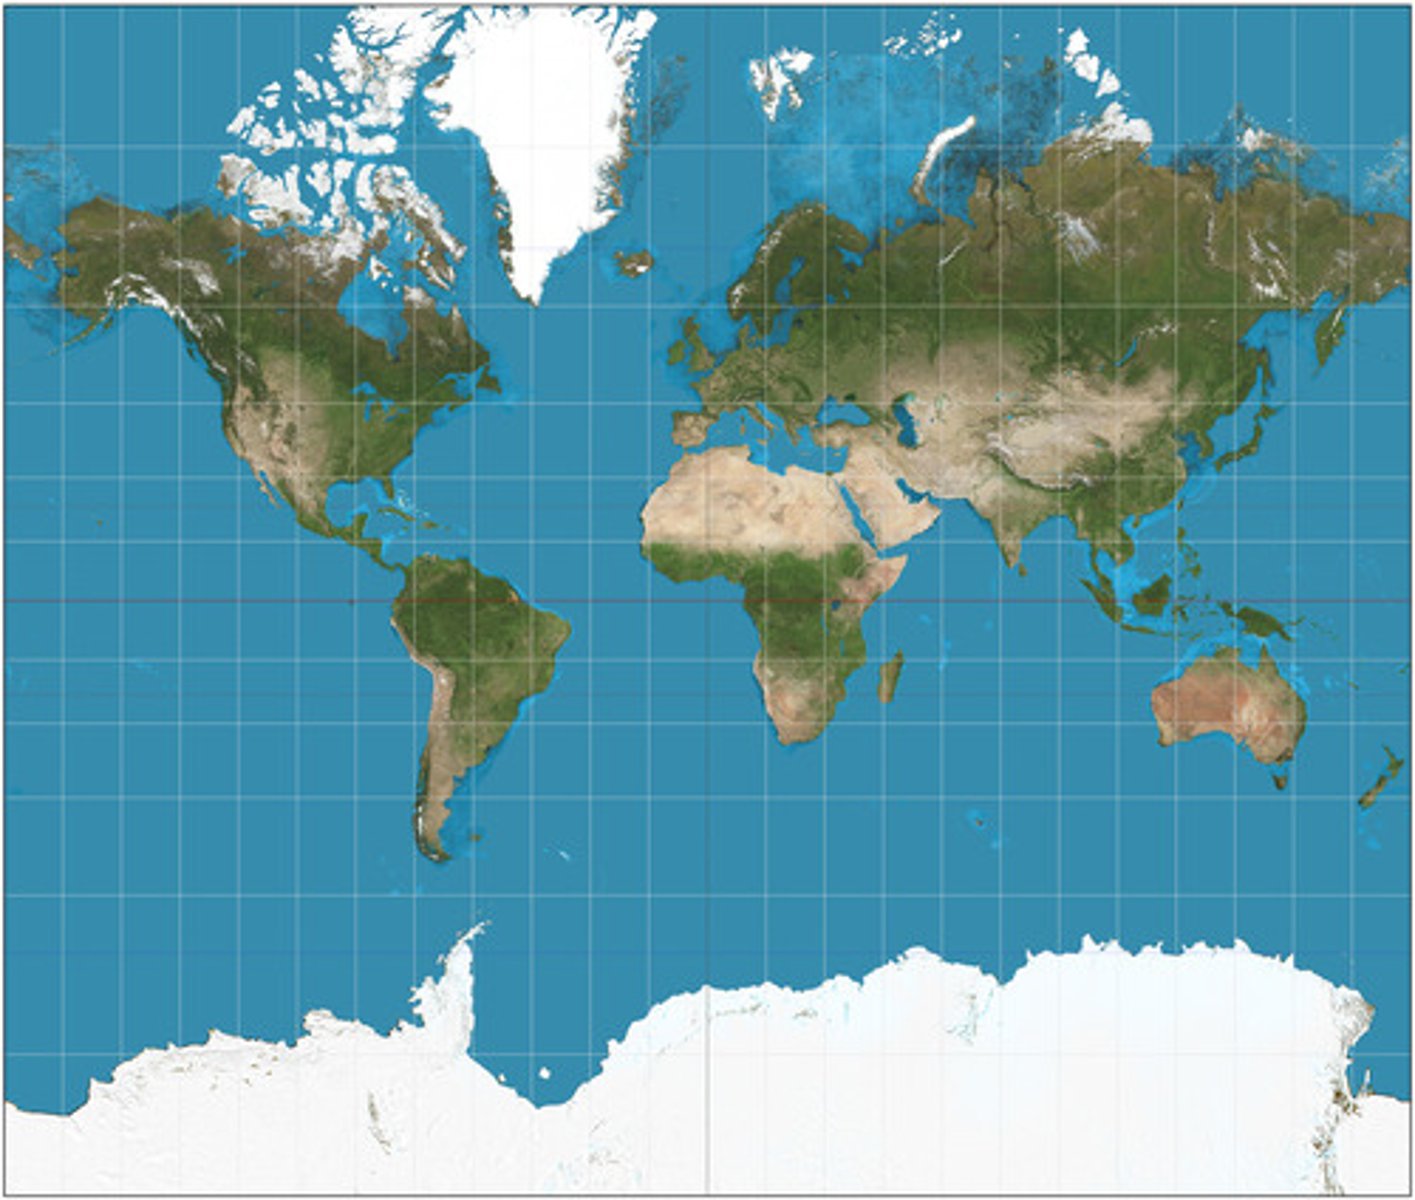
Mercator Projection
map designed for navigation that preserves direction and shape but greatly exaggerates the size of landmasses near the poles
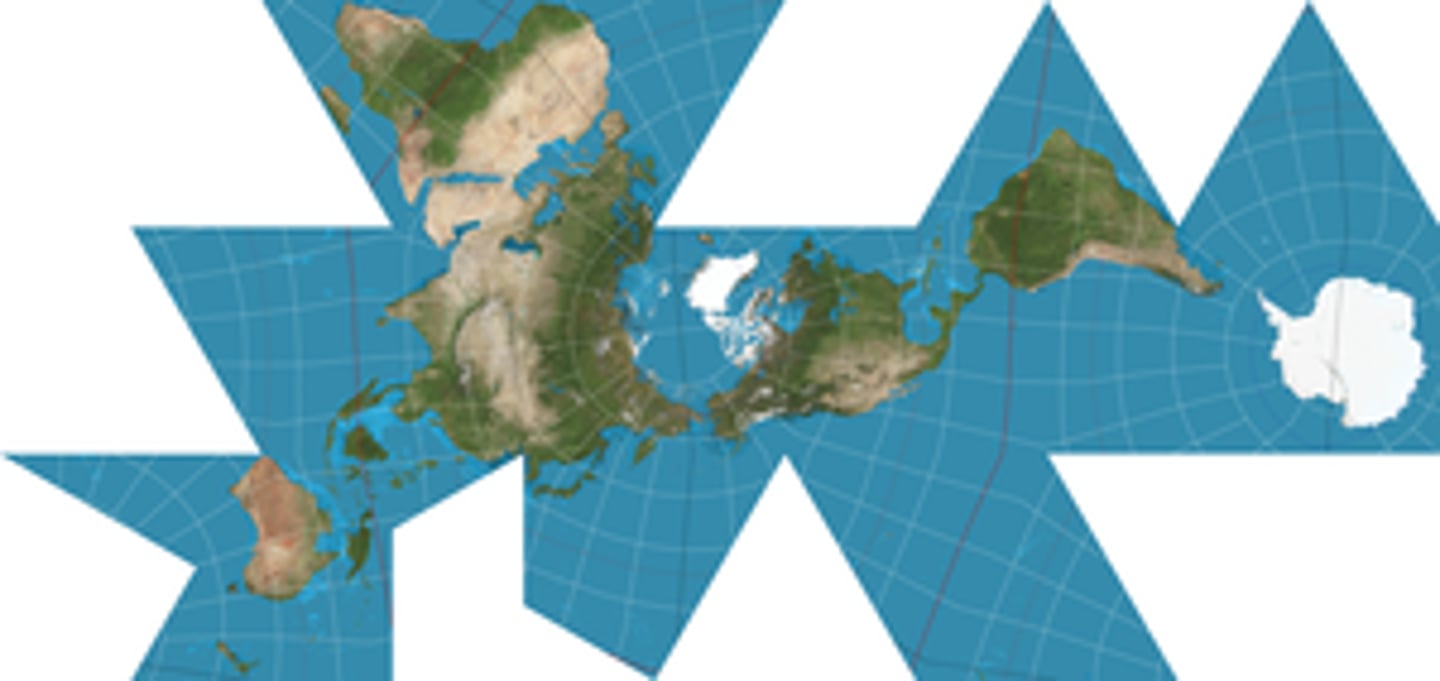
Fuller Projection
map that projects the globe onto a polyhedron, preserving size and shape but completely distorting direction
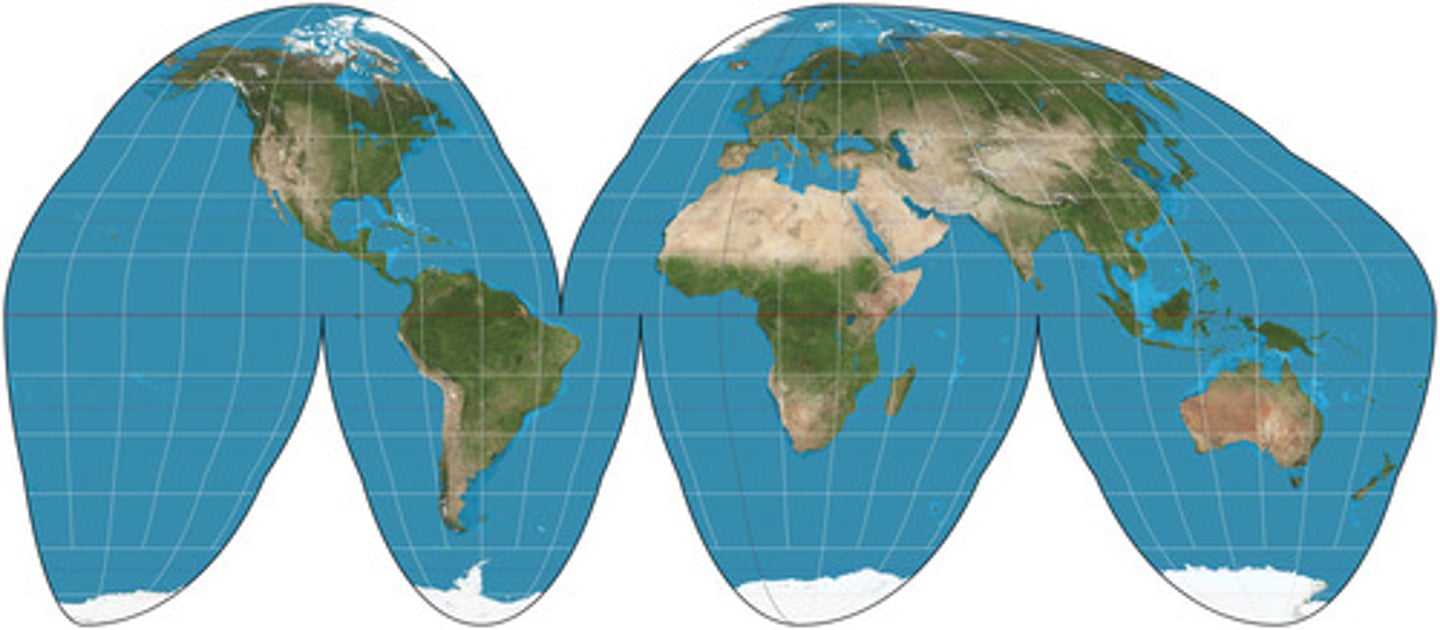
Goodes-Homolosine Projection
"interrupted" map that resembles an orange peel; it minimizes distortion of area and shape but breaks up the oceans
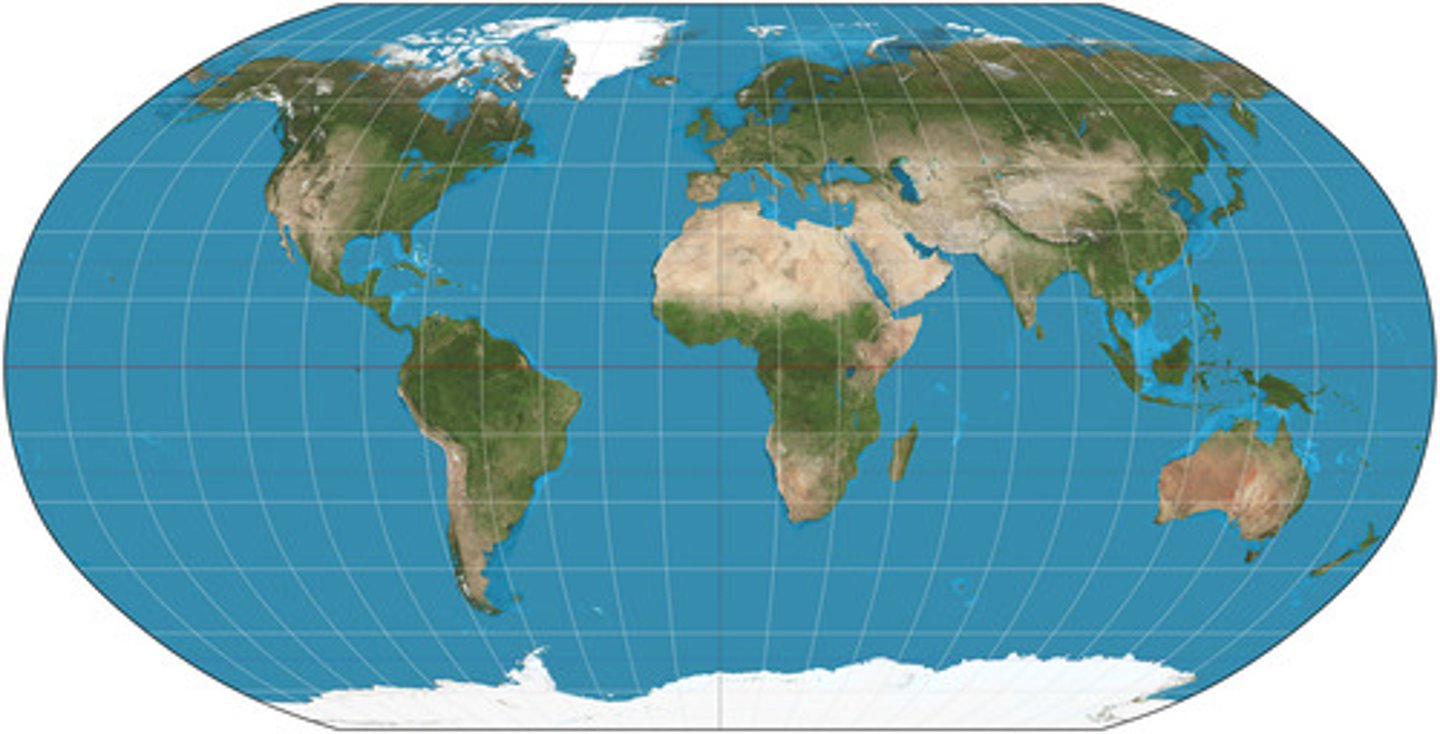
Robinson Projection
"compromise" map that distorts all four properties (shape, area, distance, direction) a little bit to create a visually balanced image
scale
relationship between the portion of Earth being studied and Earth as a whole (ex: local vs. global)
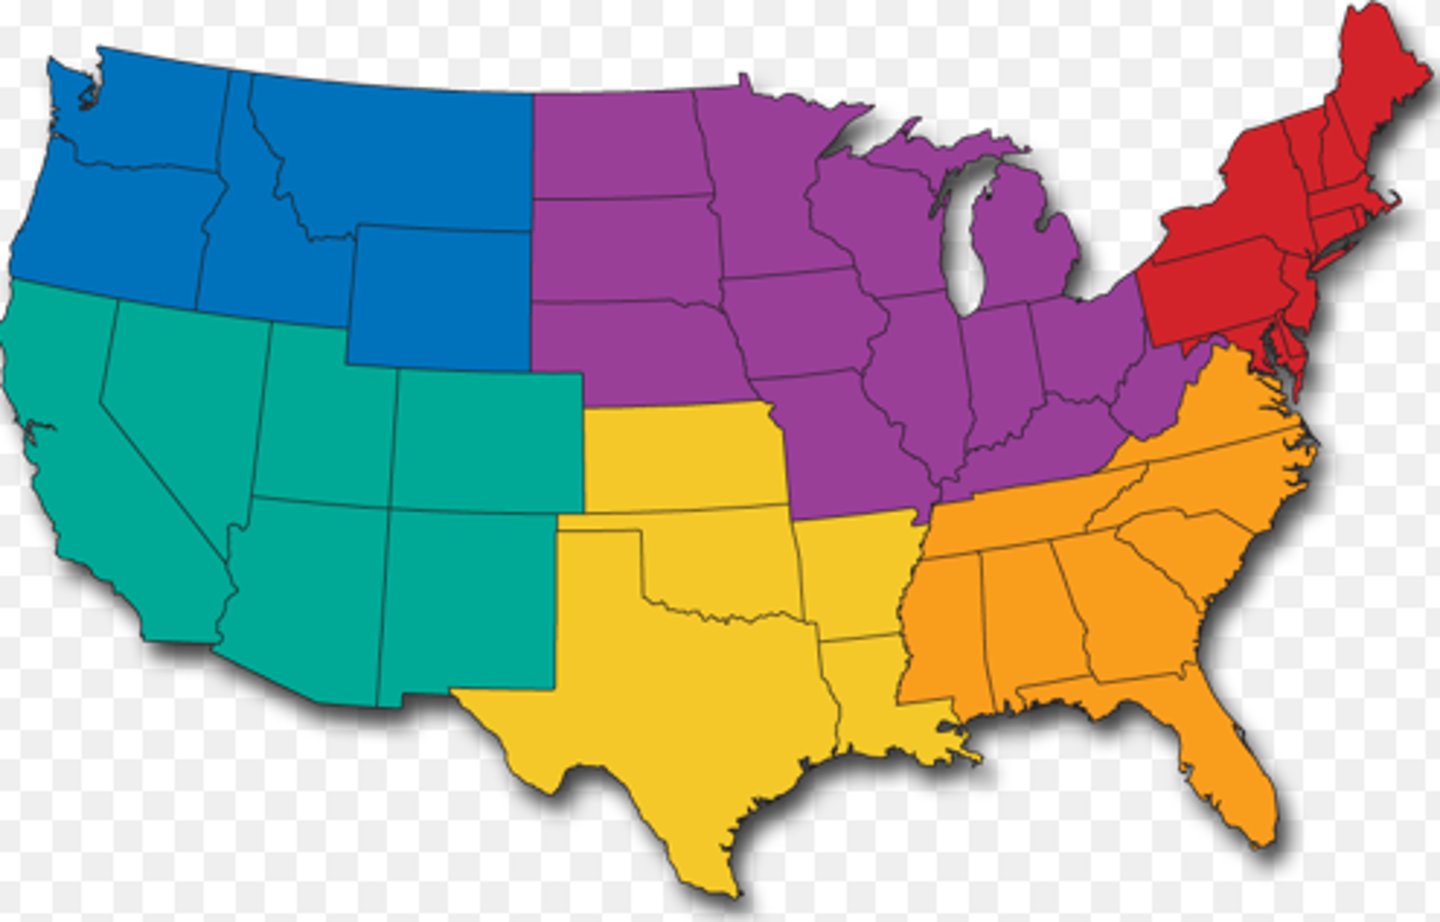
formal region
area where everyone shares one or more distinctive characteristics (ex: a state, a climate zone)
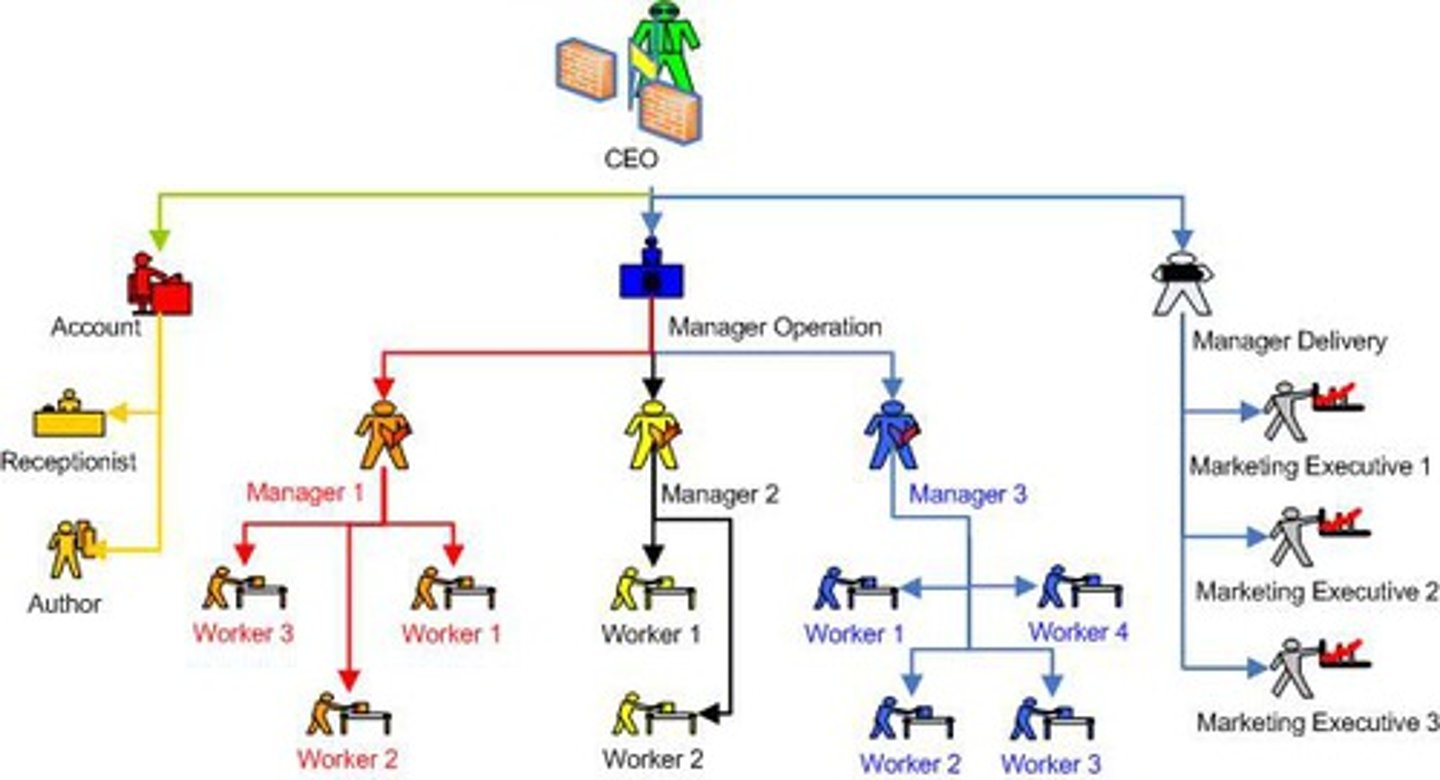
functional region
area organized around a node or focal point (ex: a TV station's broadcast area, a pizza delivery route)

vernacular region
area that people believe exists as part of their cultural identity (ex: "The South," "The Midwest"

relocation diffusion
spread of an idea through the physical movement of people from one place to another

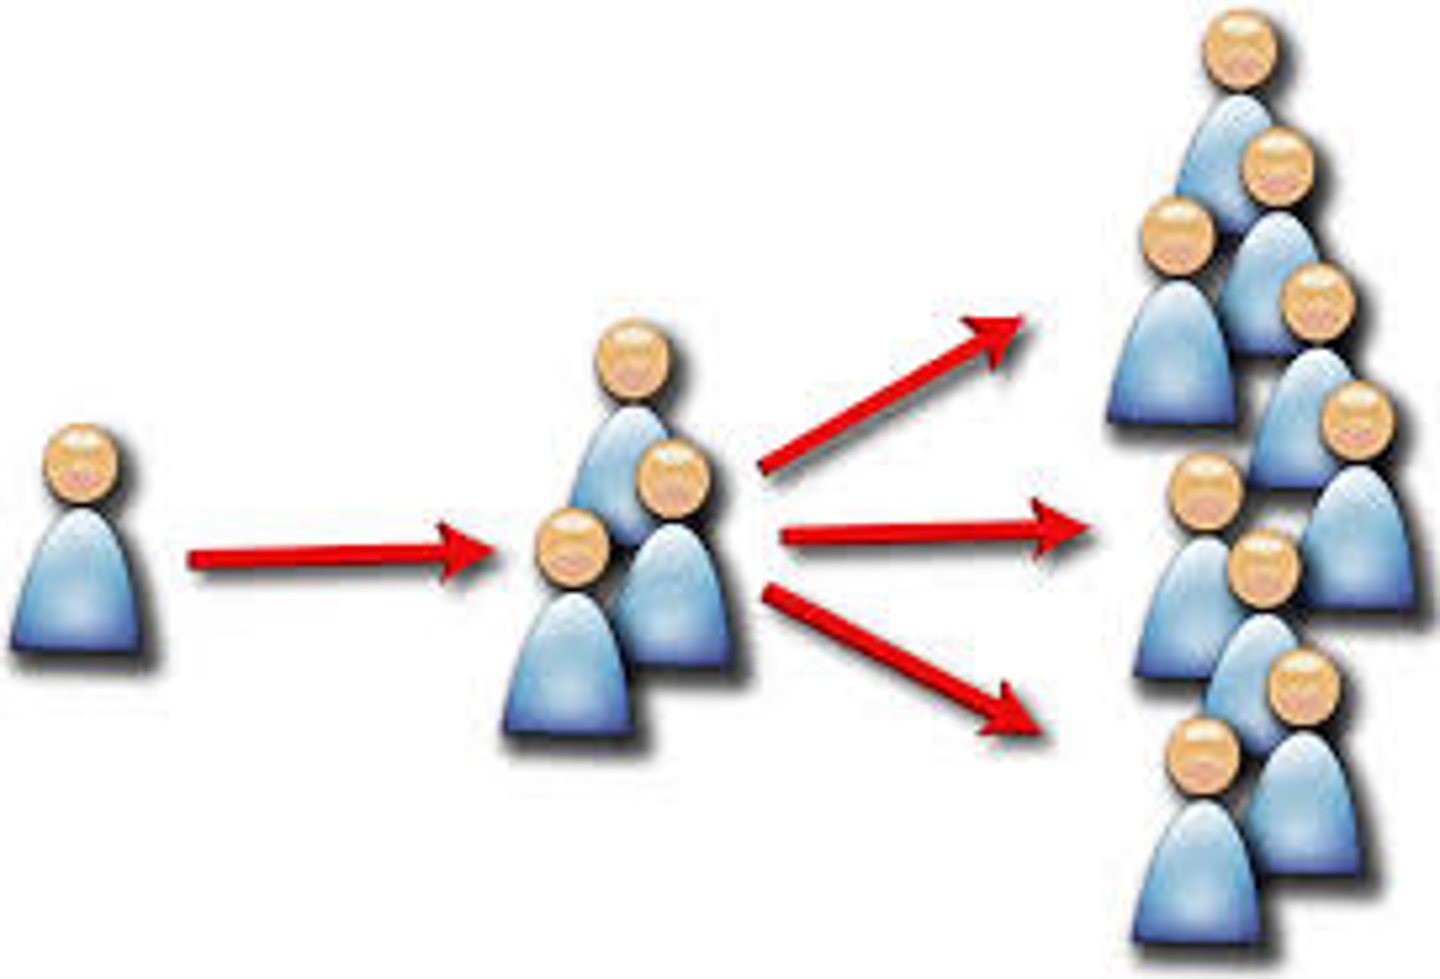
expansion diffusion
spread of a feature from one place to another in an additive process (includes hierarchical, contagious, and stimulus)
hierarchical diffusion
spread from a person or node of authority/power to other persons or places (ex: high fashion)
contagious diffusion
rapid, widespread diffusion of a characteristic throughout the population (ex: a viral video)
stimulus diffusion
spread of an underlying principle even though a specific characteristic is rejected (ex: veggie burgers at McDonald's in India)

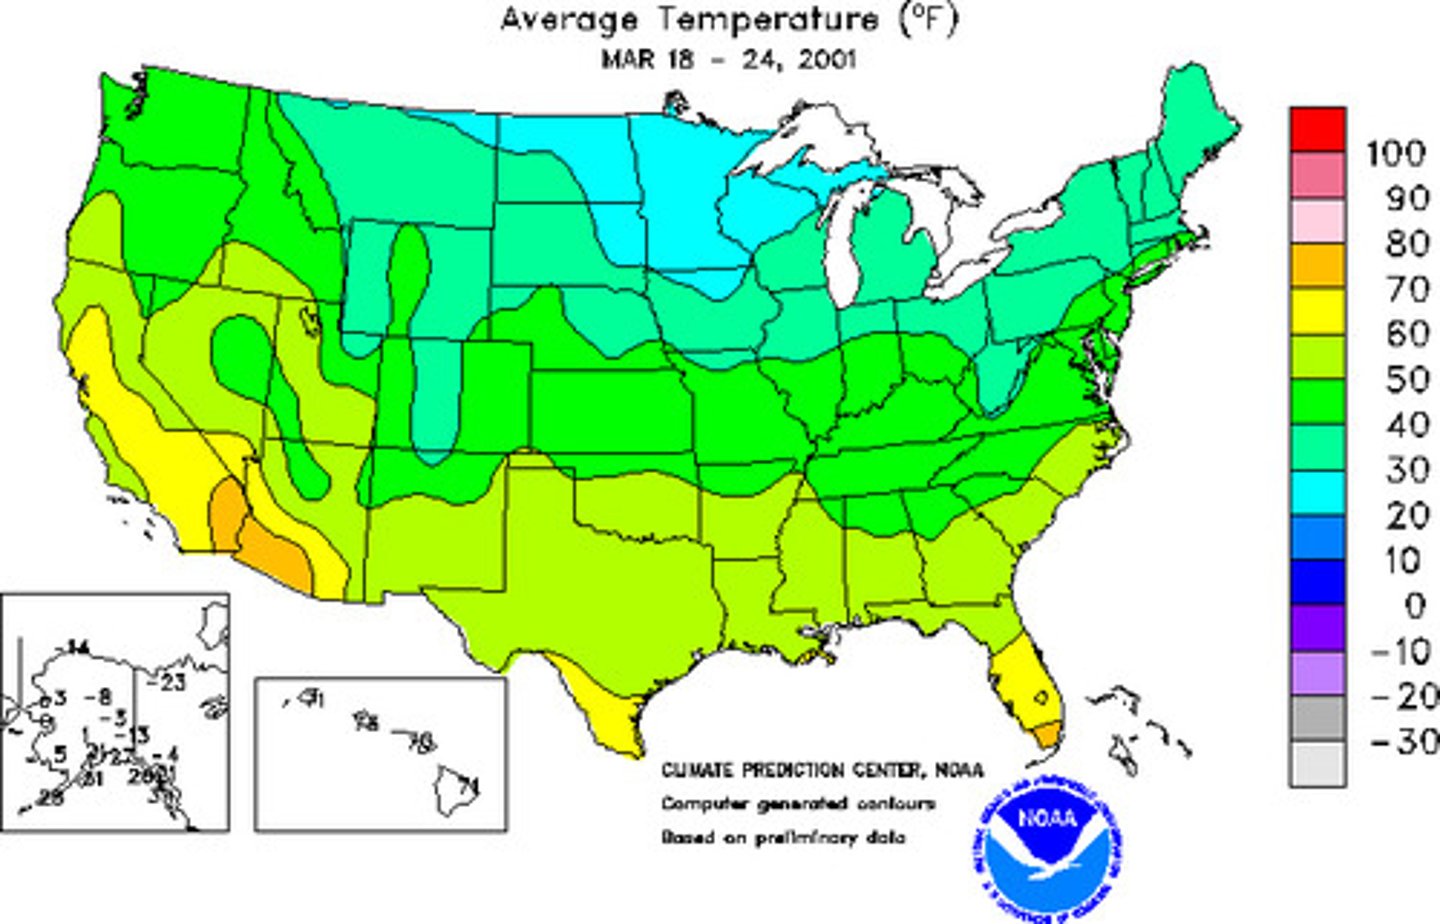
isoline map
map that connects points of equal value with lines (ex: topographic maps or weather maps)
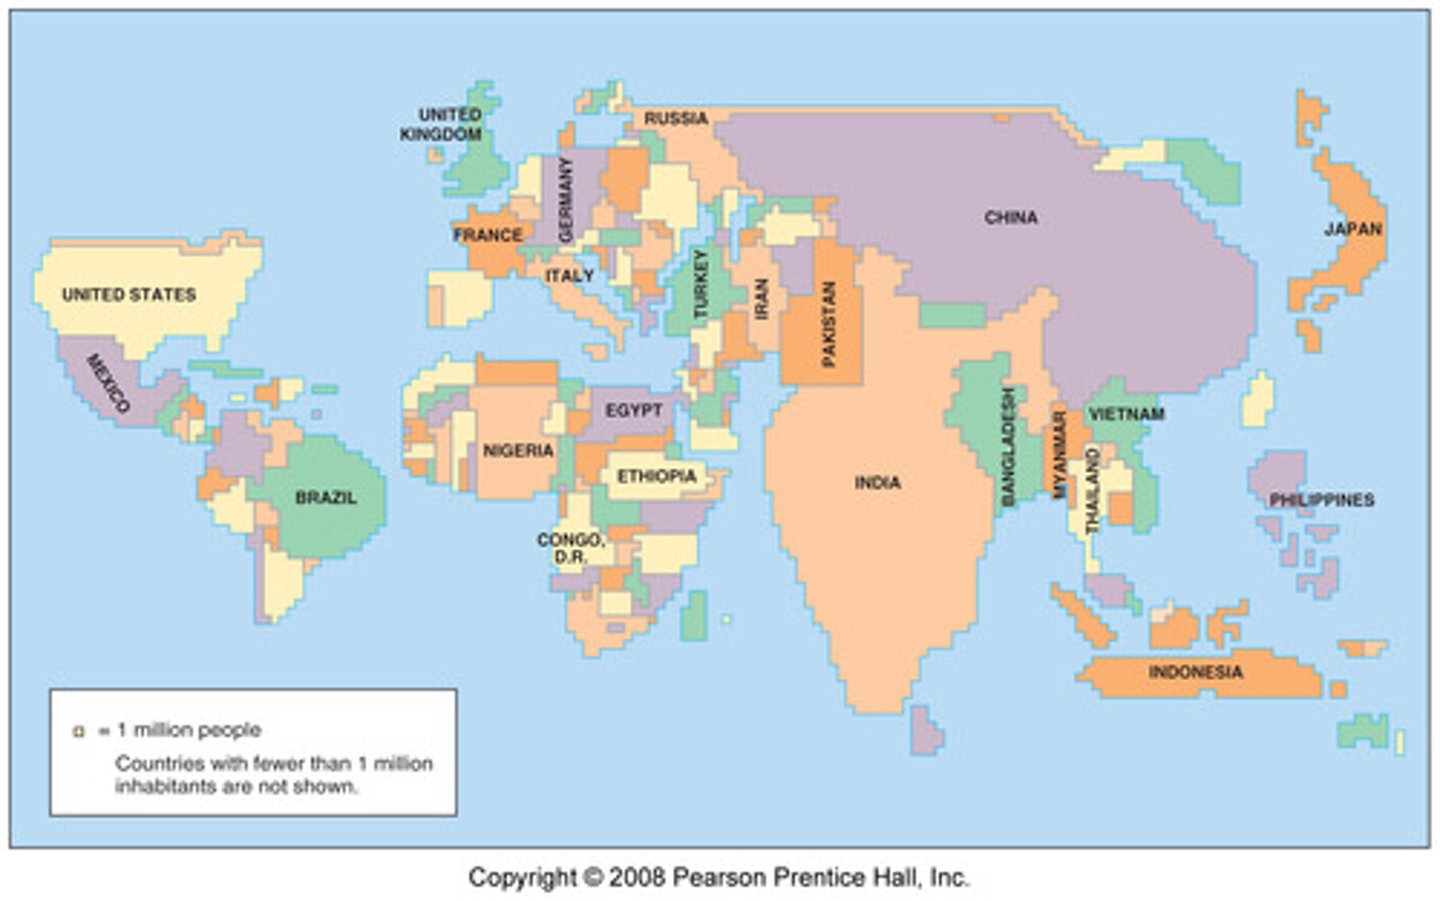
cartogram
map where the size of a country or region is adjusted to reflect a specific variable (ex: population)
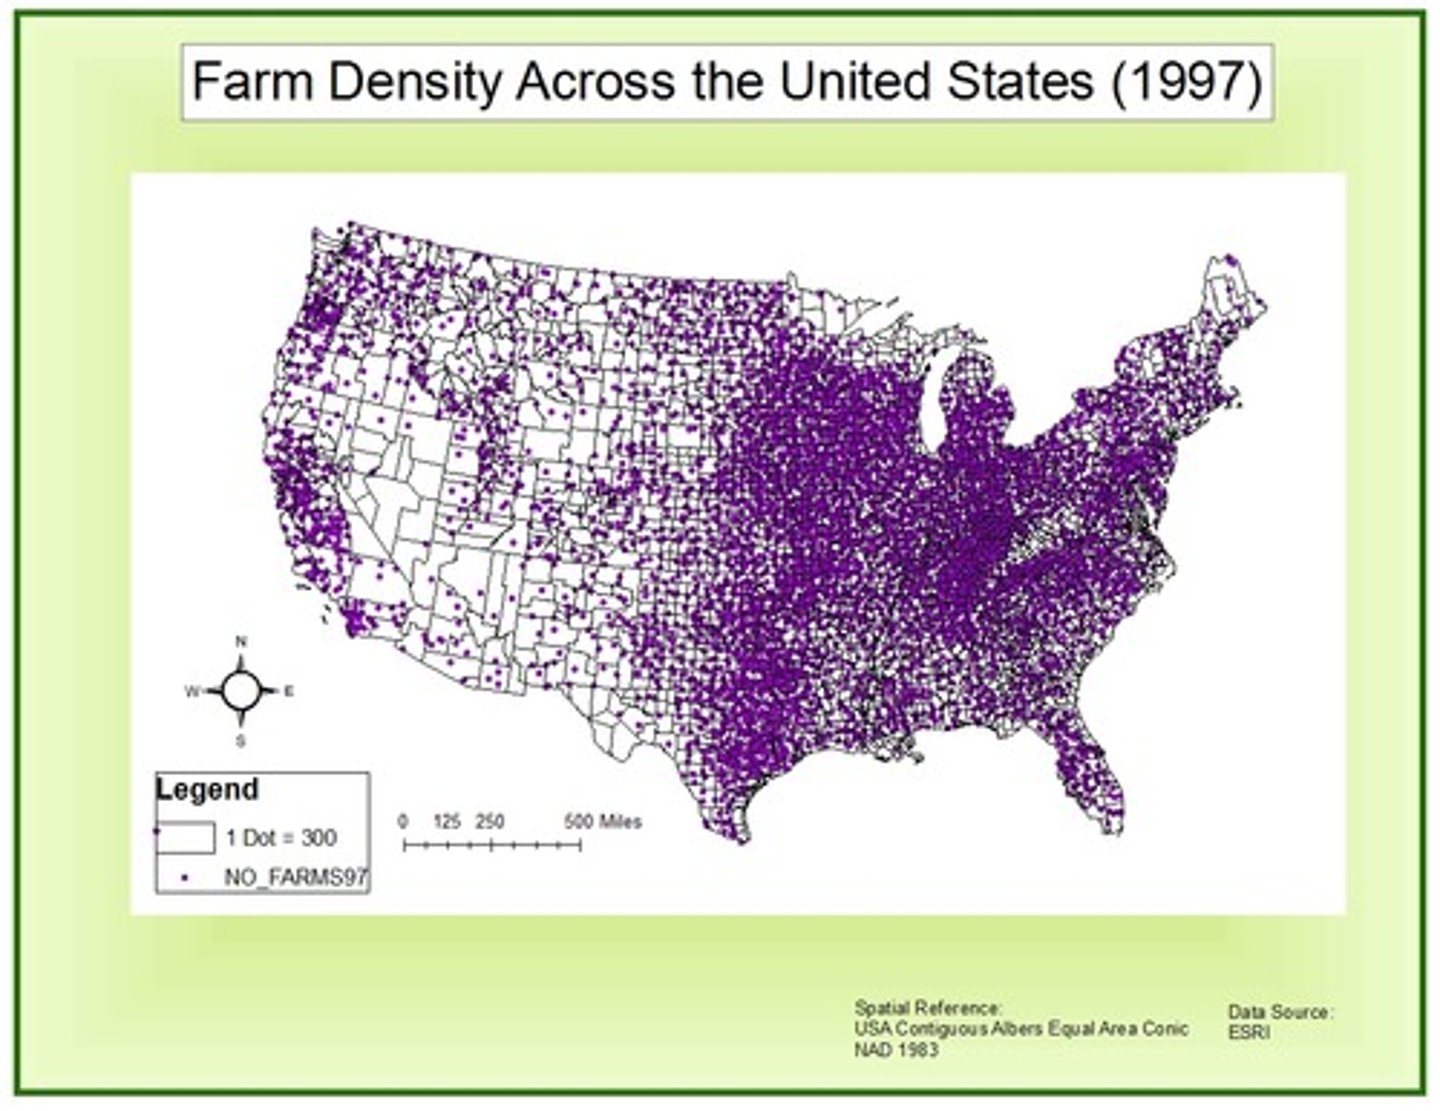
dot density map
map that uses dots to represent a specified quantity of a phenomenon; shows concentration vs. dispersion
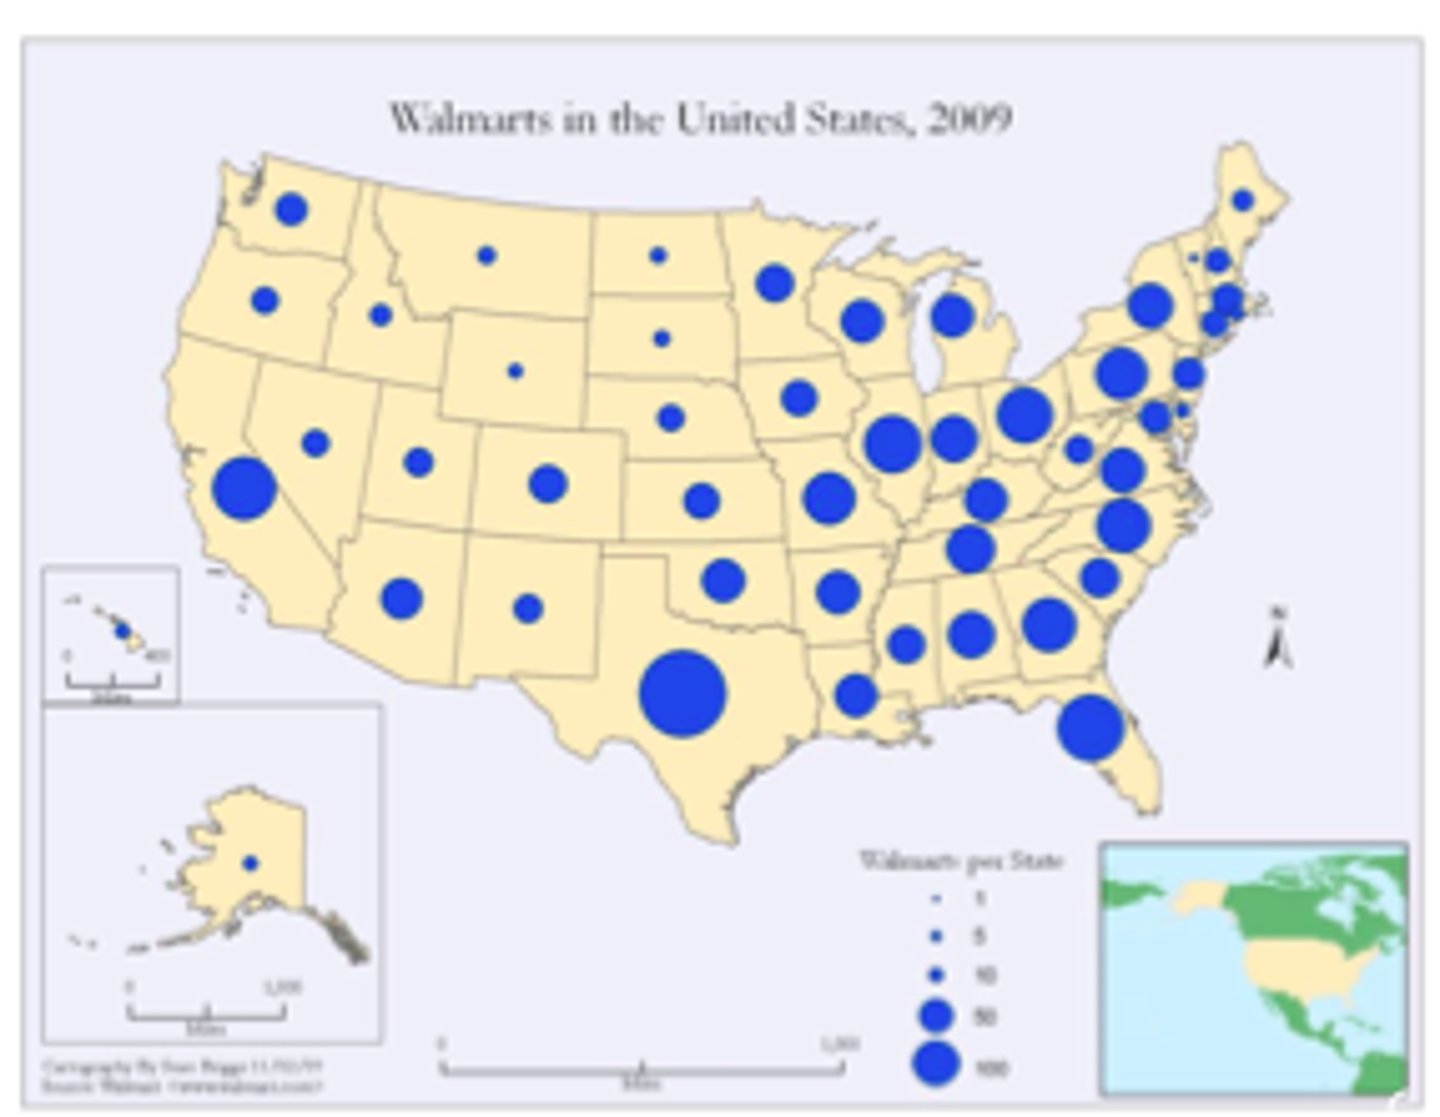
proportional symbol map
map where the size of a symbol (usually a circle) varies in proportion to the intensity of the variable
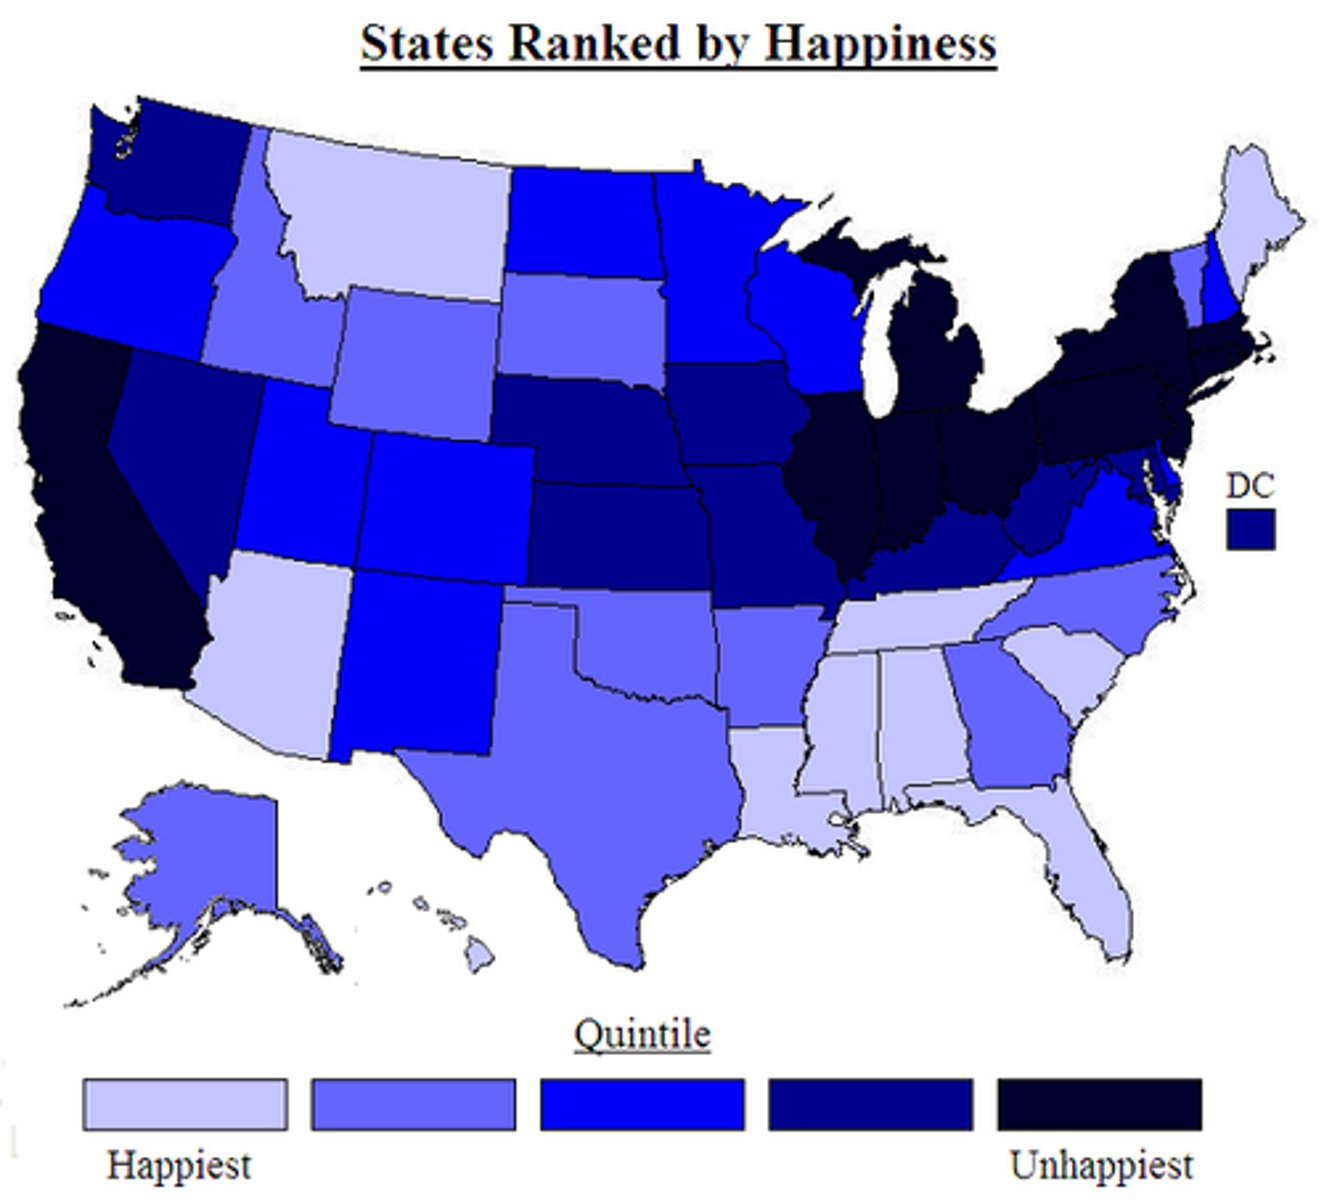
chloropeth map
map that uses different shading or coloring to represent different levels of a variable (ex: average income by state)
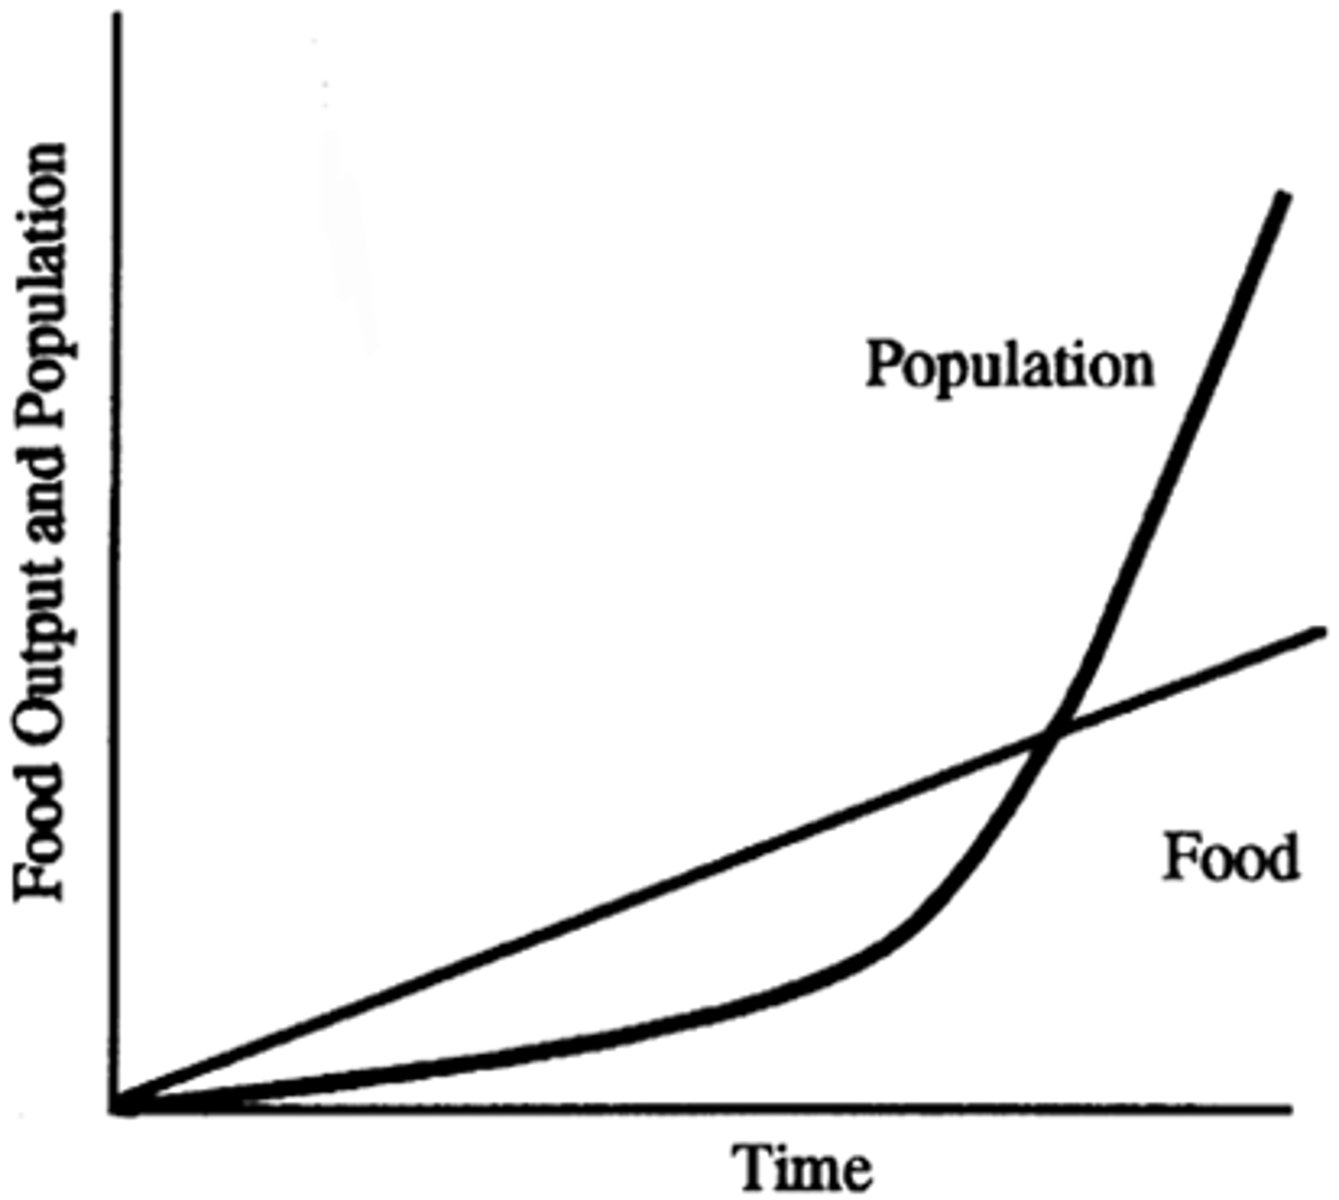
Malthus Population Catastrophe
theory that population grows geometrically while food supply grows arithmetically, leading to inevitable famine and war
Neo-Malthusians
modern believers in Malthus who warn that population growth is outstripping all resources (energy, water, land), not just food
Boserup's Hypothesis of Population (anti-Malthusian)
anti-Malthusian" view that population growth stimulates agricultural intensification and technological innovation ("necessity is the mother of invention")
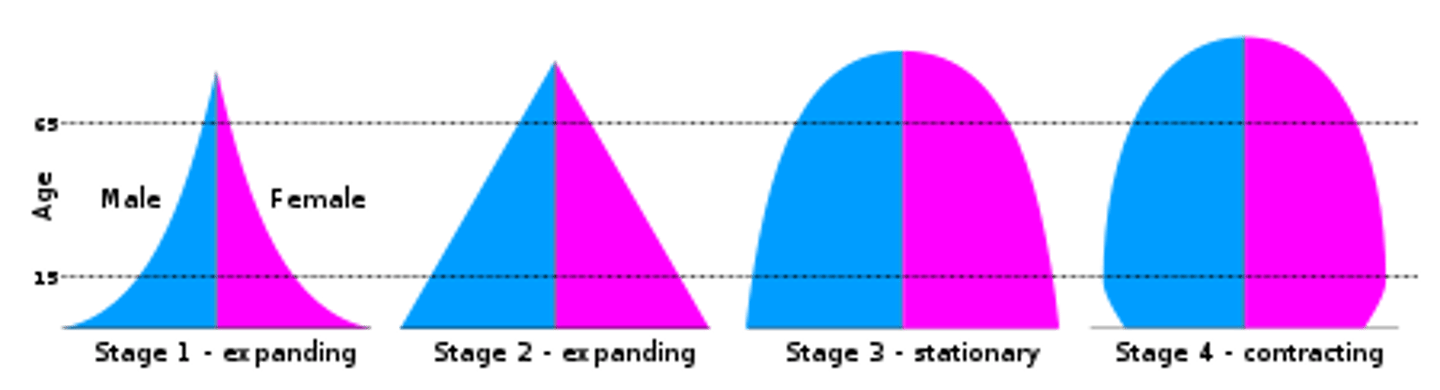
population pyramid components
X-axis shows percentage/total of population; Y-axis shows age cohorts; split down the middle by gender (men <- \ women ->)
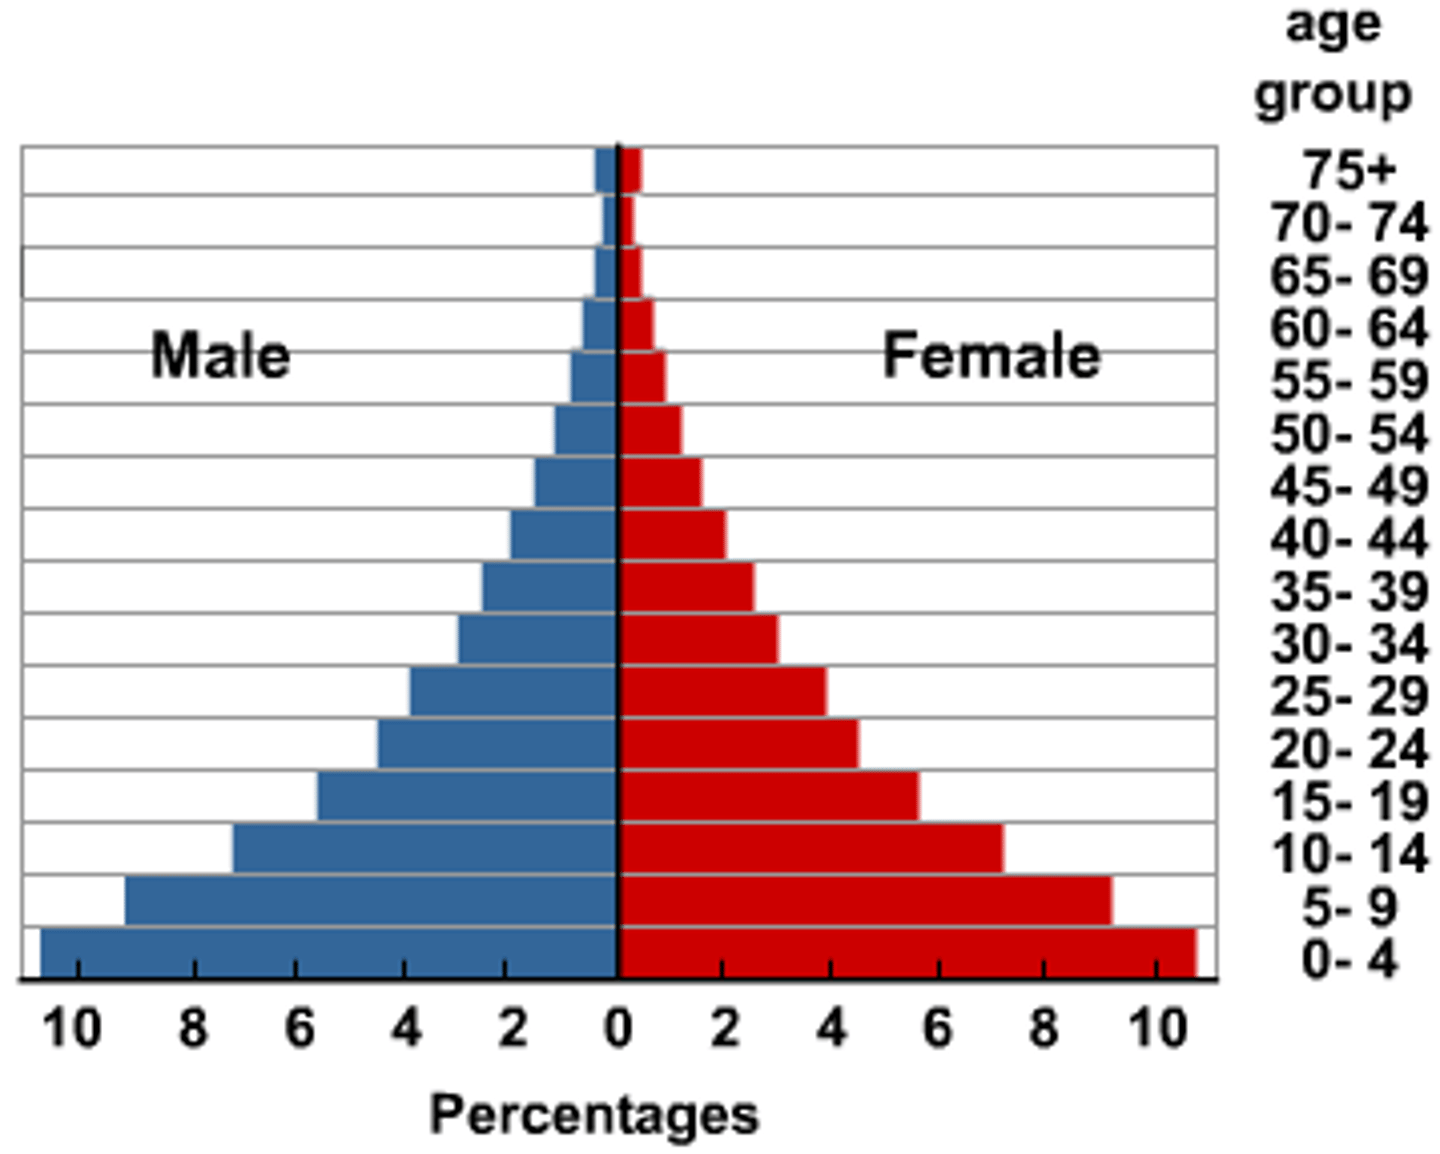
population pyramid shapes
triangle (rapid growth/LDC); column (slow/stable growth/MDC); cup/pentagon (declining growth)
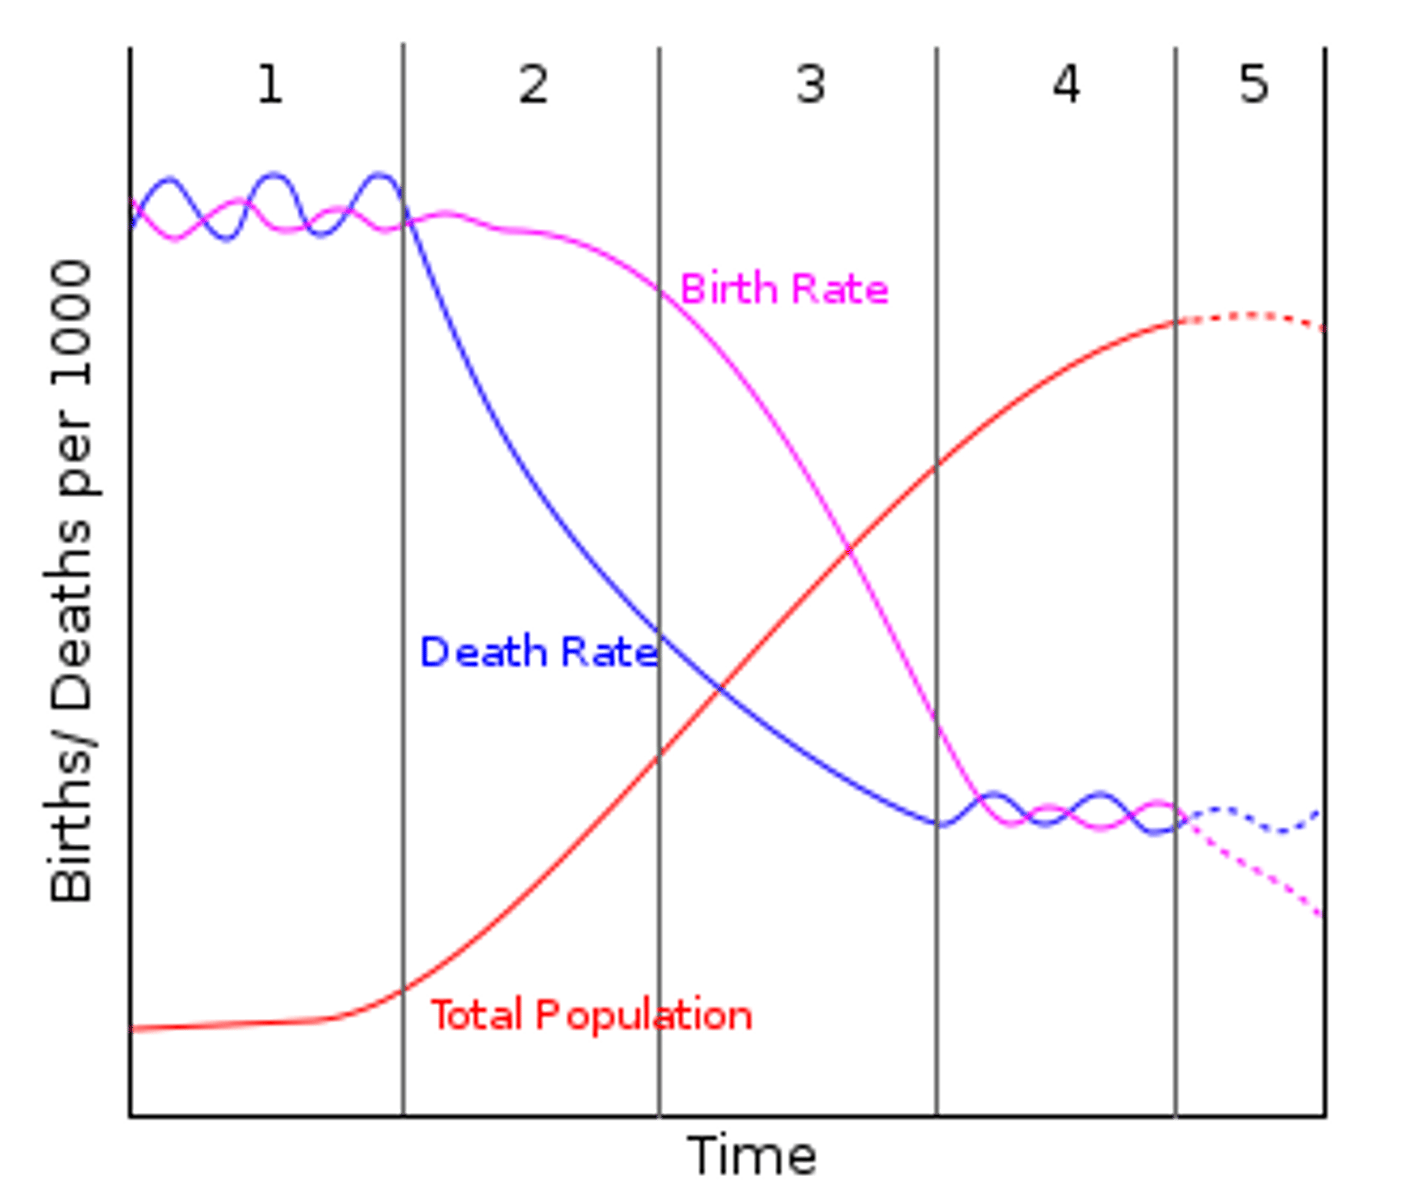
Demographic Transition Model (DTM)
5-stage process of change in a society's population from high CBR/CDR to low CBR/CDR
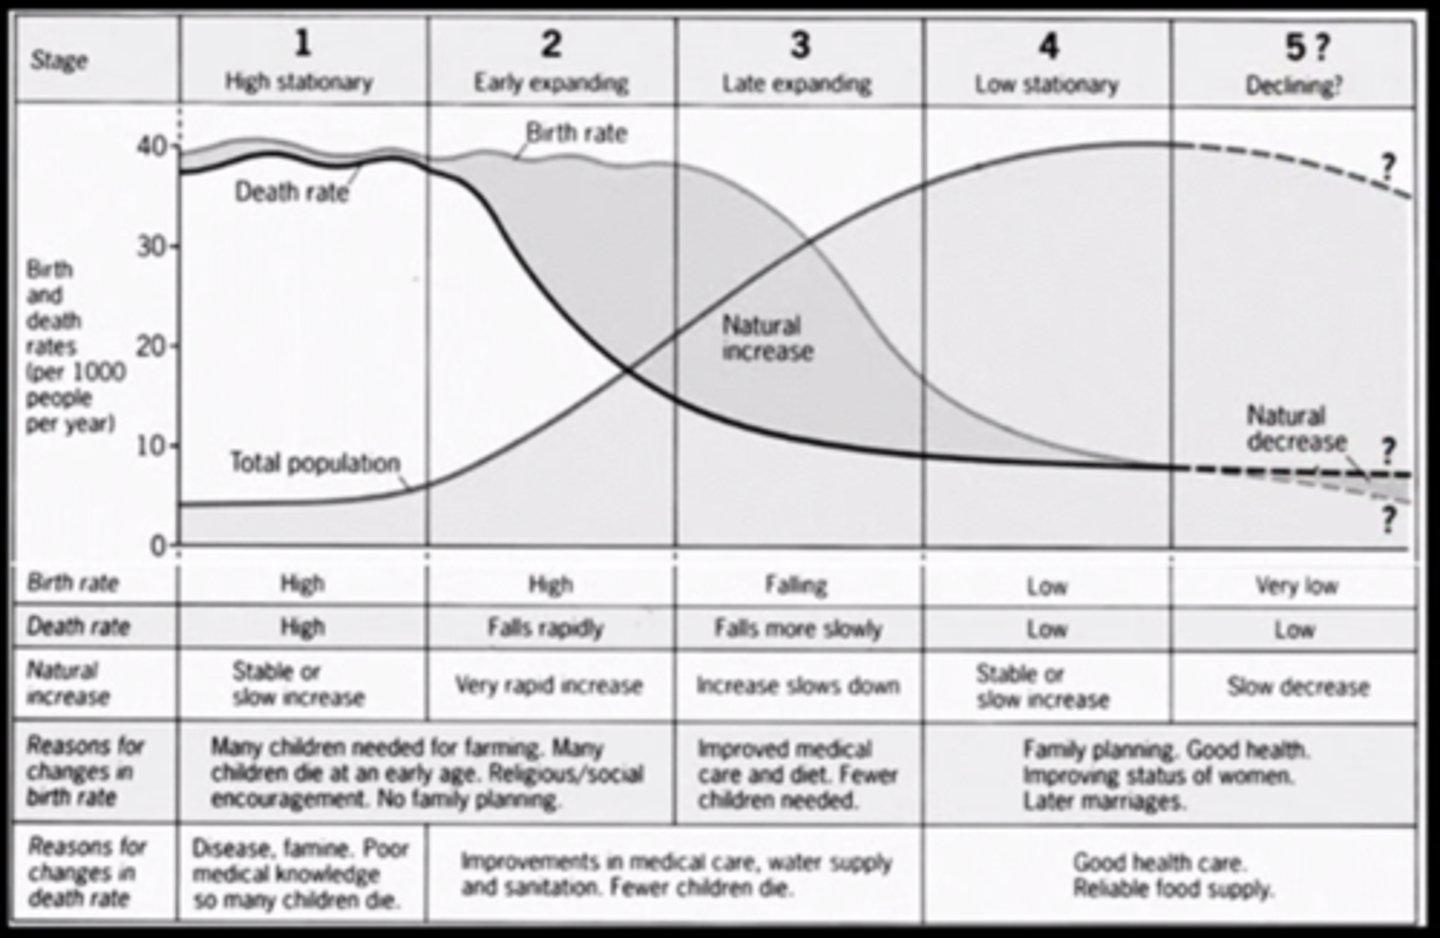
DTM visual
graph showing three lines: Birth Rate (drops later), Death Rate (drops first), and Total Population (S-curve that rises as the gap between birth/death grows)
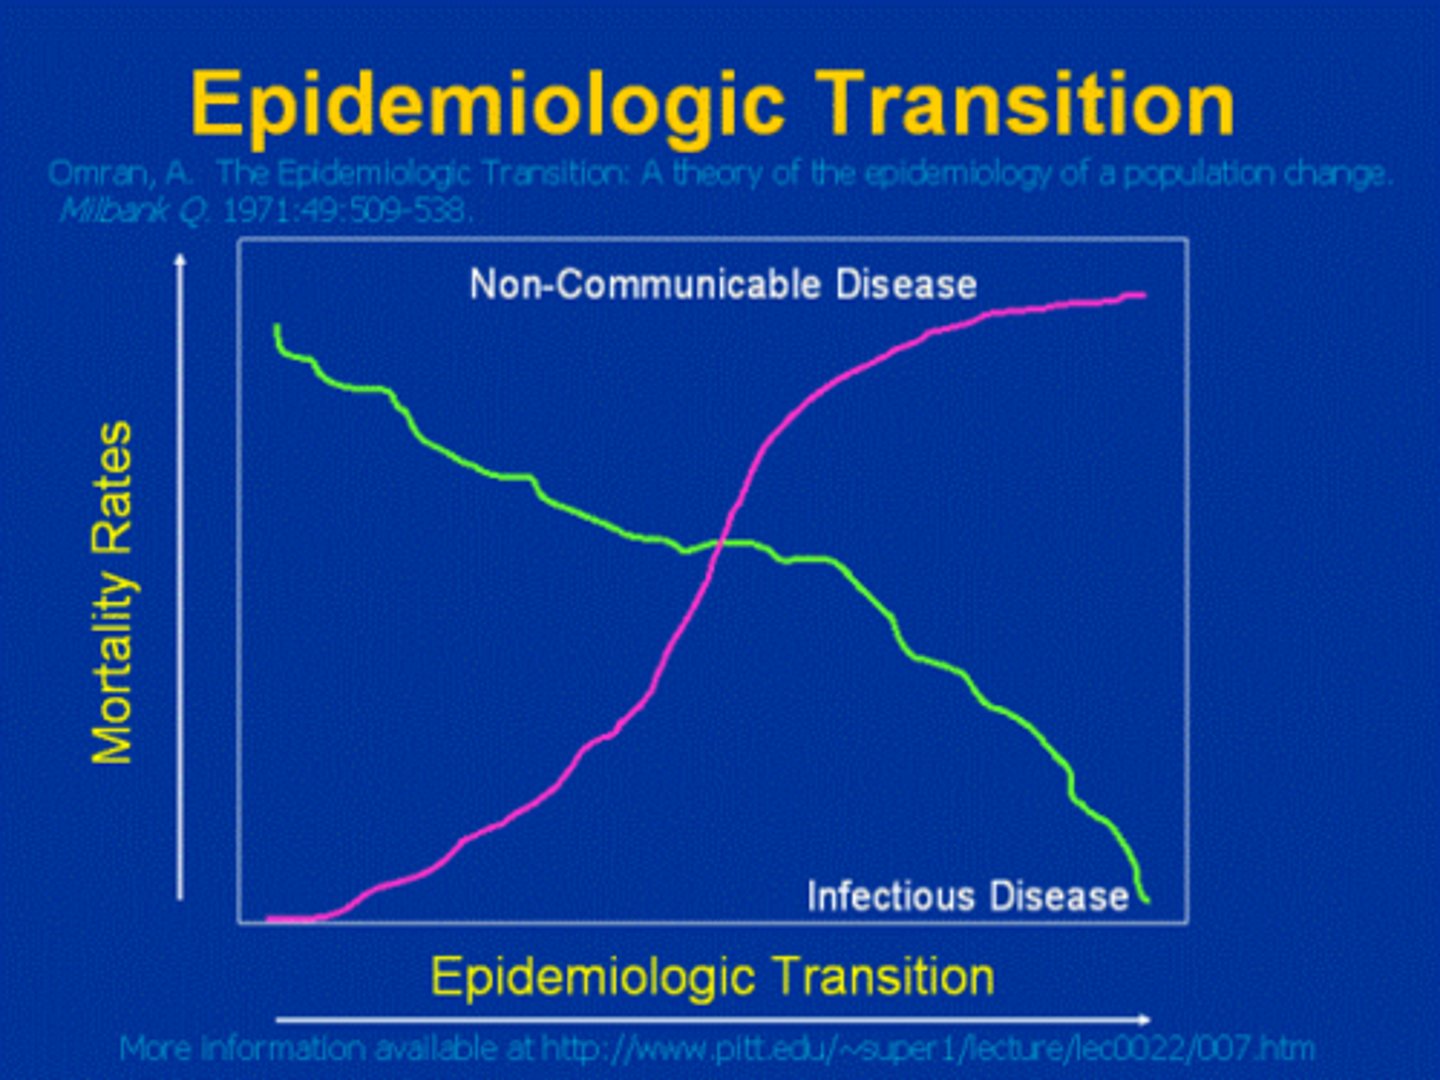
Epidemiologic Transition Model (ETM)
focuses on distinctive causes of death in each stage of the DTM (ex: Stage 1 - Pestilence; Stage 4 - Delayed degenerative diseases)
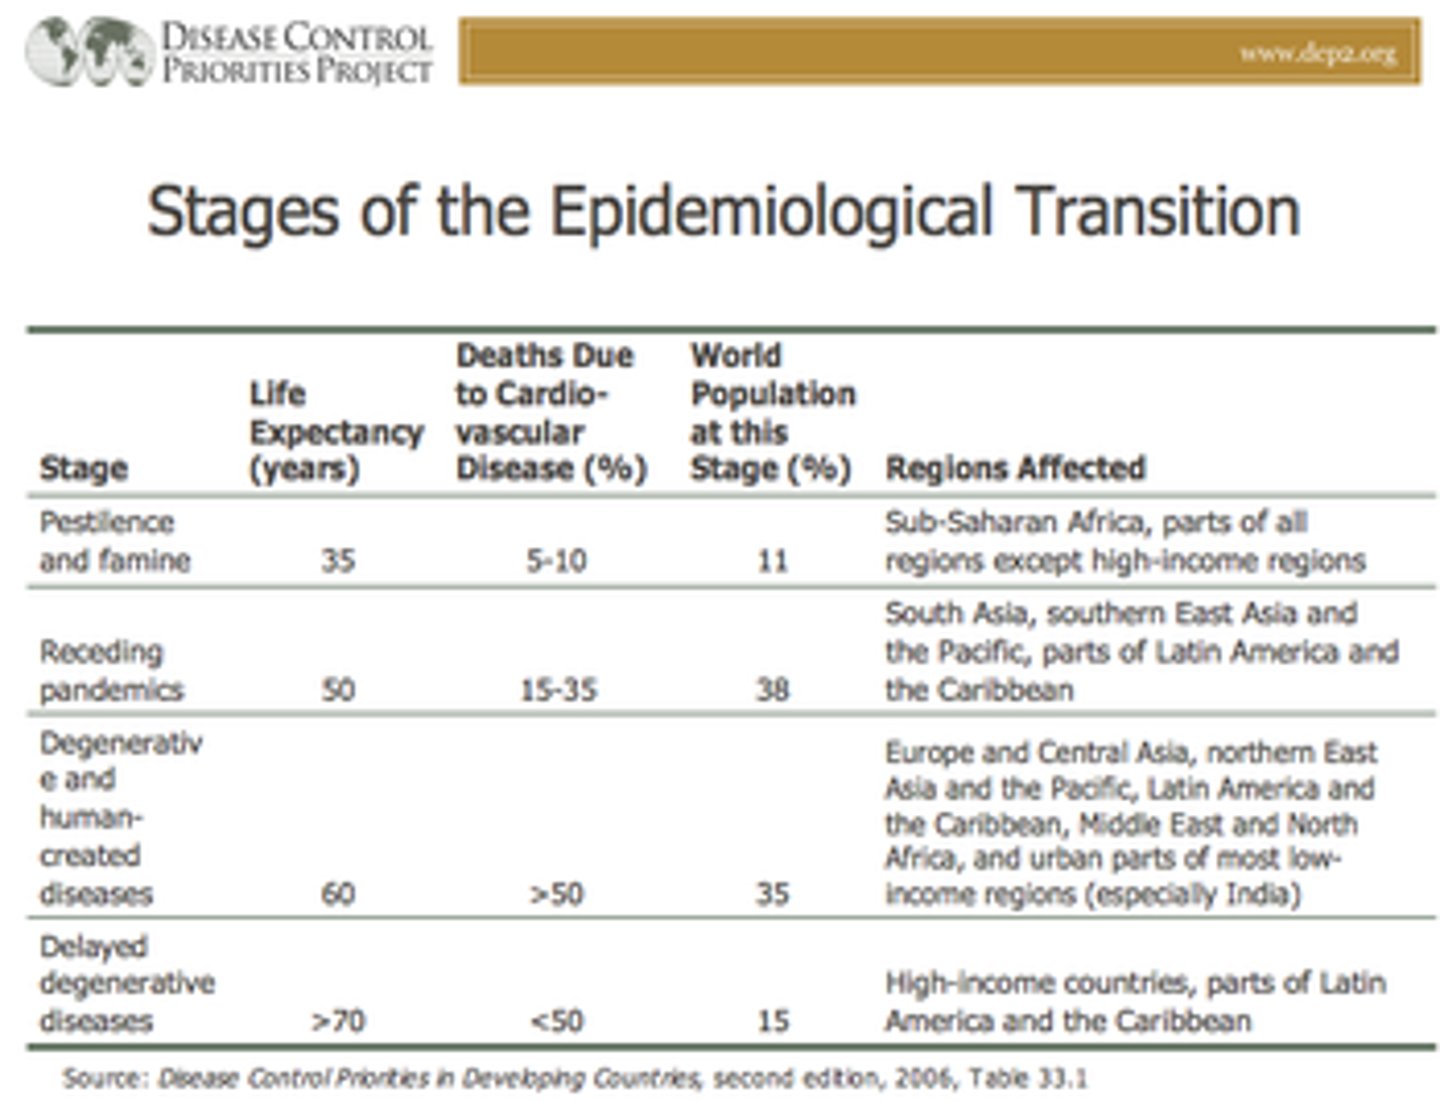
ETM visual
timeline showing a shift from infectious diseases (Stage 1/2) to chronic/degenerative diseases (Stage 3/4) to a potential return of resistant/evolved diseases (Stage 5)
Gravity Model of Spatial Interaction
predicts that the optimal location of a service is directly related to the number of people in the area and inversely related to the distance people must travel
Ravenstein's Laws of Migration
set of 11 "laws" noting that most migrants move short distances, to cities, and are typically young adults
Zelinsky Model of Migration Transition
claims that the type of migration changes as a country moves through the DTM (ex: Stage 2 moves internationally; Stage 3/4 moves internally)
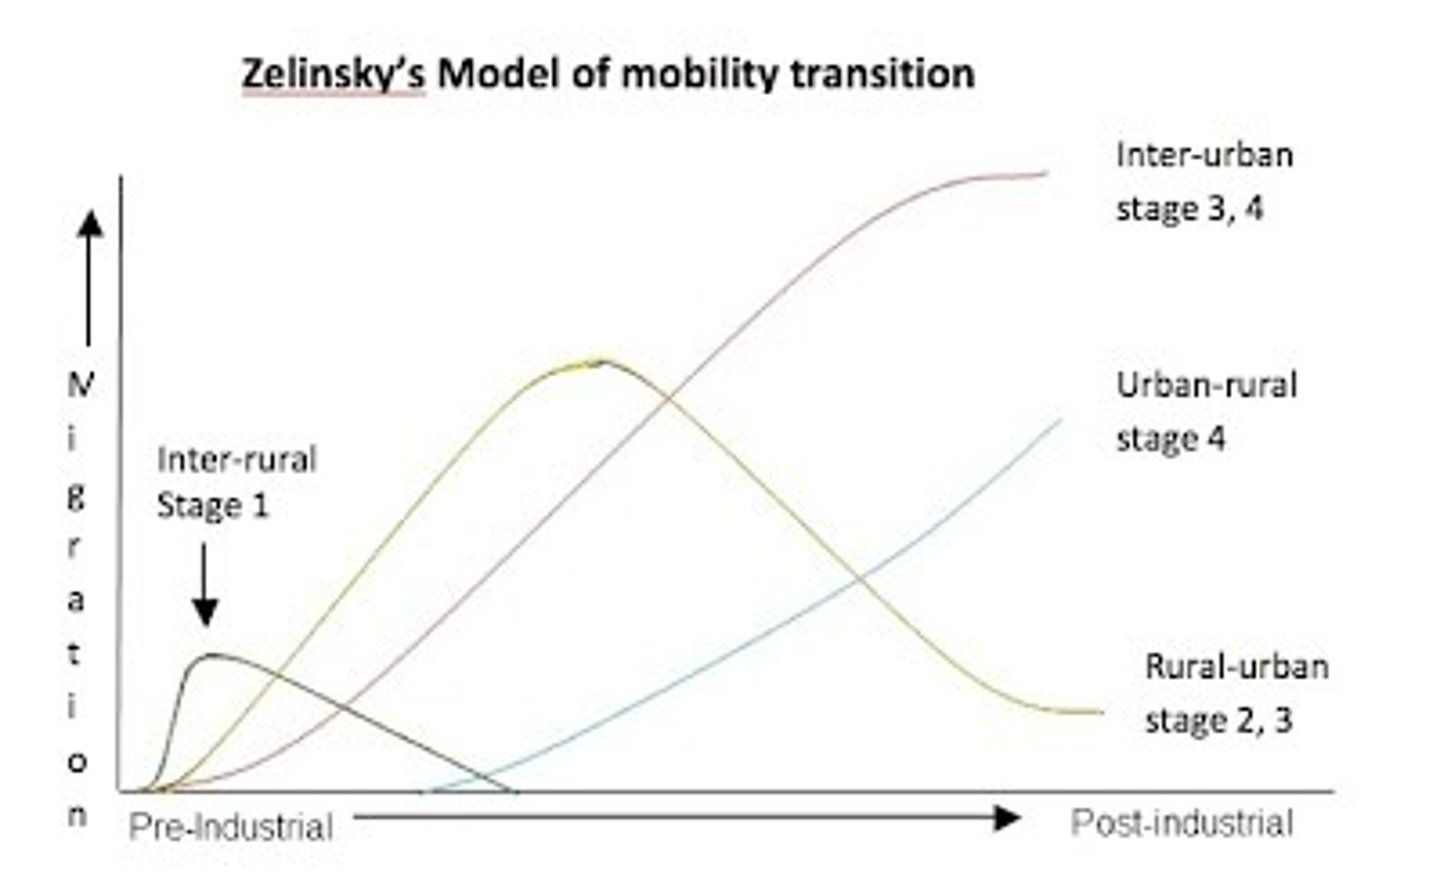
MTM visual (Zelinsky)
chart showing that Stage 2 countries have high international emigration, while Stage 3 and 4 countries have high internal/intraregional migration

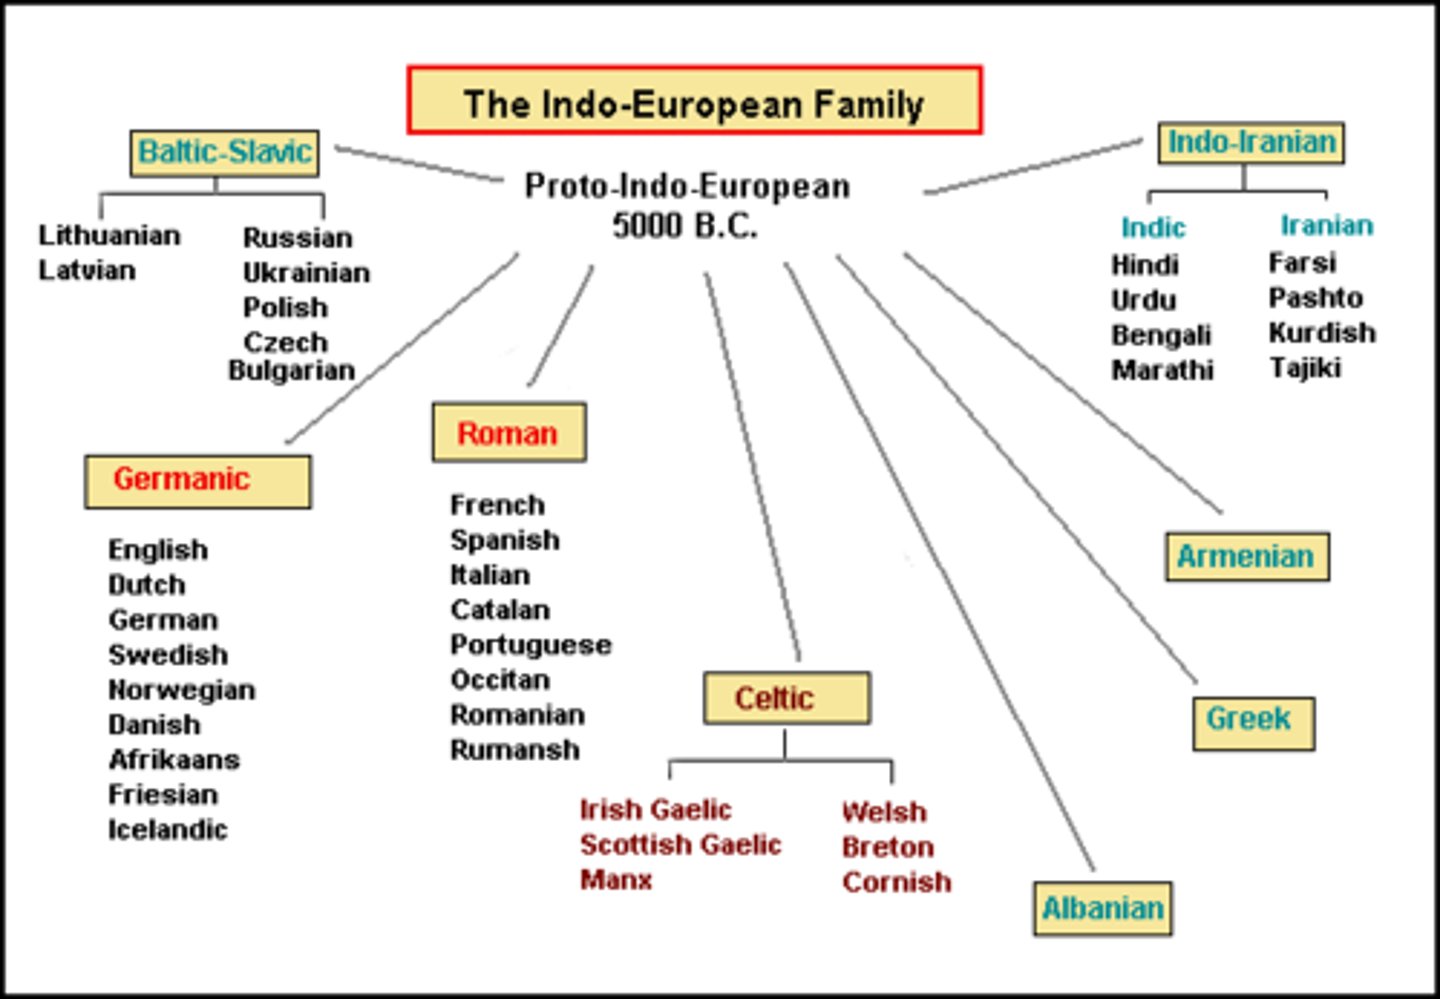
Indo-European Language
world's most widely spoken language family, including English, Spanish, Hindi, and Russian
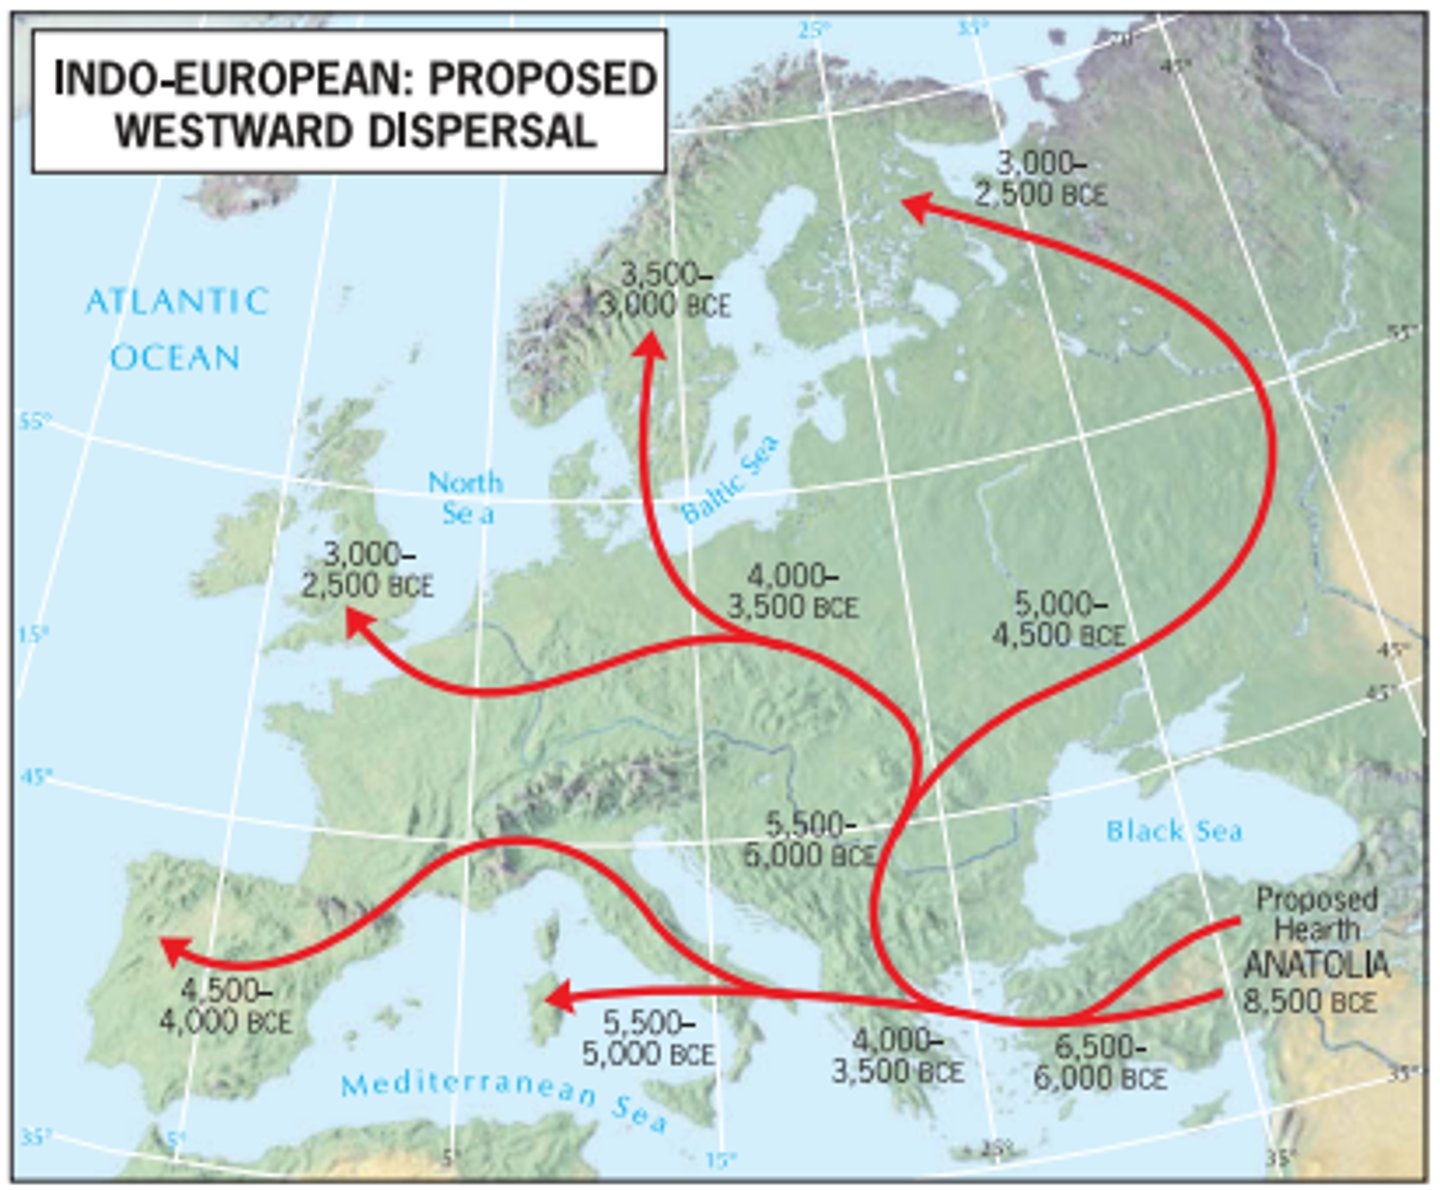
Sedentary Farmer Theory (Agriculture)
theory that Indo-European languages spread from Anatolia (Turkey) through the peaceful sharing of farming practices
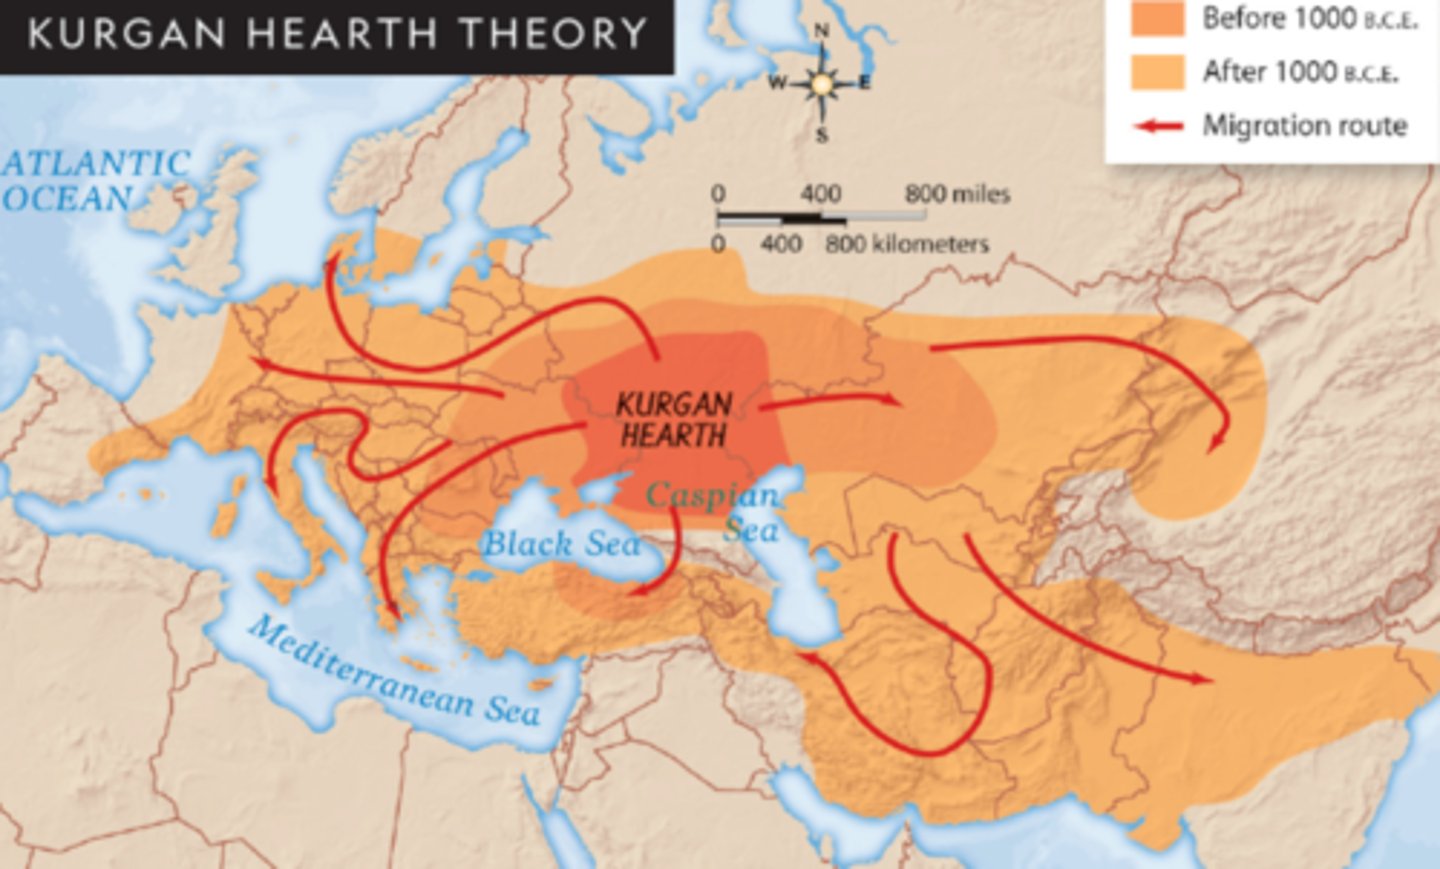
Nomadic Warrior Theory (Conquest)
theory that Indo-European languages spread via horse-mounted Kurgans conquering land (war)
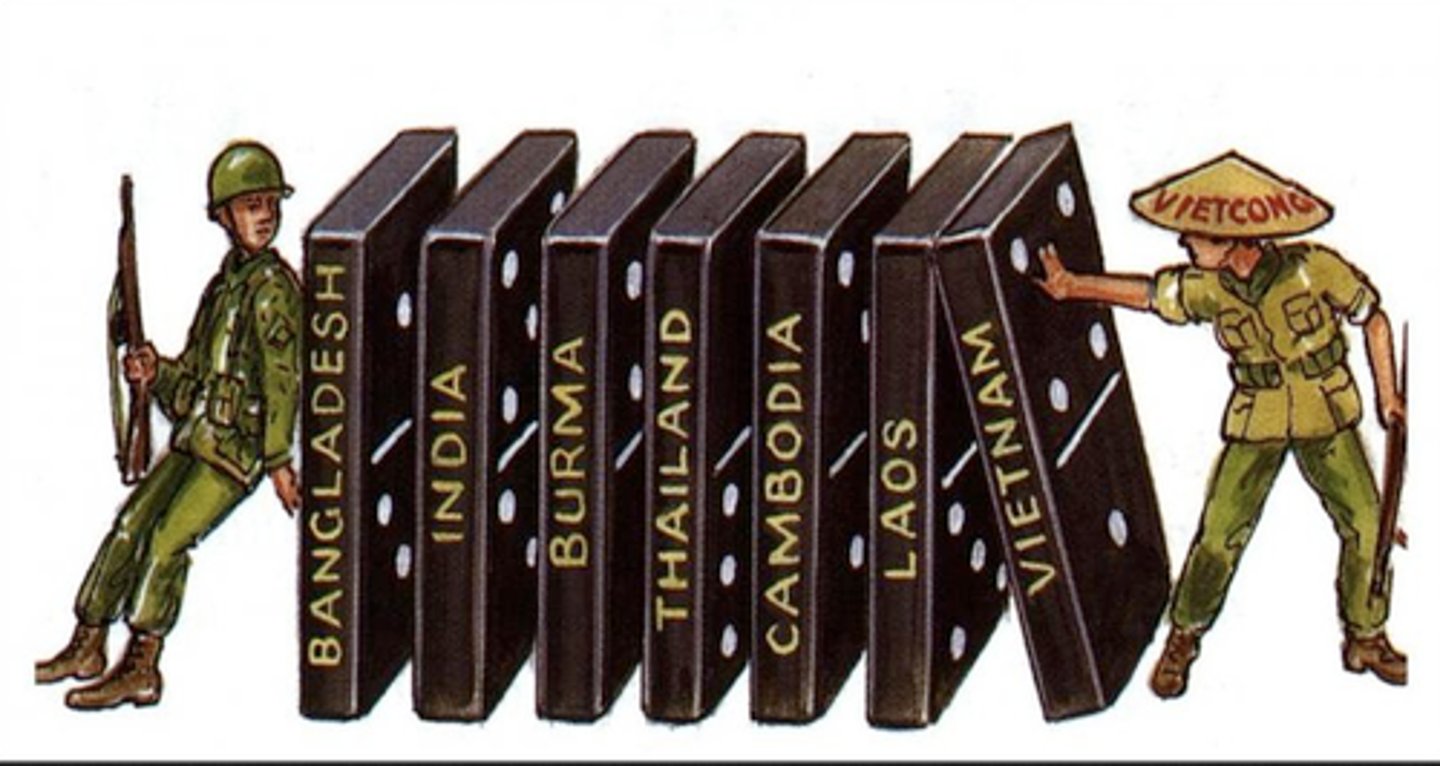
Domino Theory
political theory that if one nation comes under Communist control, neighboring nations will also fall (Cold War era)
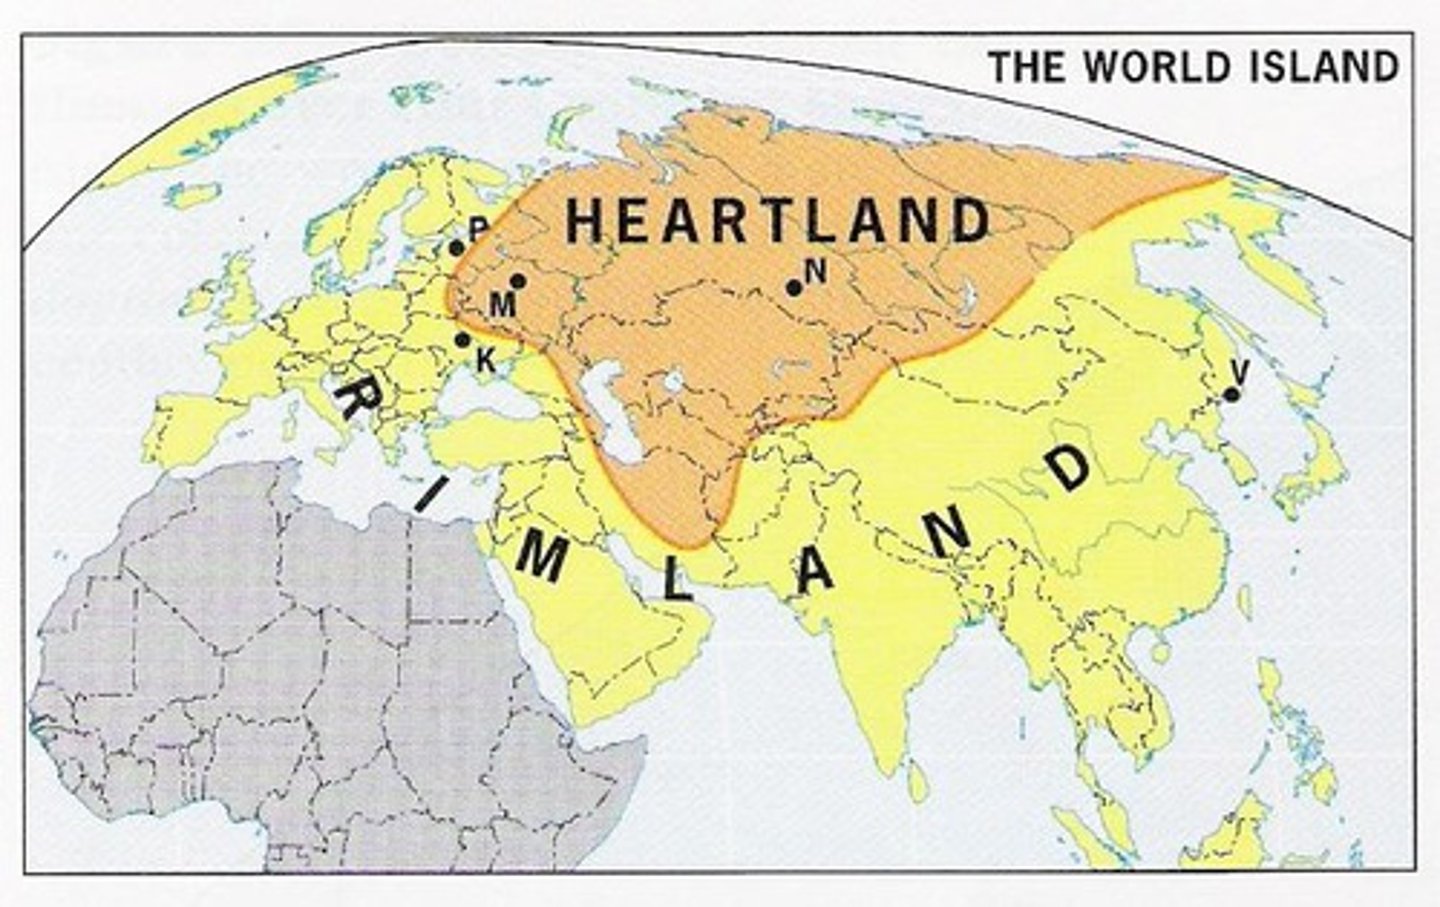
Heartland Theory (Mackinder)
geopolitical hypothesis that whoever controls Eastern Europe/Central Asia (the "Heartland") would eventually control the world
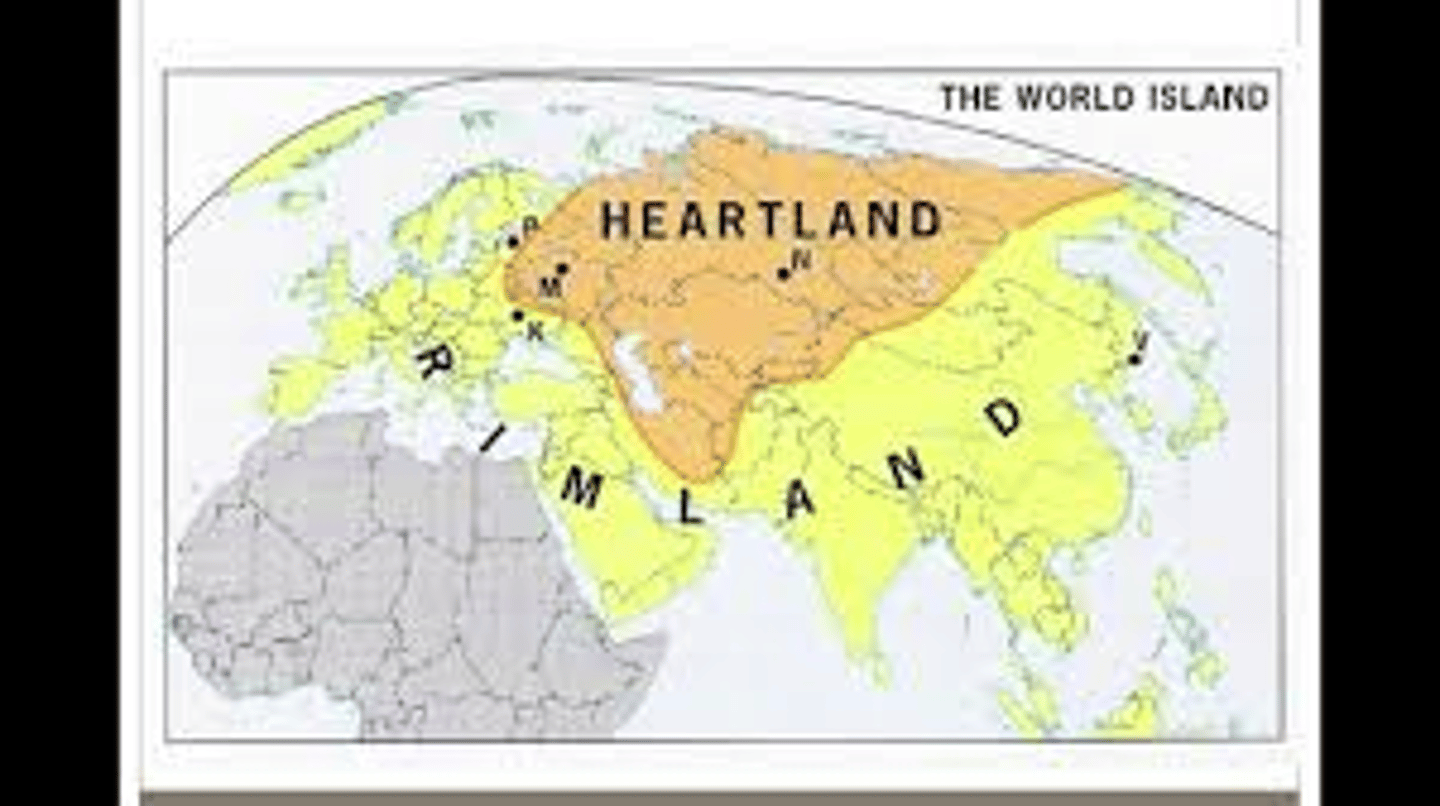
Rimland Theory (Spykman)
theory that the coastal fringes of Eurasia (the "Rimland") are the key to global power, as they buffer the Heartland
rank-size rule
pattern of settlements in a country where the nth largest city is 1/n the population of the largest city
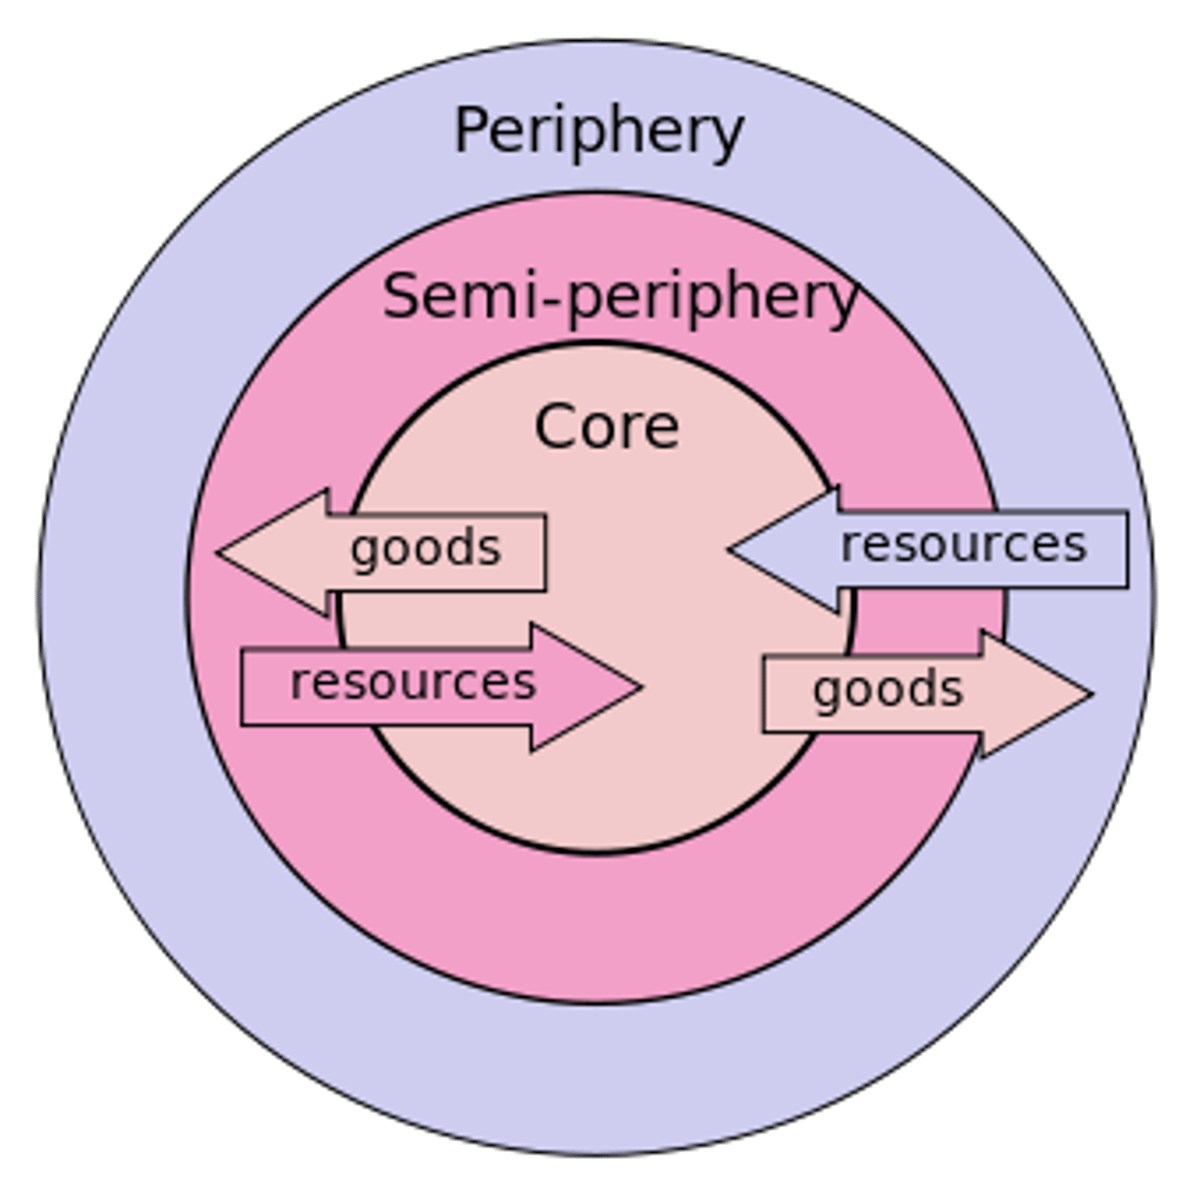
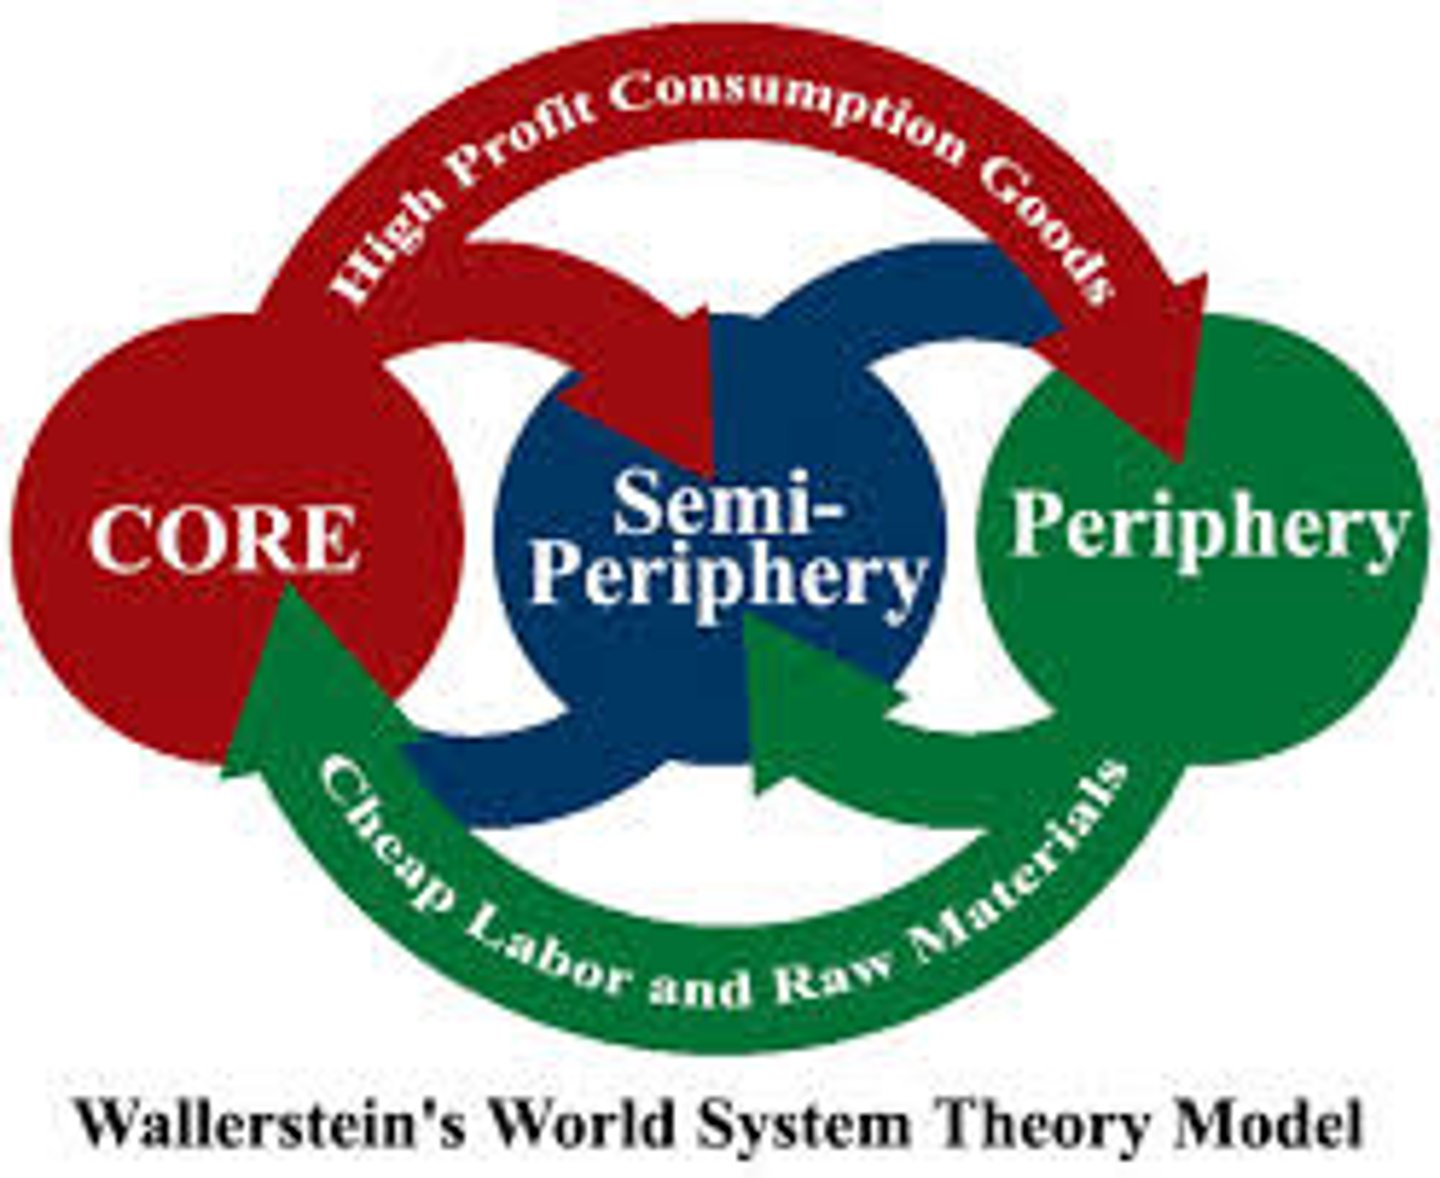
World Systems Theory (Wallerstein)
divides the world into Core, Semi-Periphery, and Periphery based on economic power and labor exploitation
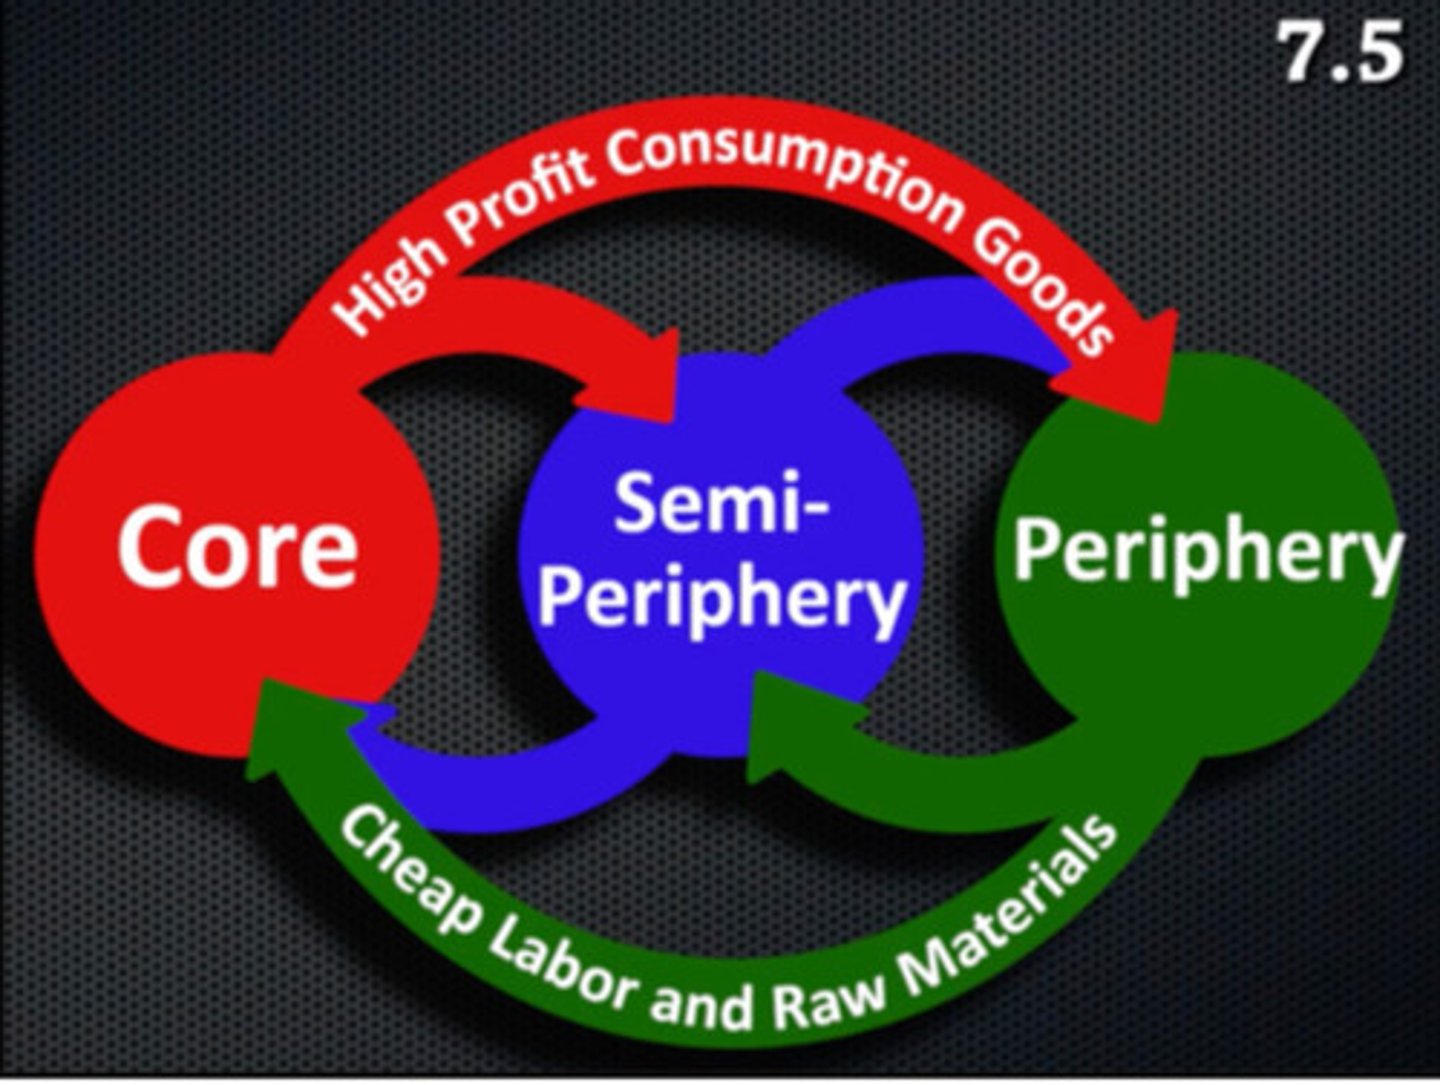
WST visual (Wallerstein)
concentric or tiered diagram showing the Core (buys raw materials, sells high-tech goods), Semi-Periphery (industrializing "middle-man"), and Periphery (provides cheap labor and raw materials)
von Thünen's Agricultural Model
explains the location of agricultural activities based on transportation costs and perishability of the product
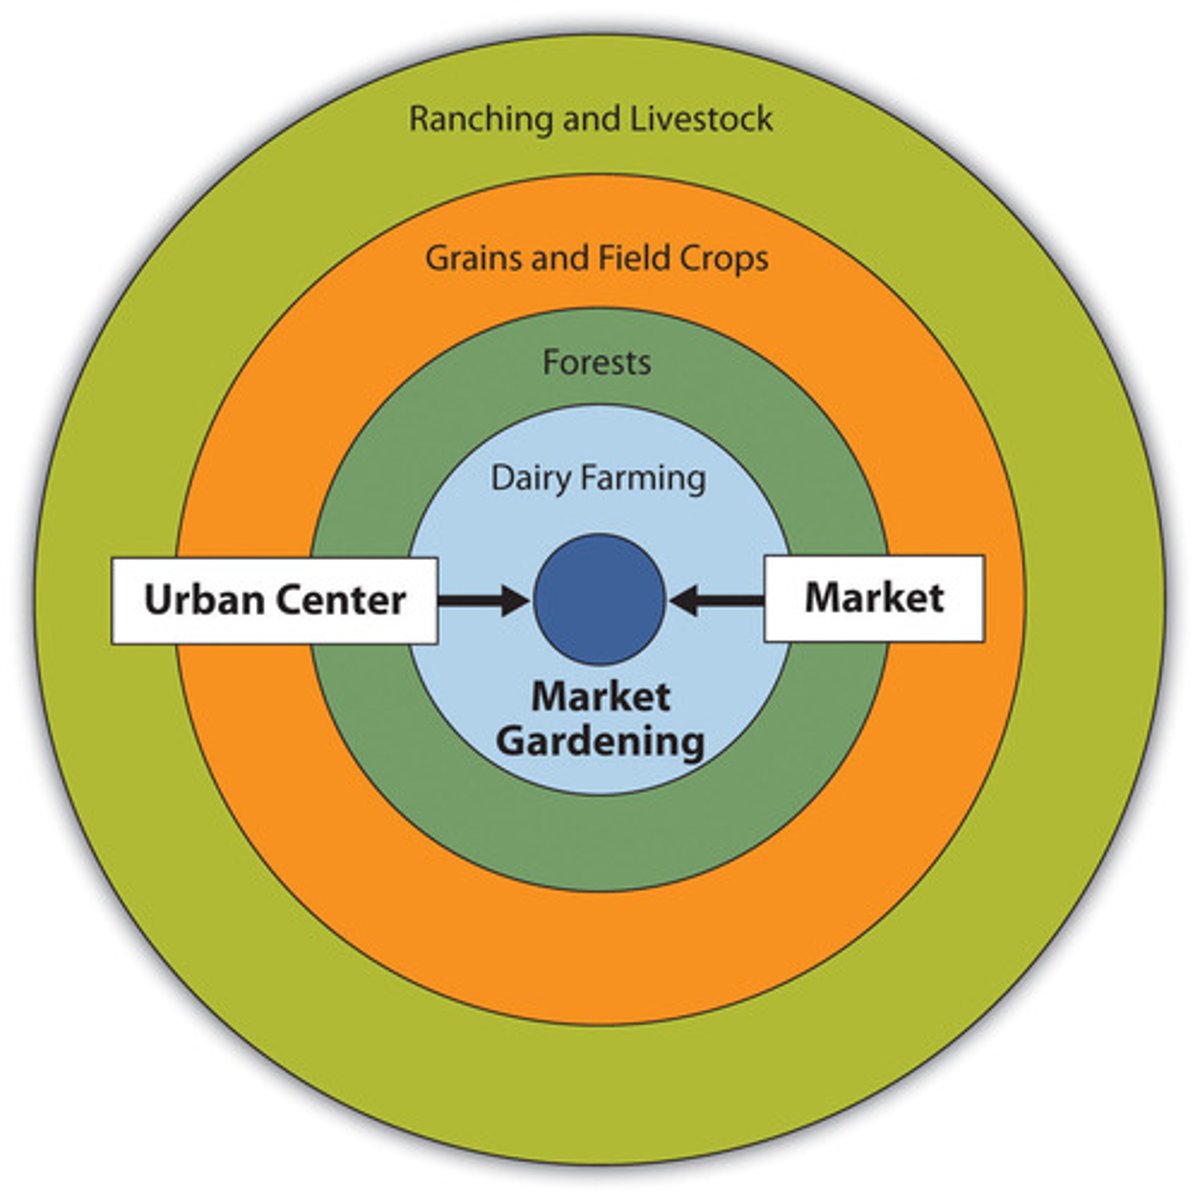
von Thünen Visual
series of concentric rings surrounding a central market: 1. Dairying/Gardening, 2. Forestry, 3. Extensive Field Crops, 4. Ranching

1st Agricultural Revolution
transition from hunting and gathering to sedentary agriculture (planting seeds and raising livestock); around 10,000 years ago
2nd Agricultural Revolution
occurred with the Industrial Revolution; used mechanization and crop rotation to increase yields for urban workers
3rd Agricultural Revolution
development of high-yield seeds (GMOs) and fertilizers in the mid-20th century to end world hunger
self-sufficiency
development strategy where a country protects local business from foreign competition by using tariffs, quotas, and licenses; the goal is balanced growth across all sectors

international trade path
development strategy where a country identifies its unique assets (natural resources or cheap labor) and sells them on the global market to fund further development.
Bid-Rent Theory
describes the price and demand for real estate; land is most expensive near the Central Business District (CBD), so use is more intensive
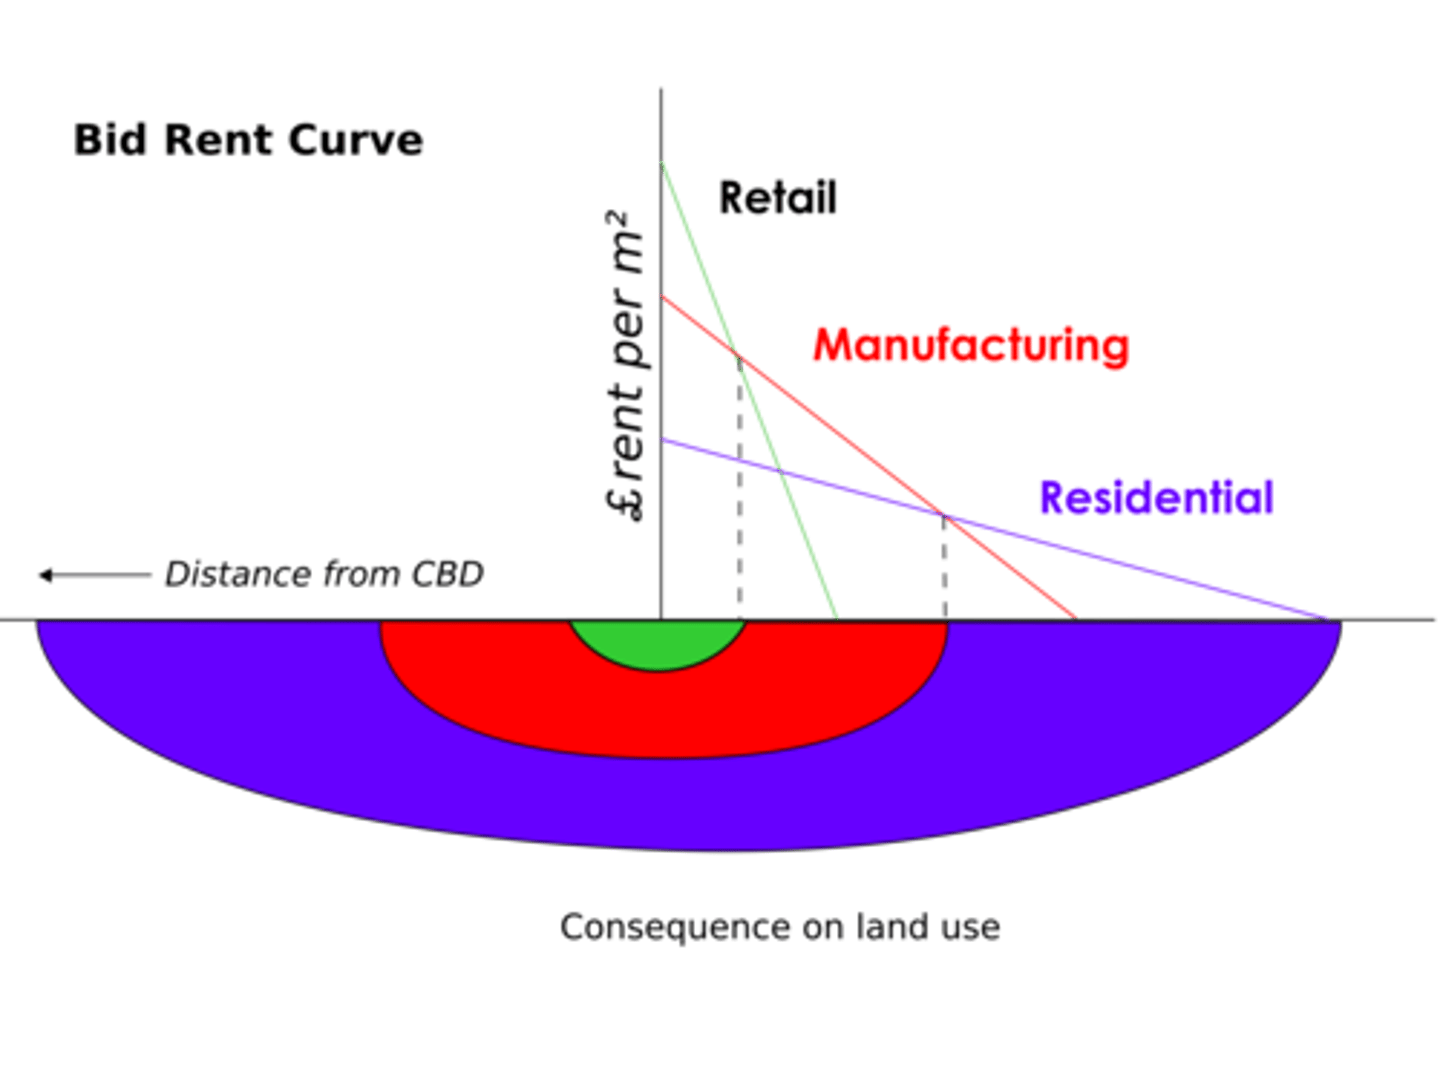
Bid-Rent visual
line graph where the y-axis is land cost and the x-axis is distance from CBD; lines for commerce, industry, and residential intersect at different slopes

Liberal Models (International Trade)
argue that all countries can develop by following the same path (ex: Rostow) and engaging in global markets
Structuralist Models (Dependency Theory)
argue that LDCs are kept poor by the structure of the global economy and reliance on MDCs
New International Division of Labor
transfer of low-paid, less-skilled jobs (manufacturing) from MDCs to LDCs, while MDCs keep high-skilled service jobs
Rostow's Stages of Growth
5-stage model of development: 1. Traditional, 2. Preconditions for Take-off, 3. Take-off, 4. Drive to Maturity, 5. High Mass Consumption
Fordism
system of mass production where each worker is assigned one specific, repetitive task (assembly line)
Post-Fordism
lean production; flexible manufacturing where teams work on varied tasks and use computer-controlled machinery
Locational Interdependence (Hotelling)
theory that industries/services will locate near competitors to maximize sales (ex: two gas stations at the same intersection)
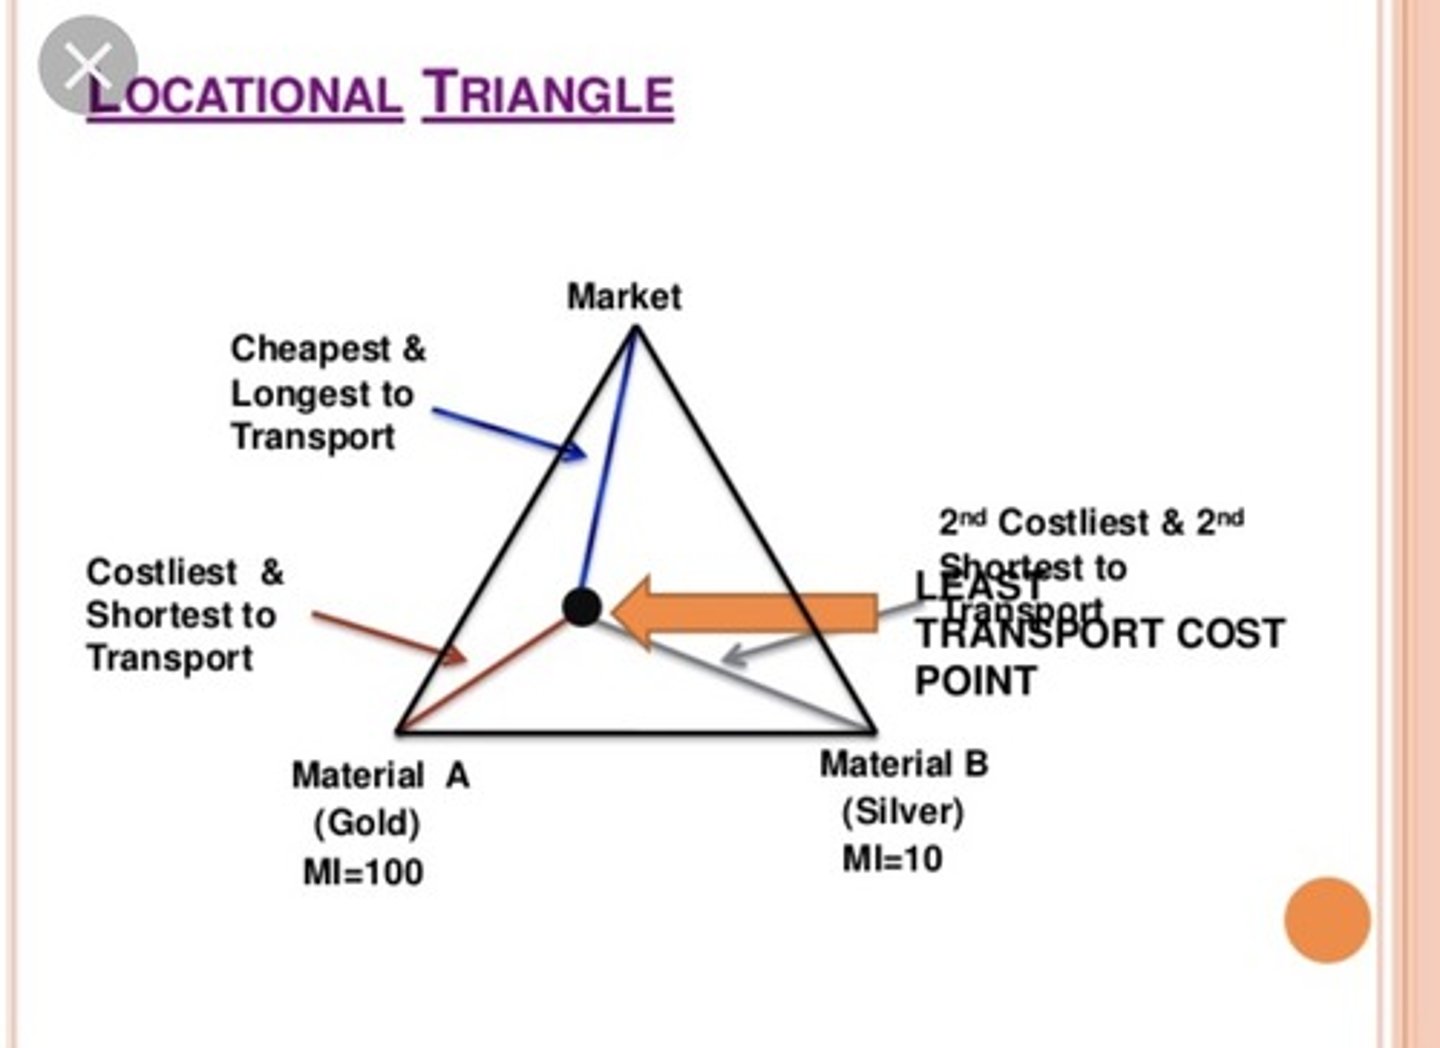
Weber's Least Cost Theory
predicts where industries will locate based on minimizing costs of transportation (most important), labor, and agglomeration
Weber's visual
Least Cost Triangle; points represent the market and raw material locations, and the factory is placed to minimize the total "ton-mile" distance
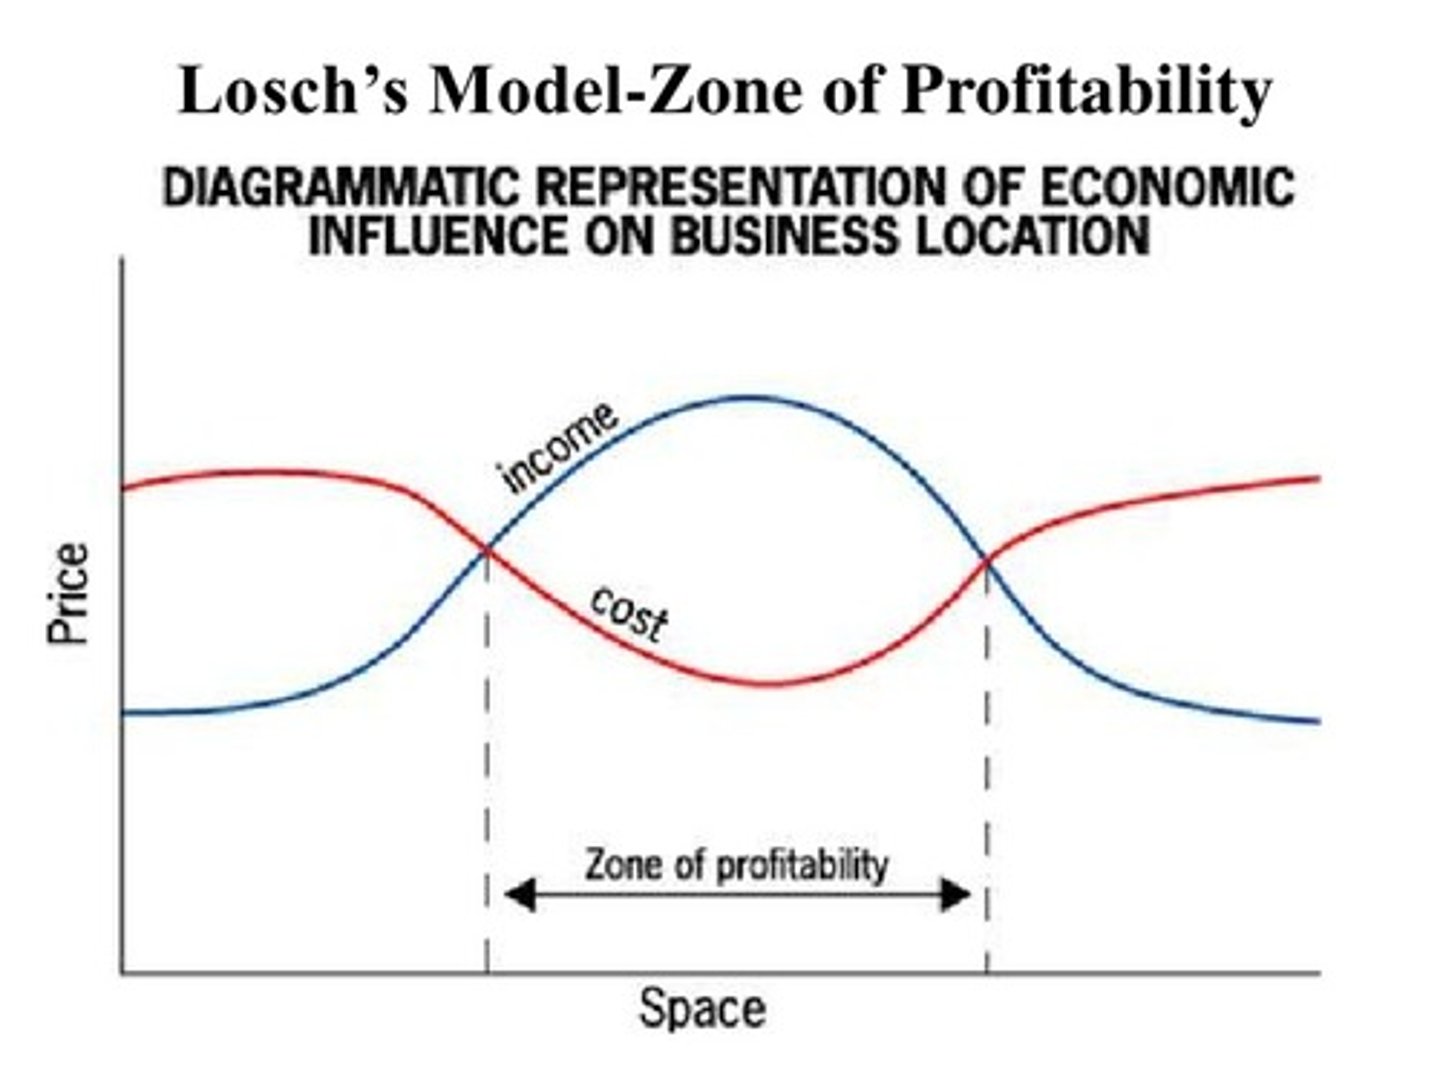
Profit Maximization (Losch)
focuses on locating a business where the net profit is greatest, considering consumer demand and spatial influence
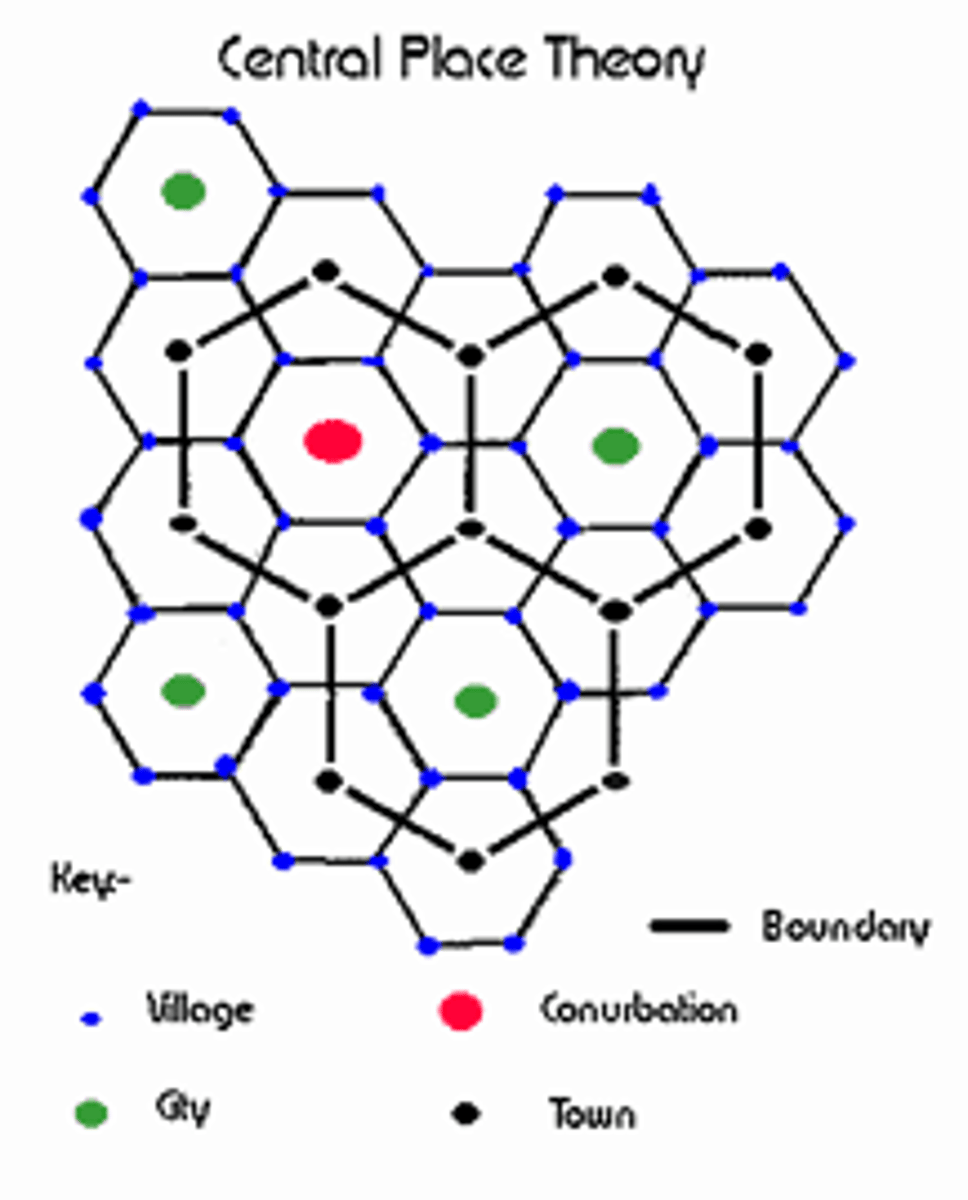
Central Place Theory (Christaller)
explains the distribution of services based on threshold (min. people needed) and range (max. distance people travel)
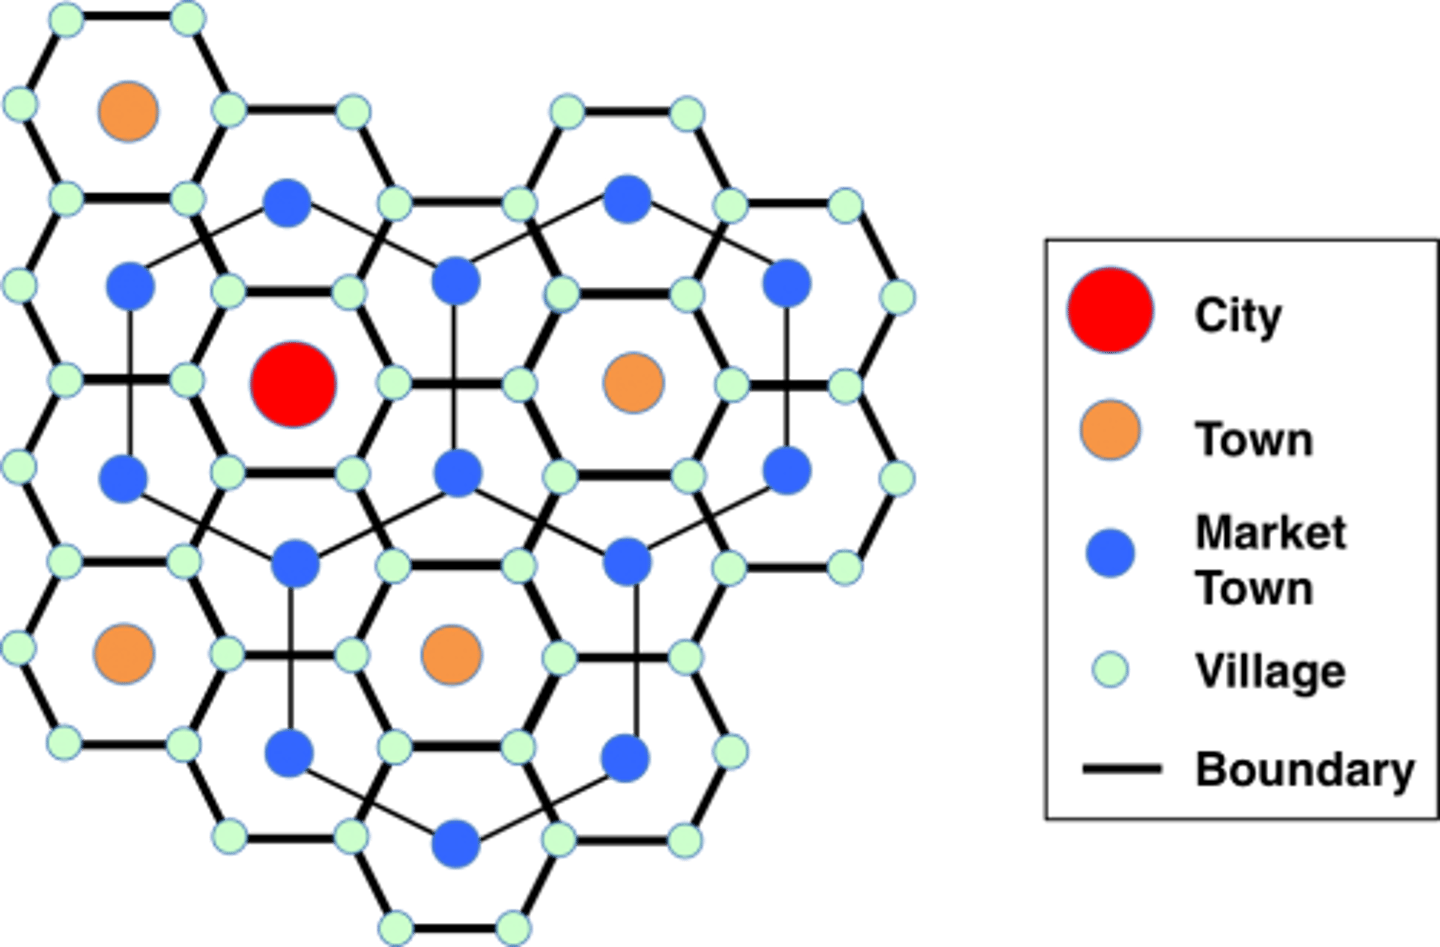
CPT visual
map of overlapping hexagons of different sizes; larger hexagons (cities) have more services, while smaller ones (hamlets) have fewer
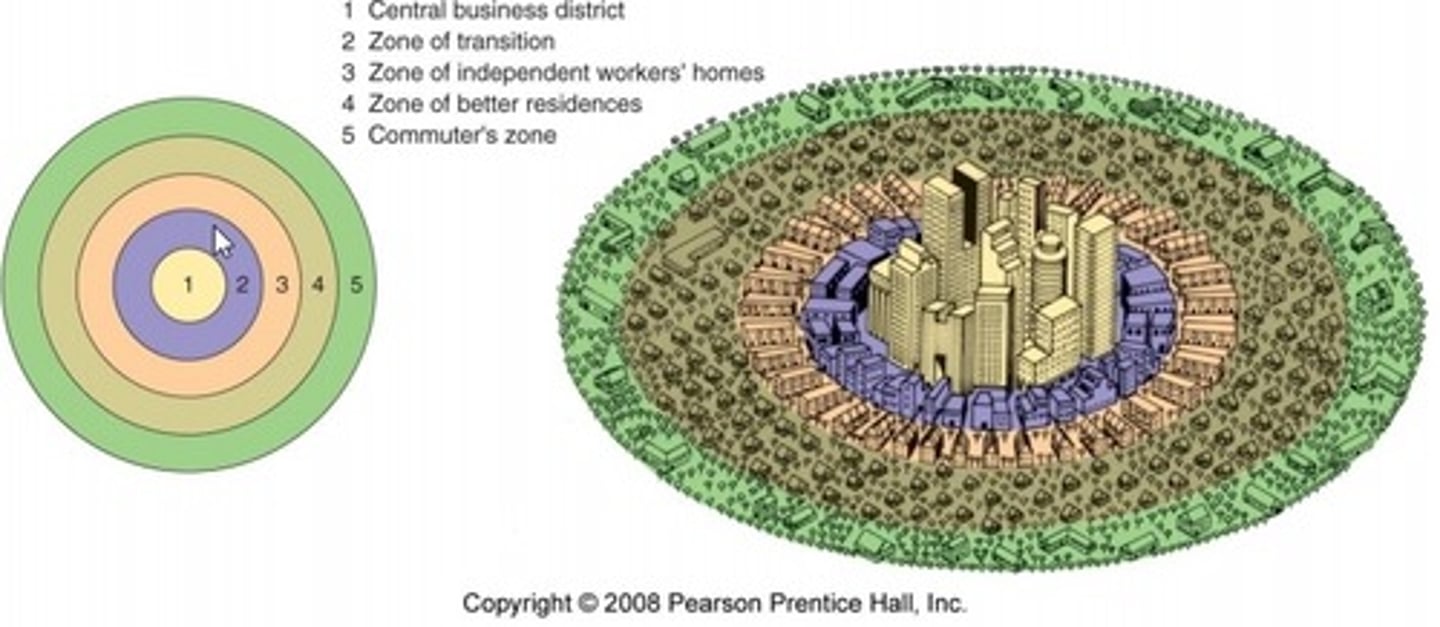
Concentric Zone Model (Burgess)
city grows outward from a central area in a series of five rings (CBD, Transition, Working Class, Better Residence, Commuter)
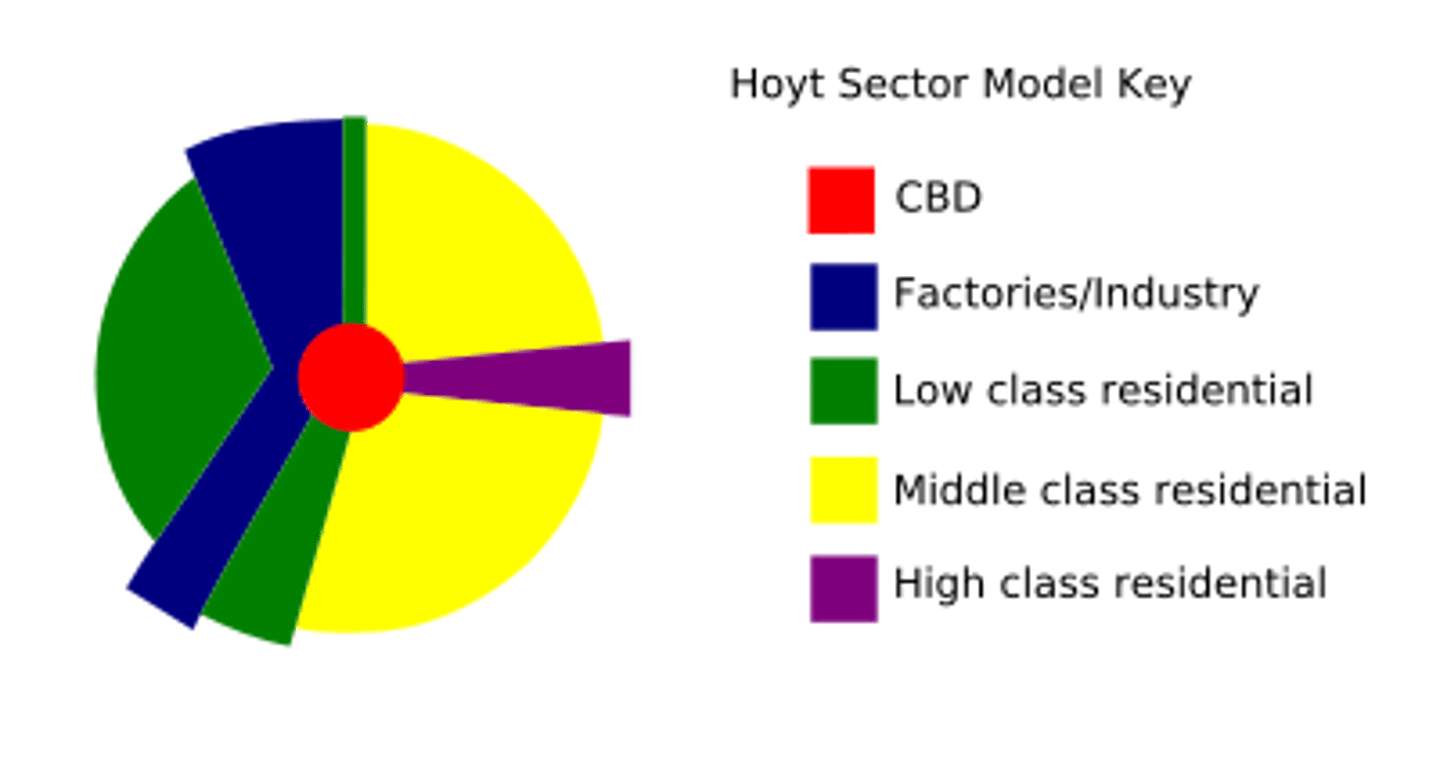
Sector Model (Hoyt)
city develops in sectors or wedges radiating out from the CBD, often following transportation corridors (rail/highways)
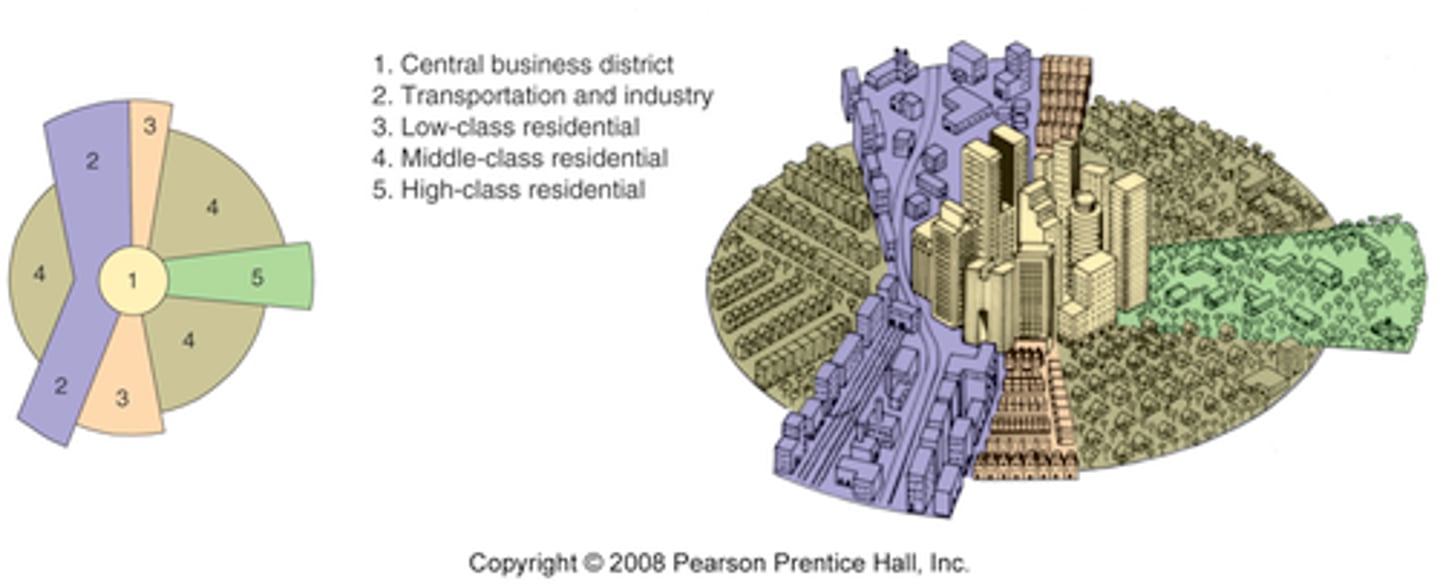
Sector Model visual
circle divided into pie-shaped wedges that follow transportation routes (like a pizza cut unevenly)
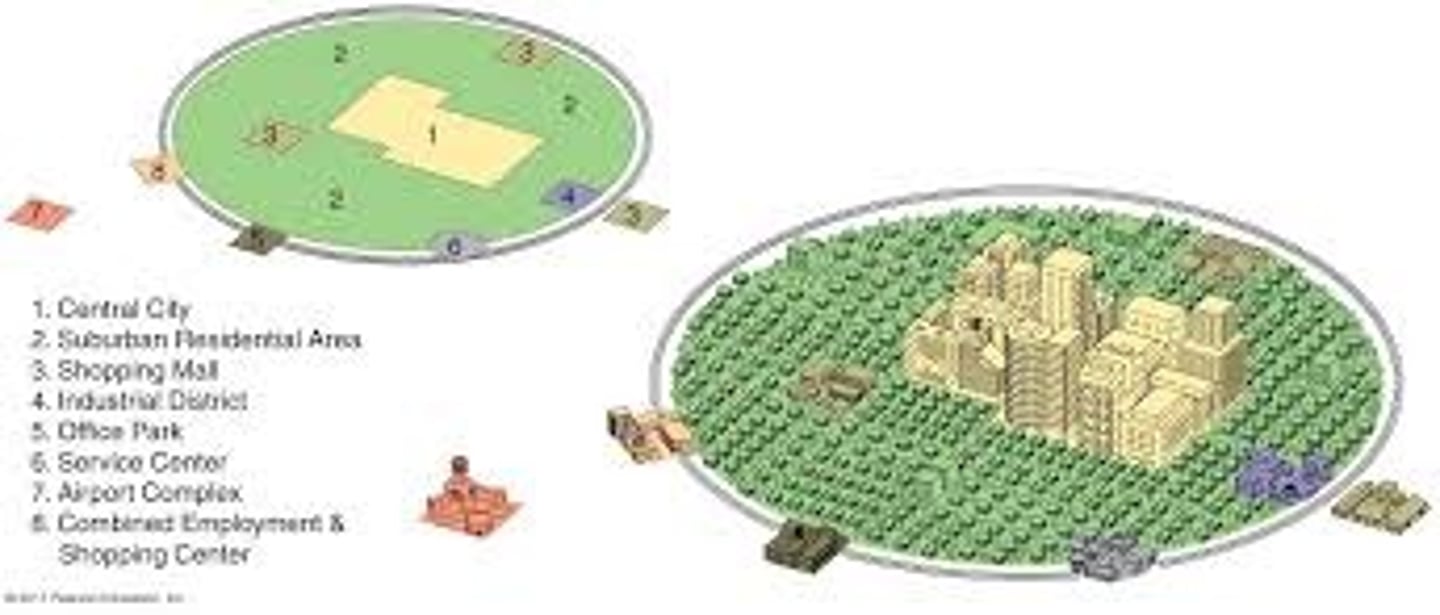
Peripheral Model (Galactic City)
urban area consisting of an inner city surrounded by large suburban residential and business areas tied together by a beltway/ring road

Peripheral Model visual
inner city and suburbs surrounded by a beltway (loop highway) with "edge cities" appearing along the road
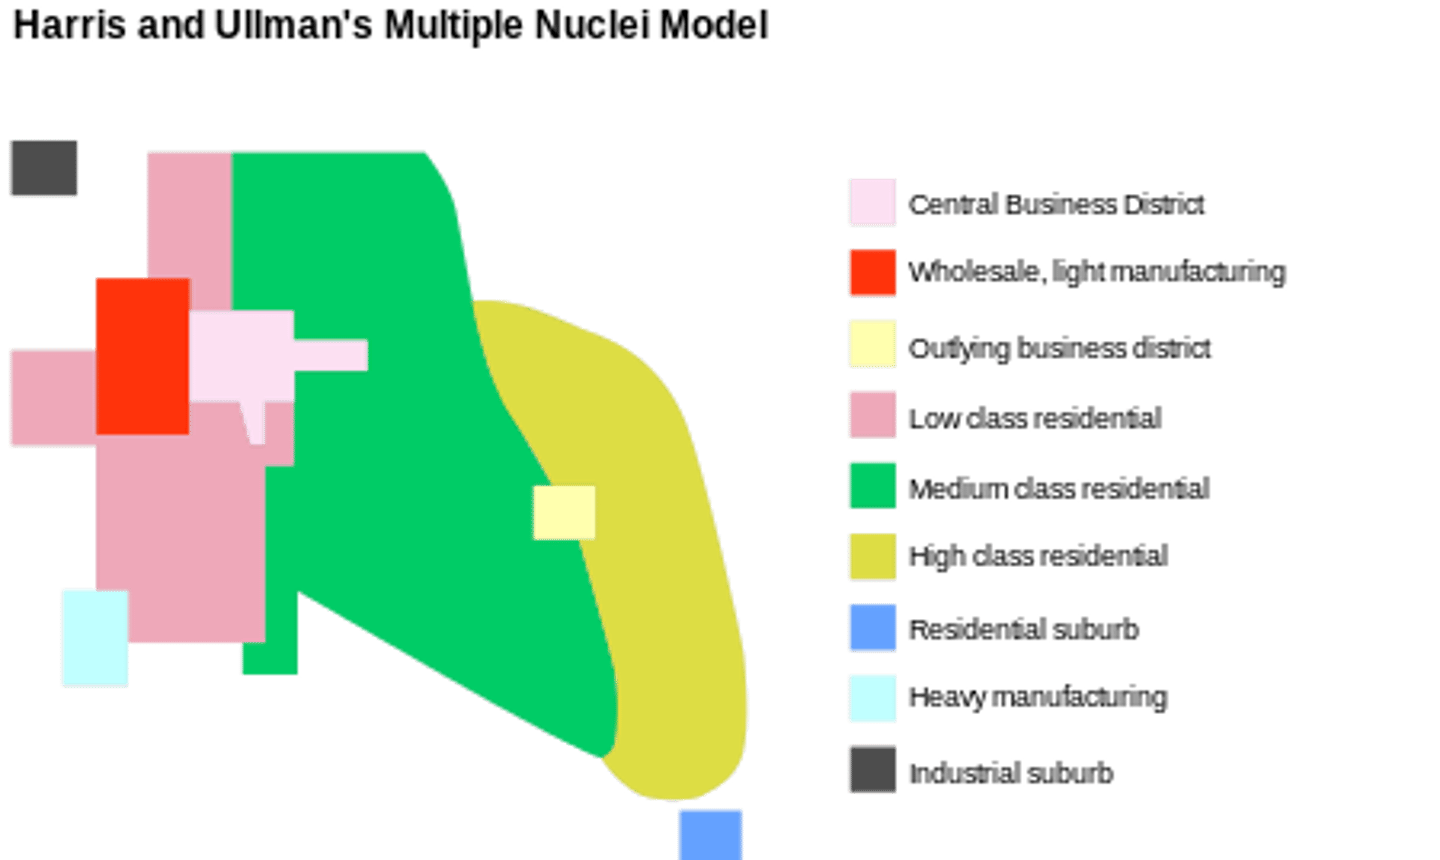
Multiple-Nuclei Model (Harris/Ullman)
city is a complex structure that includes more than one center around which activities revolve (e.g., ports, universities, airports)
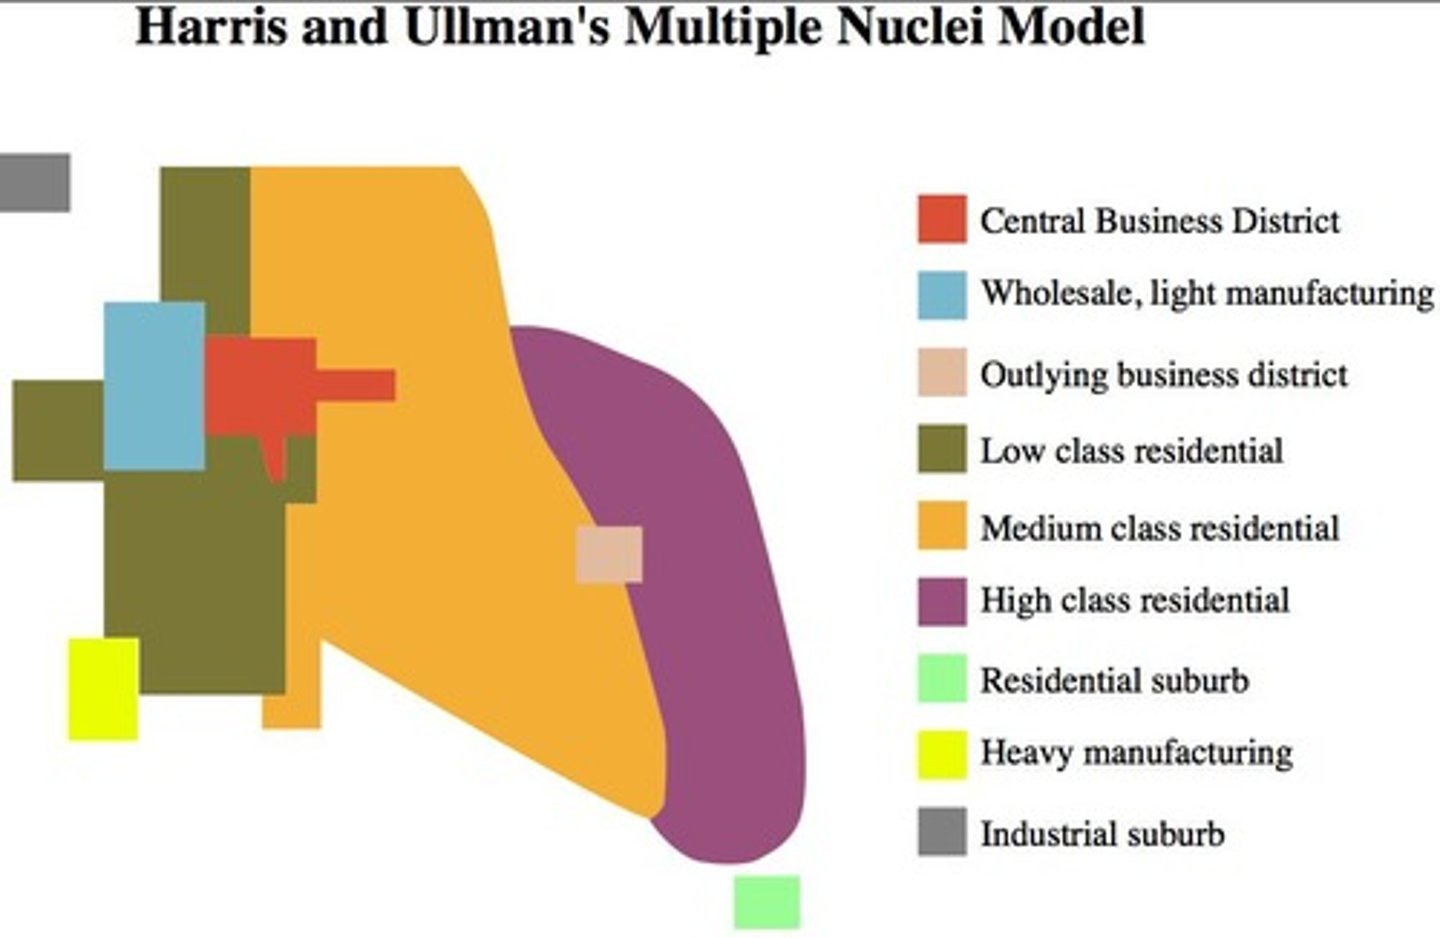
Multiple-Nuclei visual
"patchwork" or jigsaw puzzle layout where different nodes (like an airport or university) attract specific types of neighboring land use
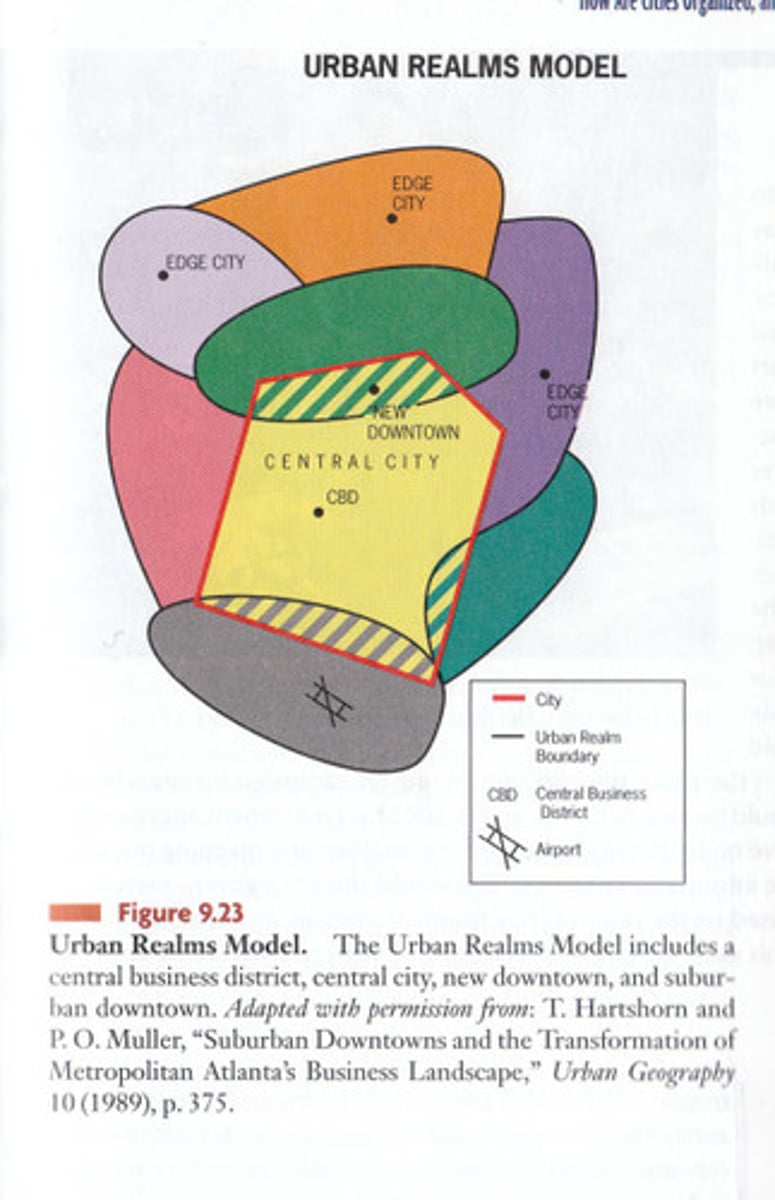
Urban Realms Model (Vance)
where an urban area consists of several independent "realms" (self-sufficient suburban centers) that are linked by a beltway; each realm has its own downtown/CBD, making the original central city less important.
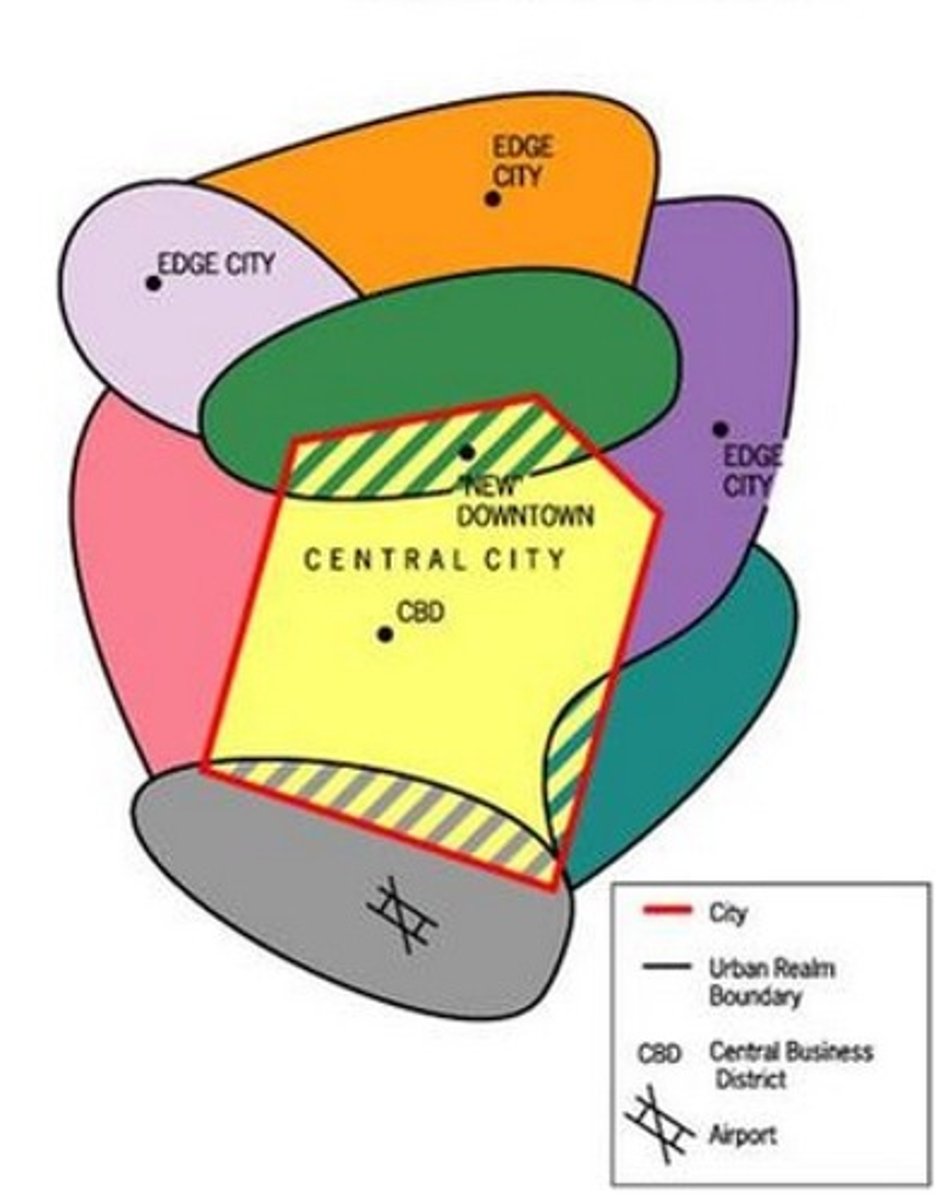
Urban Realms visual
multiple independent "realms" (sub-regions) that function as mini-cities, reflecting how large metropolitan areas become polycentric via highways
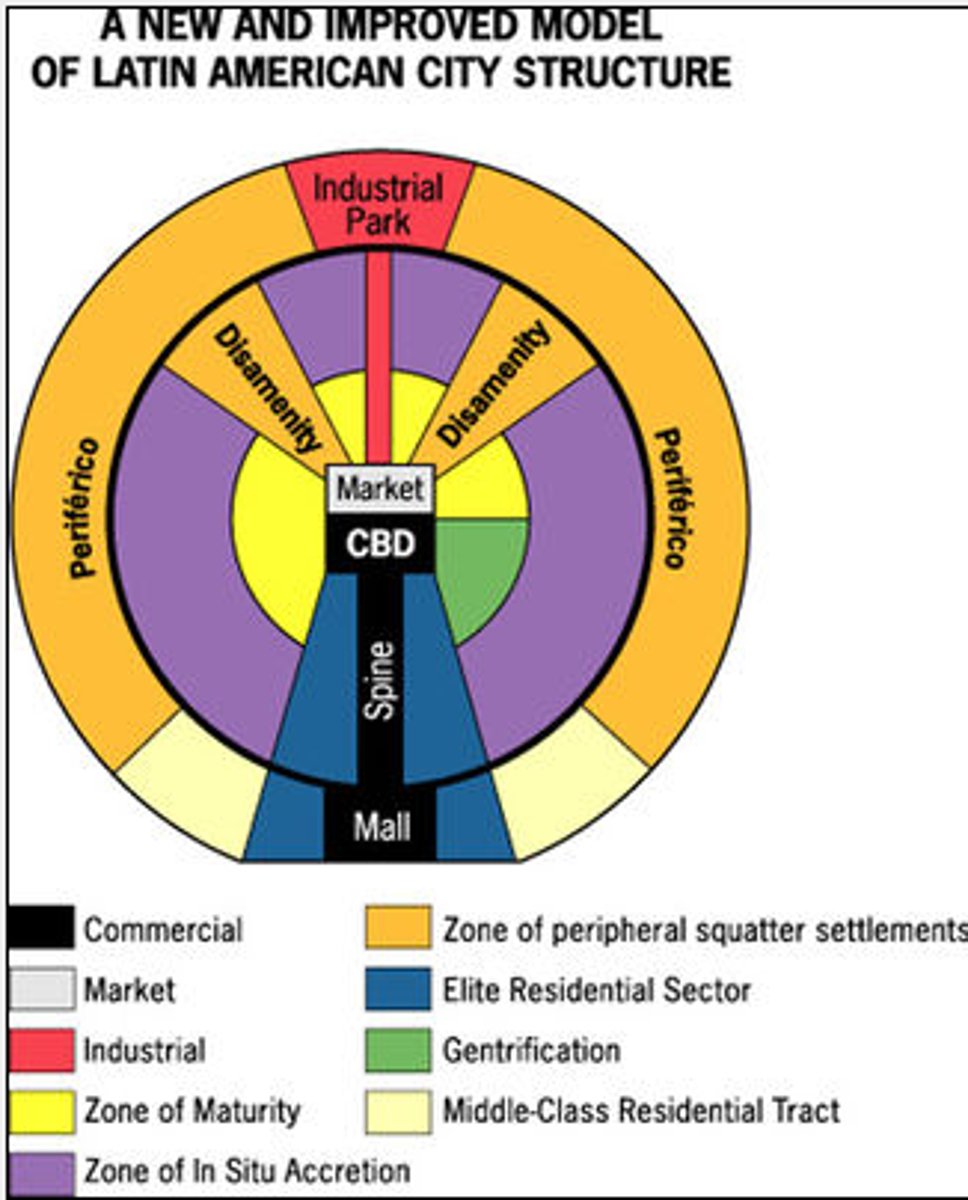
Latin American City Model
combines concentric rings and sectors; features a "spine" of high-end development and a "periferico" (slums) on the outskirts
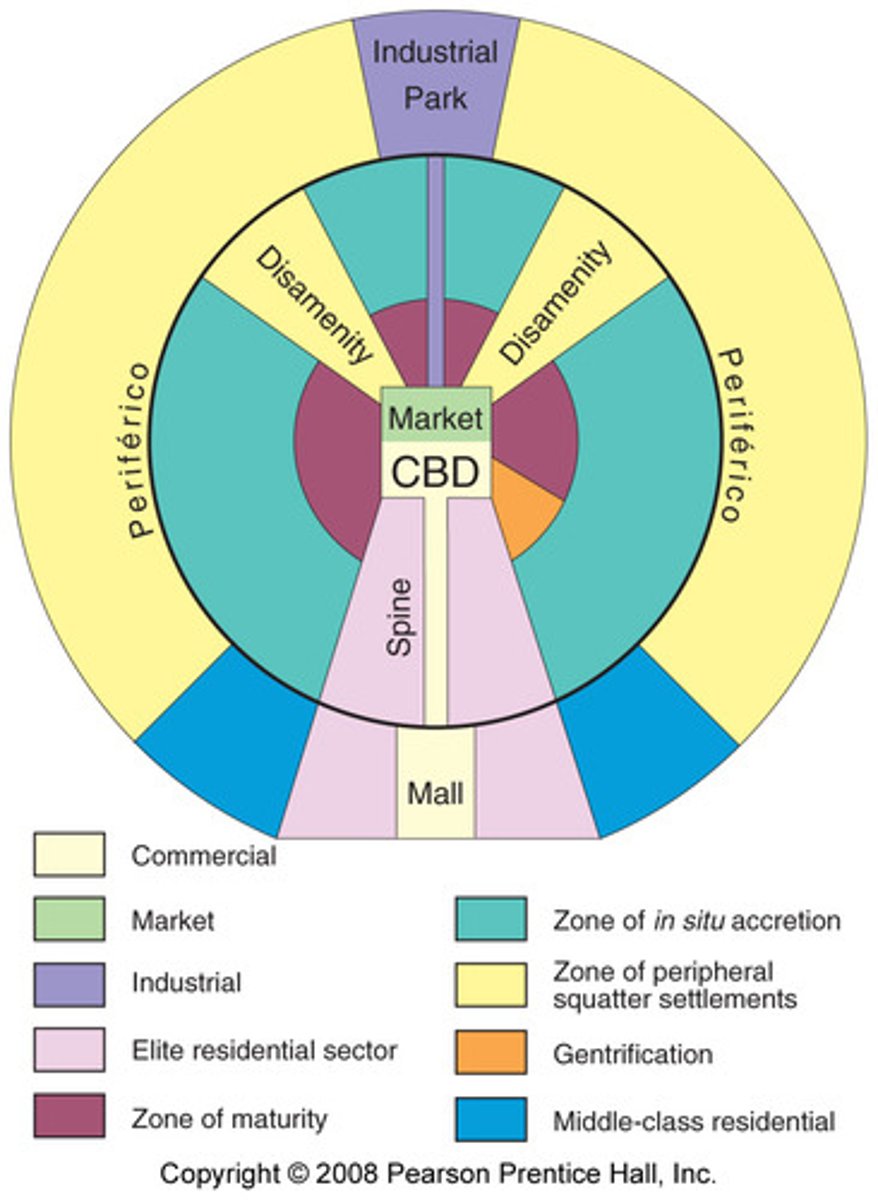
Latin American Cities visual
"kite" shape featuring a spine (elite residential/commercial) extending from the CBD to a mall, surrounded by a "periferico" of squatter settlements
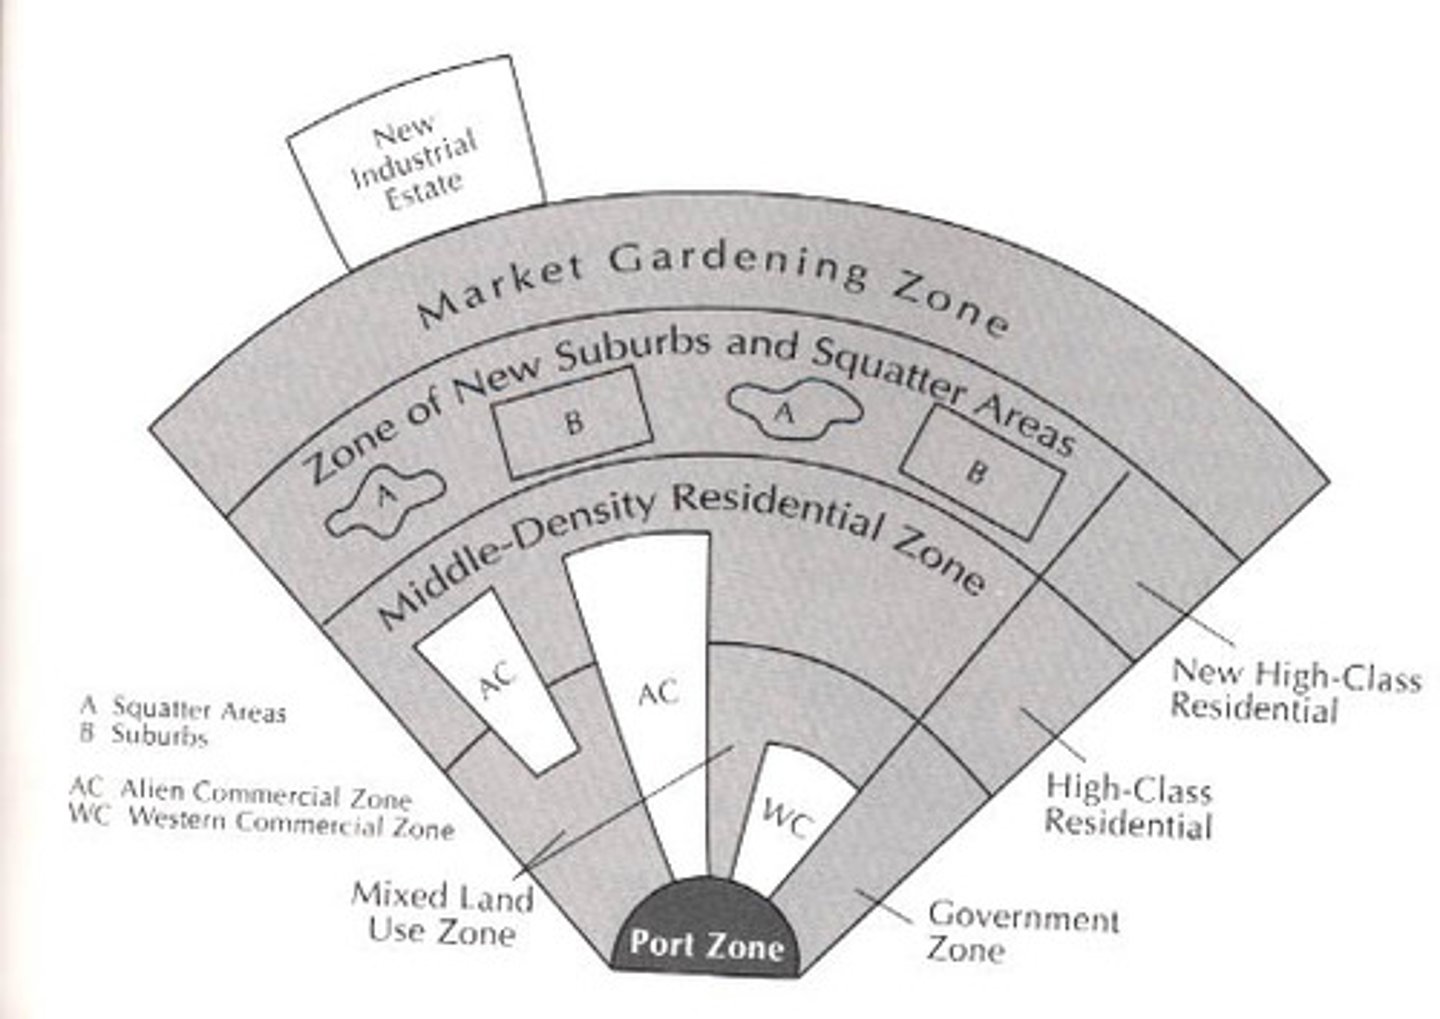
SE Asian City Model
features a colonial port zone as the focal point; no formal CBD, but several specialized zones
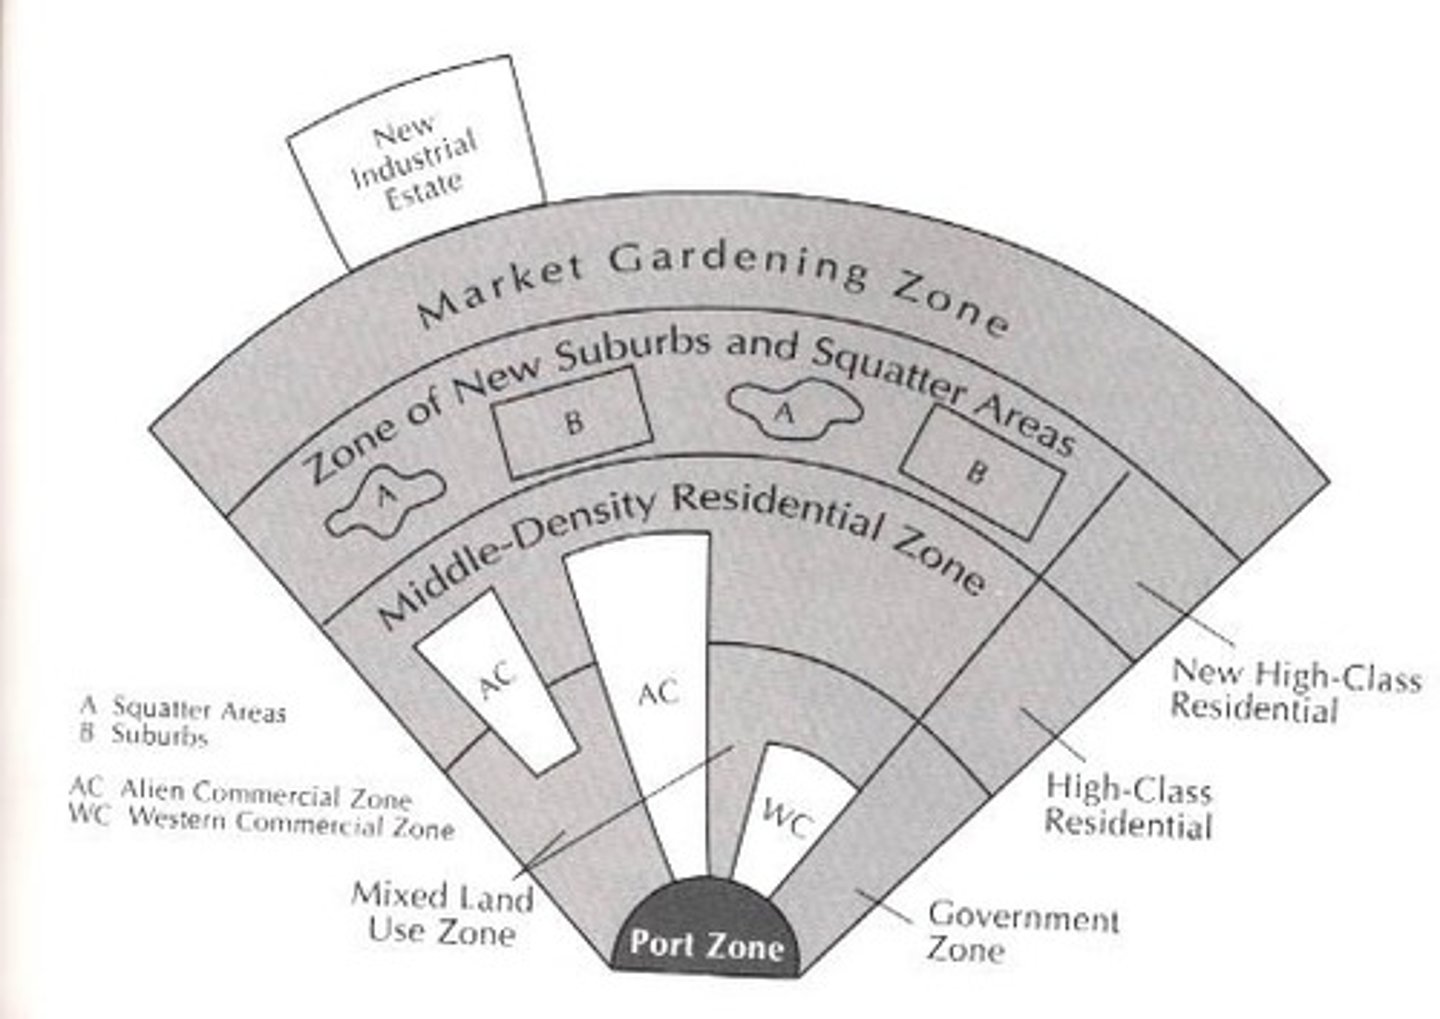
SE Asian Cities Visual
centered on a Port Zone instead of a traditional CBD; features an "alien commercial zone" (foreign merchants) and Western commercial zones
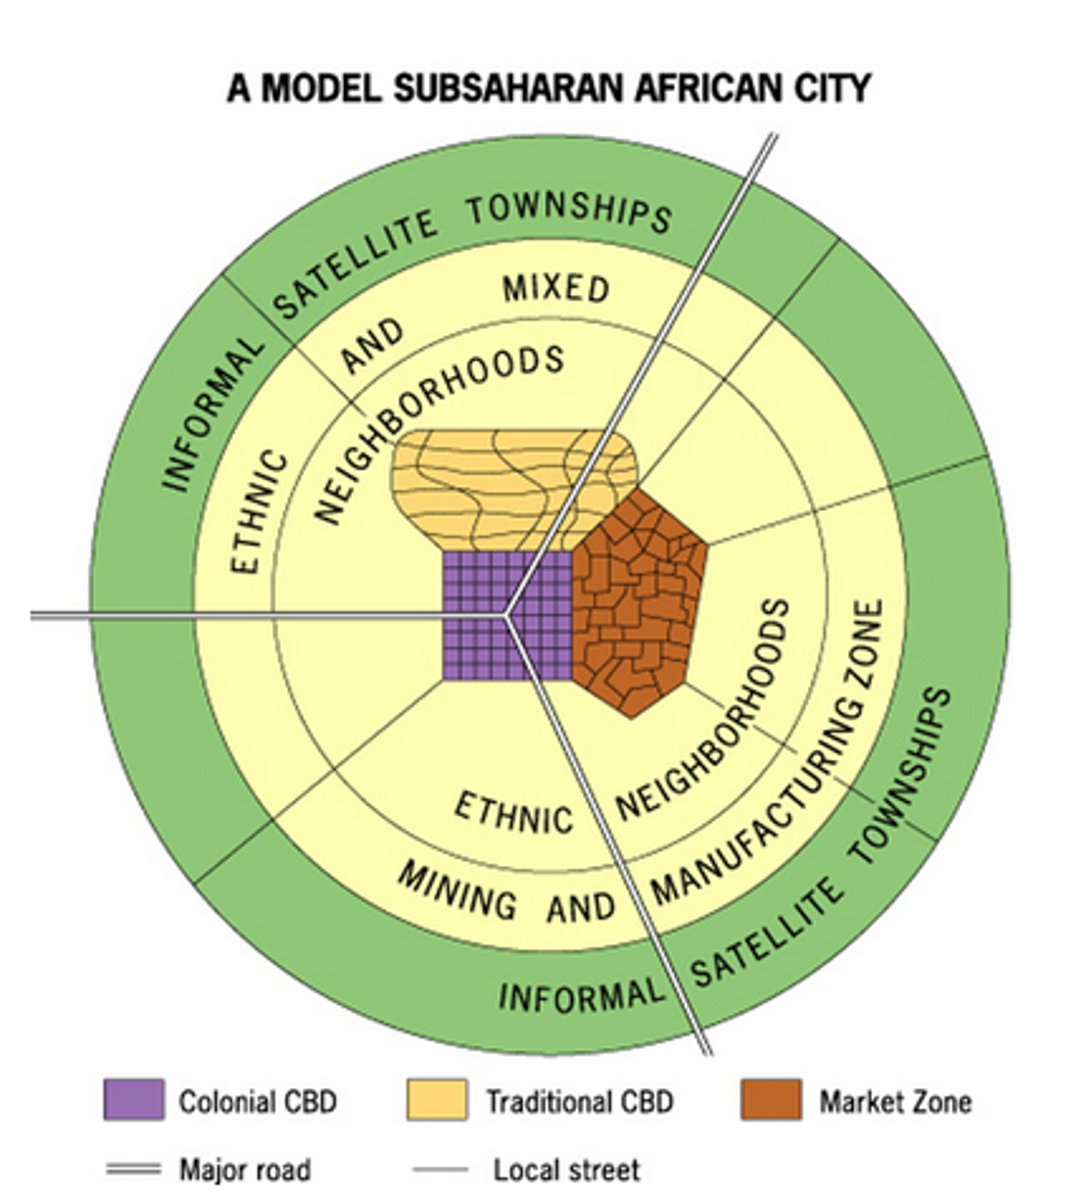
African City Model
often features three CBDs: Colonial, Traditional (market), and Periodic Market zones
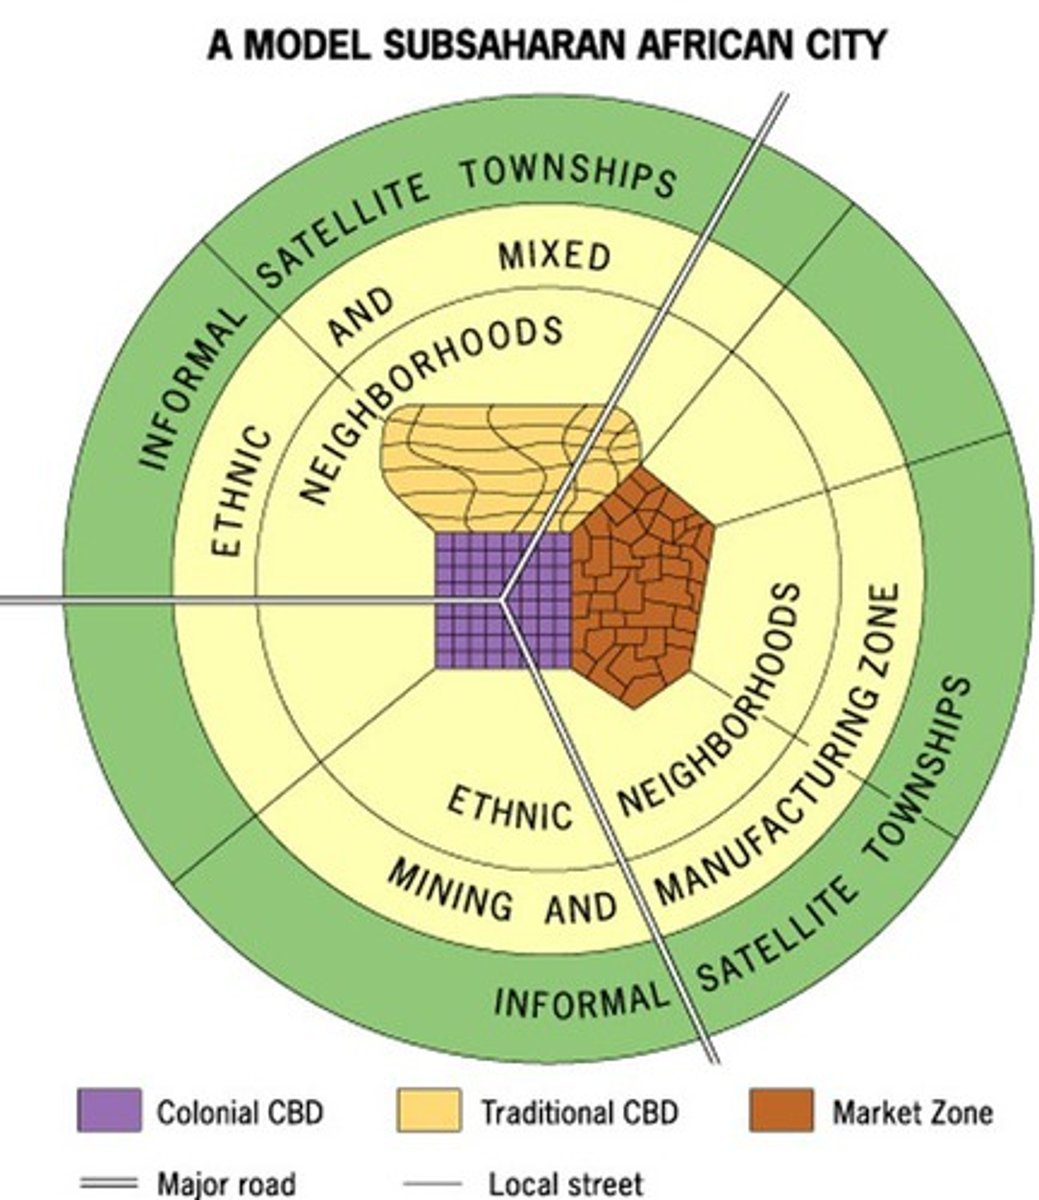
African City Model visual
recognizable by three distinct CBDs: a Colonial CBD (grid), a Traditional CBD (curayside market), and a Market Zone (stalls)
Borchert's Model of Urban Evolution
defines five epochs of American urbanization based on the dominant transportation technology of the time (e.g., Sail-Wagon, Steel Rail)