C19 - Modern Analytical Techniques II
1/15
There's no tags or description
Looks like no tags are added yet.
Name | Mastery | Learn | Test | Matching | Spaced | Call with Kai |
|---|
No analytics yet
Send a link to your students to track their progress
16 Terms
Paper chromatography key elements
Mobile phase: liquid or gas that carries the mixture through the system
Stationary phase: solid that does not move with the mobile phase
Separation process of paper chromatography
Mobile phase moves mixture components based on solubility
More soluble ones move faster
Stationary phase holds onto components differently through absorption
More absorptive ones move slower
Rf
The retardation factor is the ratio of distance travelled to distance travelled by component
0 to 1
Distance by spot/distance by solvent
HPLC key elements
Stationary phase consists of small particles of solid (e.g. silica bonded to hydrocarbons) tightly packed into a column
Mobile phase is polar mixture such as methanol and water
HPLC process
Mixture is injected into solvent stream
Carried through the column
Components are attracted to the solid by varying degrees
Results in different travel times through the column
As liquid exits the column, passes through a UV detector that measures UV light absorbance
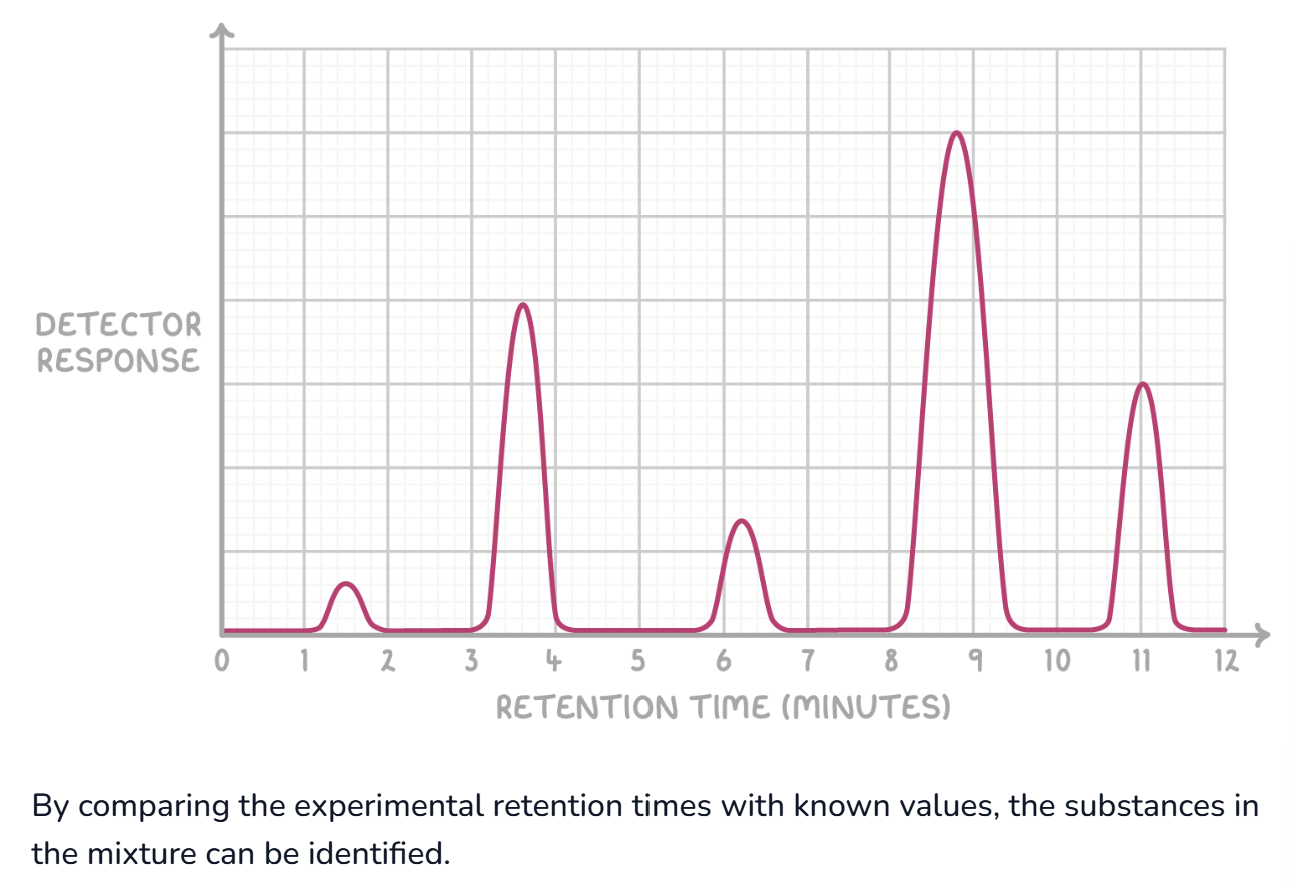
Chromatogram is produced
Shows retention time
Gas chromatography key elements
Mobile phase
Sample injected into a stream of gas
Stationary phase
A non-polar boiling liquid absorbed into solid support
Gas chromatography process
Liquid sample is vaporised
An inert carrier gas then transports the vaporised sample through a chromatographic column containing the stationary phase
Components of the mixture are attracted to the solid by varying degrees
Results in different travel times through the column
As they exit a detector records the separation
Like HPLC, components are identified by their retention times
Chromatography and mass spectrometry
Why
Mass spectrometry is used to identify substances with m/z ratio
Can give confusing results when analysing mixtures
GC and HPLC can separate the mixtures and the mass spectrometry can identify the components
How GC-MS
Sample is first separated using gas chromatography
Separated components are introduced into a mass spectrometer
Are ionised
A distinct mass spectrum for each component is generated
Each substance is then identified by comparing mass spectrum to reference spectra
Combined techniques
Combustion analysis
Can determine the empirical and molecular formula of organic compounds
Sequence of techniques for structure determination
Mass spectrometry - molecular mass found
IR spectrometry - finds functional groups
NMR - chemical environments
NMR
Determines molecular structure
Analyses the changes in magnetic properties of atomic nuclei
Powerful analytical technique that is used to understand the structure of molecules
Two types
13C provides information about where carbons are
1H is where the hydrogen atoms are
How NMR works
When a molecule is placed in an external magnetic field
Nuclei within molecule experiences varying degrees of shielding from external magnetic field
Due to local chemical environment
Electron density surrounding each nucleus acts as a magnetic shield
Protects it from the full strength of the external magnetic field
Nuclei in different environments experiencing slightly different resonance frequencies
More shielded a nucleus is, the lower its resonance frequency will be
Requires less energy to flip its spin state
Chemical shift
In NMR, chemical shift is a measure of the difference in resonant frequency
TMS is used as the standard in NMR spectrometry
Has a single absorption peak (all carbons and hydrogens in same chemical environments)
Appears at a lower frequency which is to the right of more analytes
TMS is assigned chemical shift value of 0 ppm
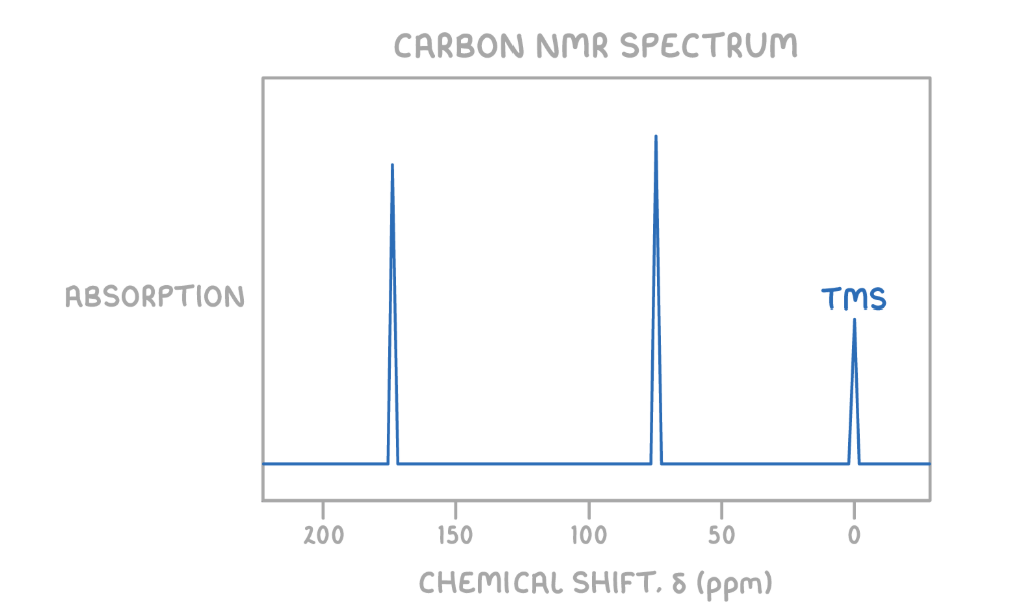
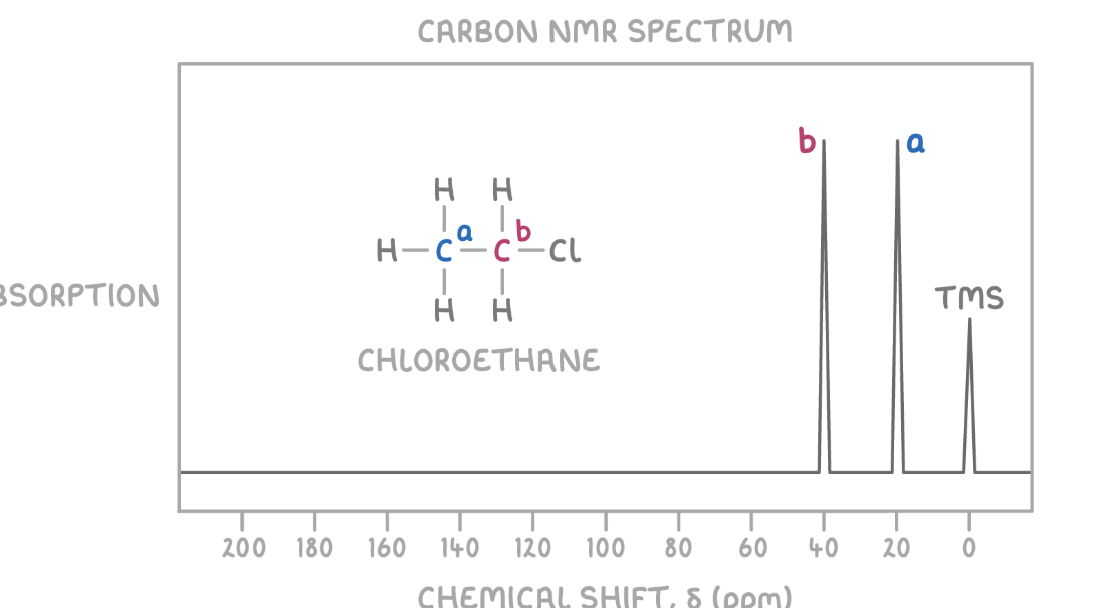
Number of peaks
Shows distinct carbon environment
Differing bonding of chlorine and hydrogen atoms to each carbon changes the electron density
Determining molecular structure
Count number of distinct peaks to understand the variety of carbon environments
Use chemical shift data to hypothesis the types of carbon present
Combine all available evidence to propose molecular structure
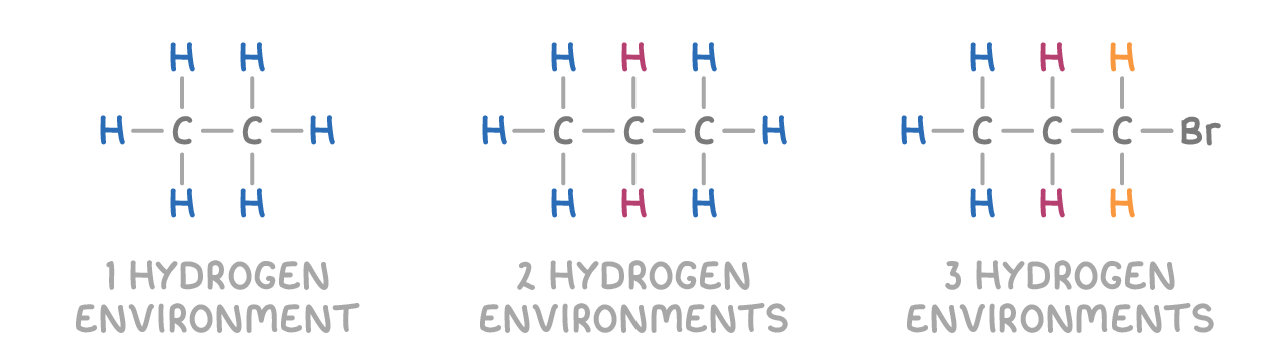
Proton NMR graph
Graph
Each peak represents a hydrogen environment
Peak area is proportional to number of hydrogens
Position of peak on scale can help identify the type of hydrogen atom
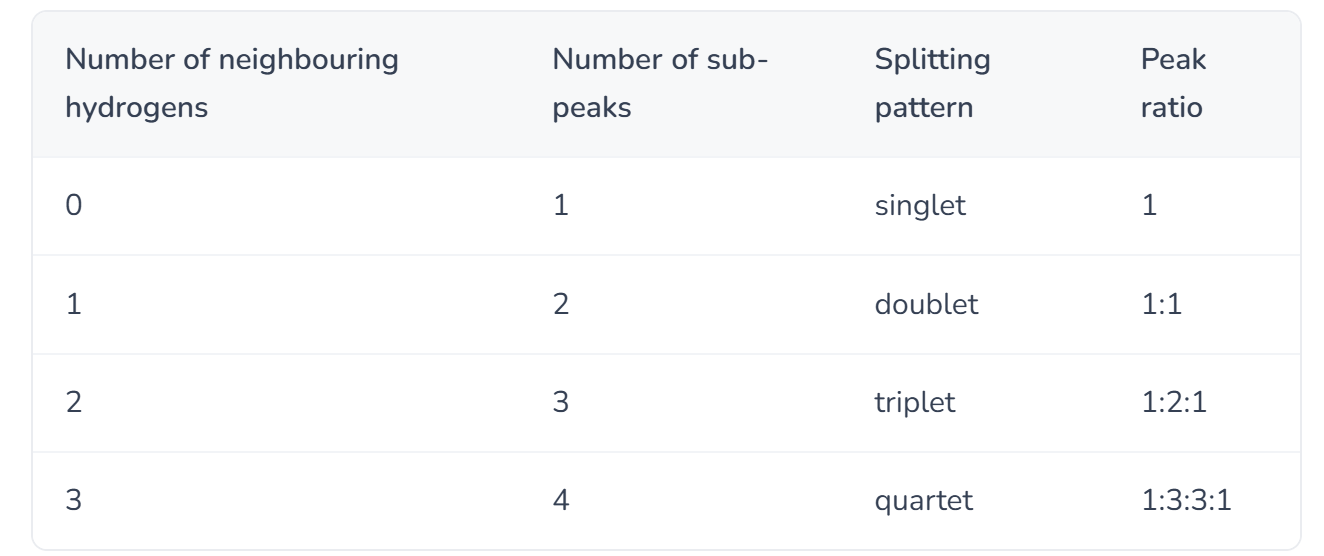
Spin-spin coupling
Occurs among adjacent hydrogen atoms and results in the splitting of NMR peaks
Occurs only between hydrogens in neighbouring carbons
Reveal the number of non-equivalent protons on adjacent carbon atoms