10. EIA and uncertainty propagation
1/35
There's no tags or description
Looks like no tags are added yet.
Name | Mastery | Learn | Test | Matching | Spaced | Call with Kai |
|---|
No analytics yet
Send a link to your students to track their progress
36 Terms
What is a environmental impact assessment (EIA)
a procedure which serves to provide information to local authority planners, other regulators and authorising bodies, other interested parties and the general public about certain proposed developments and their likely effects on the environment
What is the aim of EIA
To protect the environment by ensuring that a local planning authority grants planning permission for projects “in the full knowledge of the likely significant effects, and takes this into account in the decision making process”
What is the outline of the EIA process
Screening: Determining whether a project requires an EIA
Scoping: Identifying the various issues that should be covered
Baseline studies
Impact significance assessment
Mitigation
Submission of environmental statement
Decision making
What is project screening
Screening is a procedure used to determine whether a project requires an EIA
What are the 2 types Schedules of projects
Schedule 1 projects always require an EIA
Schedule 2 projects require EIA if they exceed certain thresholds and/or are situated in a sensitive area
What are examples of Schedule 1 projects
Crude oil refineries, power stations and other metal works
What are examples of Schedule 2 projects
fish farming, food industry and shopping centres
What are sensitive areas in the UK
Special scientific interest, national parks and WHO sites
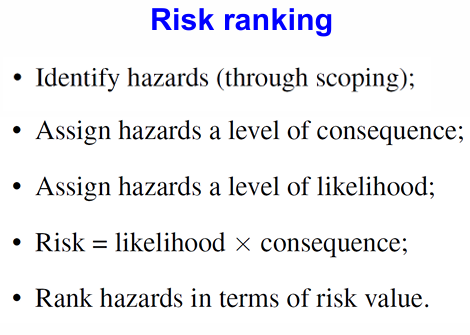
How do you rank risks
Risk = likelihood x consequence
Deterministic model
Do not account for random processes and provide single, supposedly exact, answers
Stochastic models
Account for random processes and provide results in the form of probability distributions
What undermines both the deterministic and stochastic models
model structure uncertainty and parameter uncertainty
What is the three processes of development of mathematical models
The conceptual model
Governing equations
Analytical or numerical solutions
Model structure uncertainty
uncertainty about the acceptability of this deviation (a deviation from the process we are trying to represent)
Model calibration
Finding a set of parameter values that a given mathematical model simulates a set of previously observed measurements to the best of its ability
Measurement error
There will be error in the measurements used to inform the parameter calibration
Model structure error
Parameter values based on previous experience often compensate for model structure errors incurred due to model structure uncertainty
Equifinality
Often it is not possible to constrain all of the unknown parameters using a given set of measurements. This gives rise to equifinality, whereby multiple combinations of parameter values yield identical model responses within a restricted window of behaviour
Extrapolation error
The scenario of interest often represents an extrapolation from a previous domain of experience
how do we end up with our probability distribution of model results
If we account for the randomness associated with model structure and parameter uncertainty within our deterministic model predictions
Uncertainty propagation
The process of propagating knowledge about model structure uncertainty and parameter uncertainty through to model outputs such that model results are stochastic and specified as probability distributions
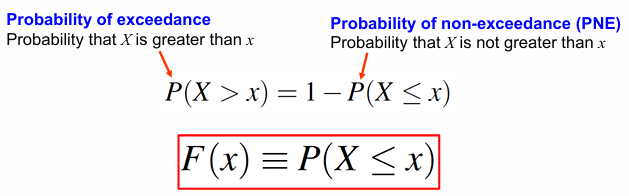
What is the equation for cumulative distribution function (CDF)
F(x)=[f(x)dx]x -inf
![<p>F(x)=[f(x)dx]x -inf</p>](https://assets.knowt.com/user-attachments/0e27ed06-a9d4-48d1-96fc-7c9c8b8a74e6.png)
What is the equation for the probability of exceedance
P(X>x)=1-P(X<x)
What is a PDF
PDF is a continuous form of a histogram where the bin widths are infinitesimally small
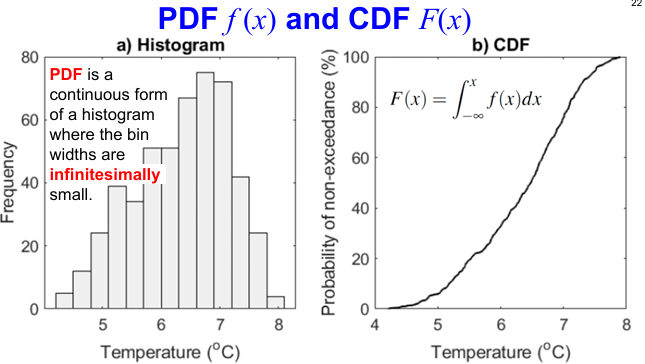
How can a continuous CDF be found from
F(X) = [f(x)dc] x -inf
What is an important property of the PDF
[f(x)dc]inf -inf =1
How to work out empirical CDF
Consider N number of measurements, xj
Let xi(i=1,2,…,N) be the same set but ranked large to small
i is the rank number and N is the number of samples
What are the two popular heuristic equations in empirical CDF
Gringorten plotting position and Weibull plotting position
Gringorten plotting position
P(X>xi)=i-0.44/N+0.12 (P=probability of non-exceedance, is is the rank number, N is the number of samples)
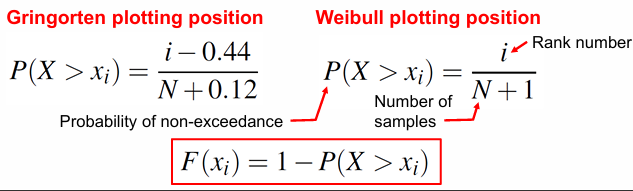
Weibull plotting position
P(X>xi)=i/N+1 (rank number/number of samples +1)

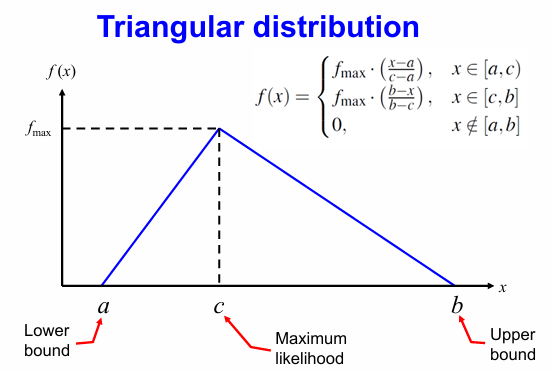
What does a triangular distribution look like
like a triangle
How to use Monte Carlo simulation (used for propagating parameter uncertainty though to model outputs)
Specify parameter distributions
Sample a specified number of different parameter sets
Run deterministic model for each parameter set
Collect all the model results to form a cumulative distribution function
What is a tornado plots
Shows bar charts of rank correlation for each parameter with the highest correlating parameters displayed first
What are the steps to create a tornado plot
involves determining the rank number of the model outputs and each parameter
the next step is to determine the rank correlation between parameter ranks and output ranks for each parameter
determine the P value
finally rank all the rank correlations and order the model parameters accordingly in a bar chart
What happens if P>0.05
If P>0.05 a correlation is considered to be not significant, so we set those correlation coefficients to zero
What is a common method of abstracting data from a CDF is to determine…
P10, P50 and P90, which correspond to probabilities of non-exceedance of 10%, 50% and 90%. These can be obtained using the following additional code:
yiSTATS=interpl(PNE,yi,[10 50 90]);
![<p>P10, P50 and P90, which correspond to probabilities of non-exceedance of 10%, 50% and 90%. These can be obtained using the following additional code:</p><p>yiSTATS=interpl(PNE,yi,[10 50 90]);</p>](https://assets.knowt.com/user-attachments/54a1b0c1-3371-4582-b95f-0801d25763e6.png)