Evolutionary Biology Exam 1 Version B
1/43
There's no tags or description
Looks like no tags are added yet.
Name | Mastery | Learn | Test | Matching | Spaced | Call with Kai |
|---|
No analytics yet
Send a link to your students to track their progress
44 Terms
Approximately how long ago did Lystrosaurus dominate the planet?
251 MYA
What is one way that fossils support evolutionary theory of life?
Some fossils demonstrate transitional forms between groups of taxa that existed prior to them and those that appear afterwards in the fossil record. This illustrates change through time. Archaeopteryx was used to illustrate this, as it has feathers like birds, but most of the rest of its anatomy resembles ancestral (and still surviving) reptiles
What is one way that fossils support evolutionary theory of life?
There is a spatial correlation between fossil taxa and modern ones that resemble them, indicating their connection due to historical processes. A prime example of this is how recent marsupial fossils are found in Australia and South America where modern marsupials live. This is in contrast to parts of the world without modern marsupials, where all recent mammalian fossils are those of placental mammals
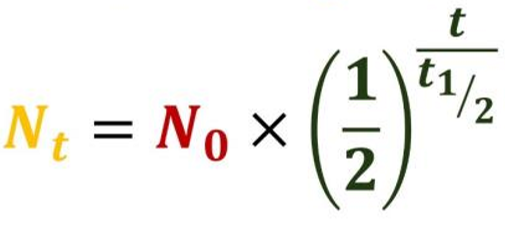
If the ratio of Uranium-235 atoms to Lead-207 atoms in zircon crystals is 1:15, how old is the crystal?
The half life of Uranium to Lead is 710 million years
Nt = daughter product
N0= parent material
t1/2= half life
t= age of the crystal
2840 million years old
If we were to assume that all the uranium in a crystal is uranium-235 and that all the lead in the crystal is lead-207, but there is also uranium-238 in the original sample, would the estimated age we obtain from comparing the overall uranium to lead ratios be too ancient or too recent? Explain.
The uranium-238 decays more slowly than the uranium-235, so, for a given time frame, we would see more uranium remaining than expected from using just the decay of uranium-235. This extra uranium would make us think the zircon crystal is MORE RECENT than it actually is
Imagine that you have a loan with an initial balance of $1,000 and you make no payments for a given amout of time. You will calculate the new balance after this period of time.
If the loan carries an annual interest rate of 10% and you wait 5 years, what is the new balance?
$1,611
Imagine that you have a loan with an initial balance of $1,000 and you make no payments for a given amout of time. You will calculate the new balance after this period of time.
If the loan carries an annual interest rate of 5% and you wait 10 years, what is the new balance?
$1,629

Consider the data set to the right showing the mass at 6 weeks measurements for a set of 20 mice. You may assume that this trait is known from previous experiments to have a narrow sense heritability of h2=0.7. Imagine that we divided these mice into two equal groups based on their size (i.e., one group is the biggest half, the other are the smallest mice) and then randomly mated them within each group.
Based on this data, what would you expect the mean mass at 6 weeks to be for the offspring arising from the smallest group?
19.9

Consider the data set to the right showing the mass at 6 weeks measurements for a set of 20 mice. You may assume that this trait is known from previous experiments to have a narrow sense heritability of h2=0.7. Imagine that we divided these mice into two equal groups based on their size (i.e., one group is the biggest half, the other are the smallest mice) and then randomly mated them within each group.
Based on this data, what would you expect the mean mass at 6 weeks to be for the offspring arising from the largest group?
24.1
Who invented the concept of sclara naturea
Aristotle
The three eras within the Phanerozoic eon are the Paleozoic, Mesozoic, and the ___
Cenozoic
What is the mammalian group that gives live birth to extremely underdeveloped young and keeps them in pouches for maturation
Marsupialia
Who used sophisticated mathematical tools to model the probability of fixation of novel alleles and the time that requires
Kimura
What is the most ancient period in the Mesozoic
Triassic
What is the phylum described as “segmented worms” which includes leeches
Annelida
What is the dinosaur group including T. rex and modern birds
Theropoda
Who explained apparent geologic change via a model of catastrophism
Cuvier
What is the most recent period in the Paleozoic
Permian
What is the eon before life began
Hadean
Fisher, Wright, and ____ are credited with the modern synthesis of evolution and population genetics
Haldane
Name the two epochs within the quaternary period
Pleistocene and Holocene
What is the mammalian order that aardvarks belong to
Tubulidentata
What phylum includes mushrooms and yeast
Fungi
Birds first evolved during what period
Jurassic
What mammalian order do dogs belong to
Carnivora
Who co-discovered the theory of evolution by natural selection
Wallace
Who published the laws of planetary motion
Kepler
What order encompasses frogs and toads
Anura
What mammalian order do whales belong to
Cetacea
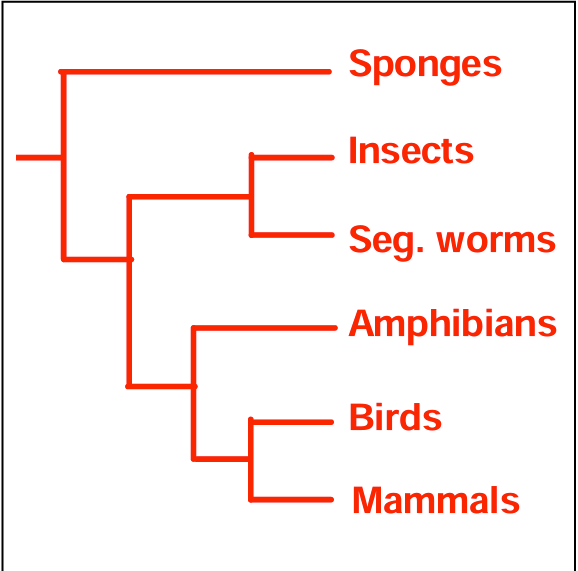
Provide the phylogenies for the following:
Amphibians
Birds
Insects
Mammals
Segmented worms
Sponges
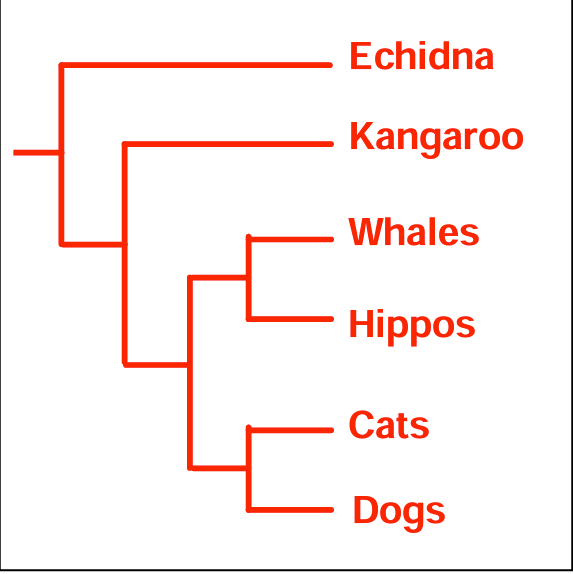
Provide the phylogenies for the following:
Cats
Dogs
Echidna
Hippos
Kangaroos
Whales
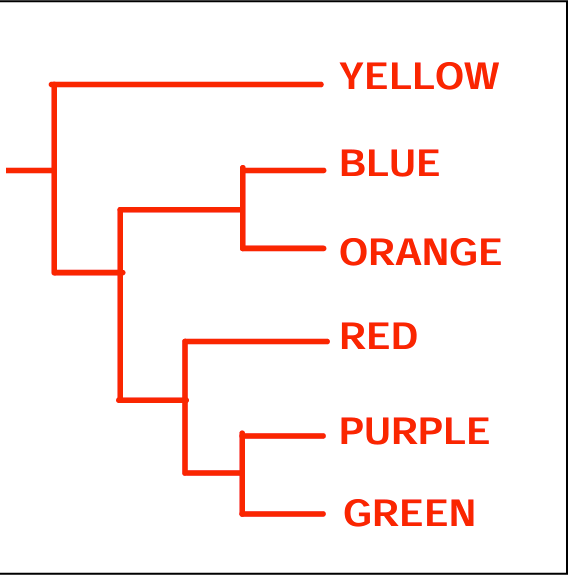
Draw a phylogeny that is described by the following:
The group consisting of RED, PURPLE, and GREEN is monophyletic
Taxa BLUE and ORANGE are sister taxa
Taxon RED is basal to taxa PURPLE and GREEN
Taxon YELLOW is the outgroup to all the others
Draw a phylogeny that is described by the following:
The group consisting of RED, PURPLE, and GREEN is monophyletic
Taxa BLUE and ORANGE are sister taxa
Taxon RED is basal to taxa PURPLE and GREEN
Taxon YELLOW is the outgroup to all the others

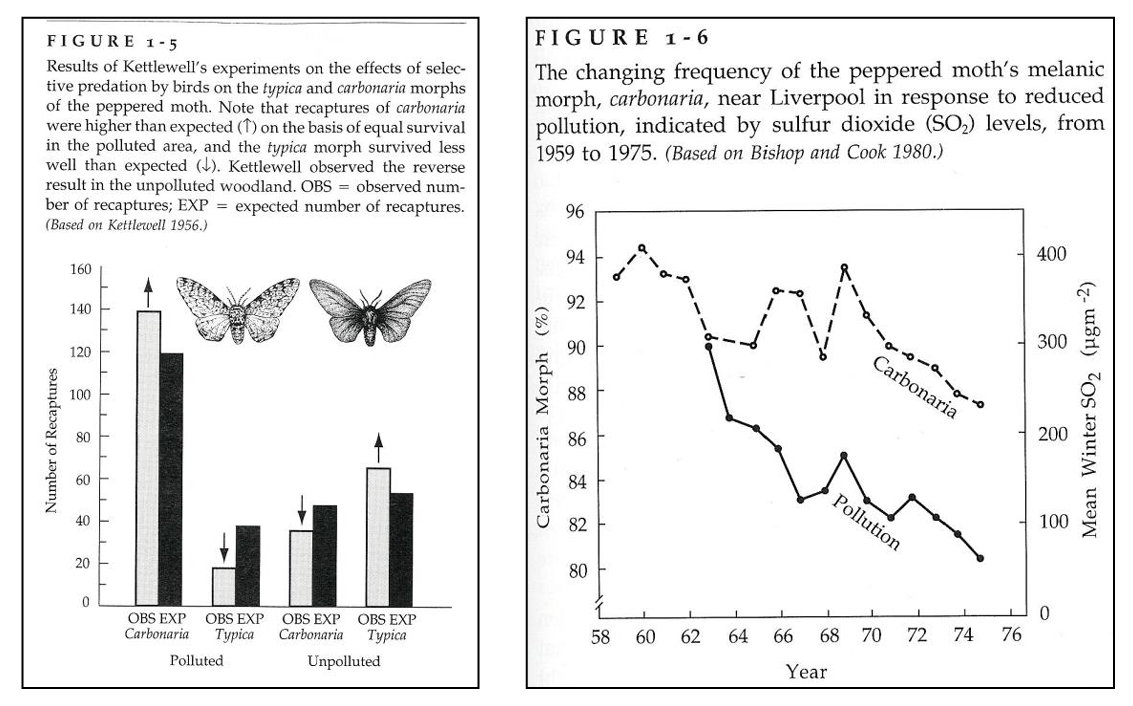
Describe Biston betularia carbonaria and typica including: the species in question, the variant trait that evolved, the relevant environmental conditions and selective pressure involved, the full course of the evolutionary changes that took place, and how this supports the evolutionary explanation for the modern state of biodiversity on Earth. You must also include one relevant quantitative figure and make reference to it in your description.
Biston betularia is the peppered moth that lived in England. It is mostly white with a few black dots. During the industrial revolution pollution turned many trees black with soot and it was observed that a small number of moths were melanic - virtually all black. This new color morph was termed Biston betularia carbonaria and the white form renamed Biston belularia typica.
Within a short time the melanic form increased in frequency and became the most common color morph due to selection. The mechanism appears to be that birds were better able to prey on individuals that had a color pattern that did not match the trees. An experiment performed by Kettlewell confirmed this - he released both morphs in areas that were polluted and non-polluted and recaptured more of the matching color morph than the contrasting morph in each area (left hand figure below).
Eventually England passed pollution control laws and the trees became white again and consequently the carbonaria morph started to decrease in frequency and the typica became more common again (right hand figure below), illustrating evolution in both directions correlated with the environmental change.
This example nicely shows how we can directly observe natural selection in the wild over short time scales. Since evolution occurs over short time scales there is no reason to expect that it doesn't occur over longer time scales and due to the compounding nature of evolutionary change this causes us to have confidence that longer periods of time would allow for considerable evolution to occur - even more than color changes in less than a hundred years ... entirely new body anatomies and species over millions of years.
Which of the following is NOT one of the biodiversity-defined geographic regions described in class?
Paleotropical

Assuming that both types of changes (dark to light and light to dark) are possible, what is the minimum number of evolutionary changes that would have to have happened if the phylogeny on the LEFT is correct?
3
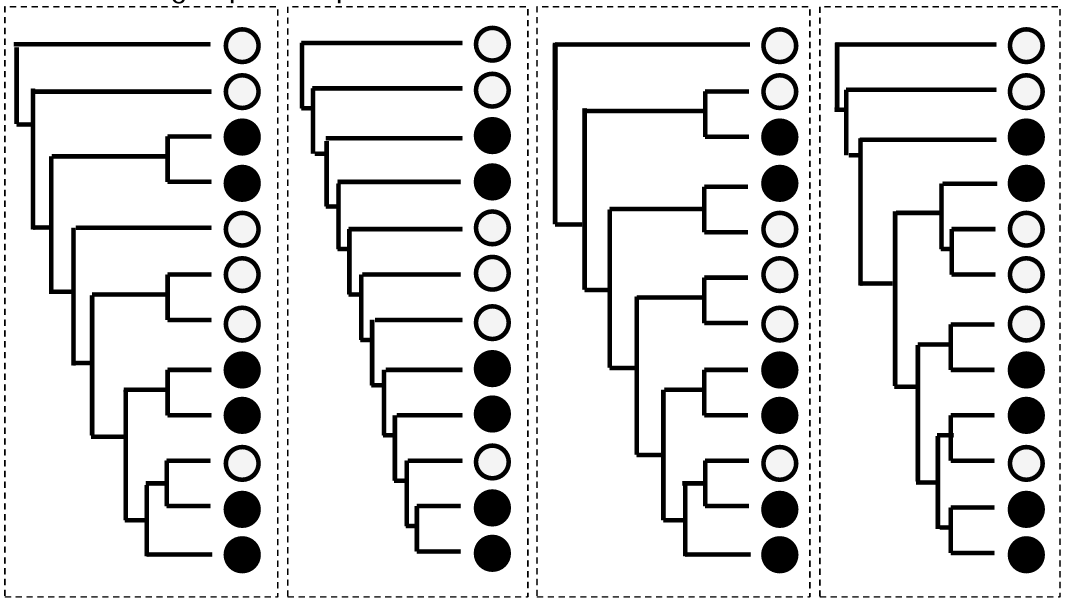
Assuming that both types of changes (dark to light and light to dark) are possible and considering the phylogenies from left to right, what is the minimum number of evolutionary changes that would have to happen for each phylogeny?
3, 4, 4, 4,

Assuming that only changes from light to dark are possible, and considering the phylogenies from left to right, what is the minimum number of evolutionary changes that would have to have happened for each phylogeny
4, 5, 5, 5,
Which of the following taxa is NOT an Eon
Paleozoic
Which of the following is NOT a member of bilateria
Anemone
Which of the following is NOT a chordate
Starfish
Which of the following is closest to when life on Earth began
3200 MYA
Which of the following taxa is most closely related to rodentia?
Primates
Ducks do not belong in which of the following taxonomic categories
Synapsida