Micro Economics A-level
1/102
There's no tags or description
Looks like no tags are added yet.
Name | Mastery | Learn | Test | Matching | Spaced | Call with Kai |
|---|
No analytics yet
Send a link to your students to track their progress
103 Terms
Opportunity cost
The cost of the next best alternative foregone when making and economic choice
Profit
Revenue accounting for costs. Profit is important because it creates an incentive for entrapaneurs to take a business risk.
Production possibility diagrams
A diagram which shows the maximum possible output combinations of two goods in an economy, assuming full and efficient employment of useful resources.
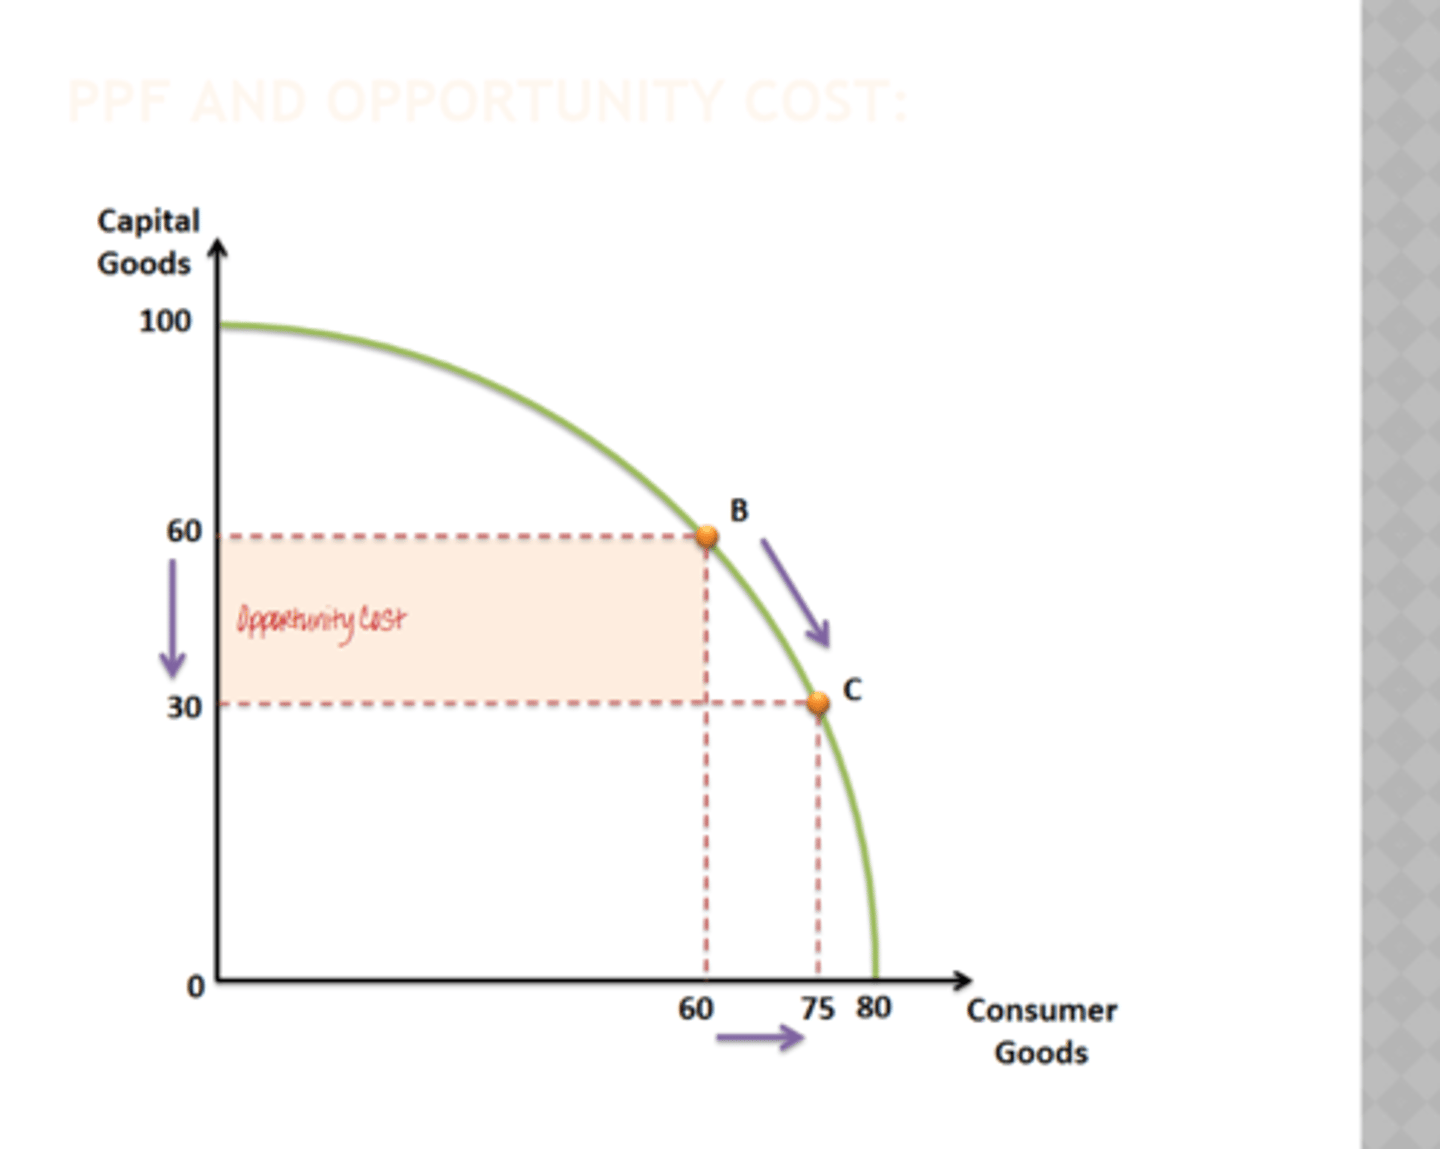
How a PPD works
-Any point on the curve suggests that all resources are being used efficiently
-If a point is behind the curve not all resources available are being used efficiently
-The curve can be pushed outwards or inwards depending the amount of resources
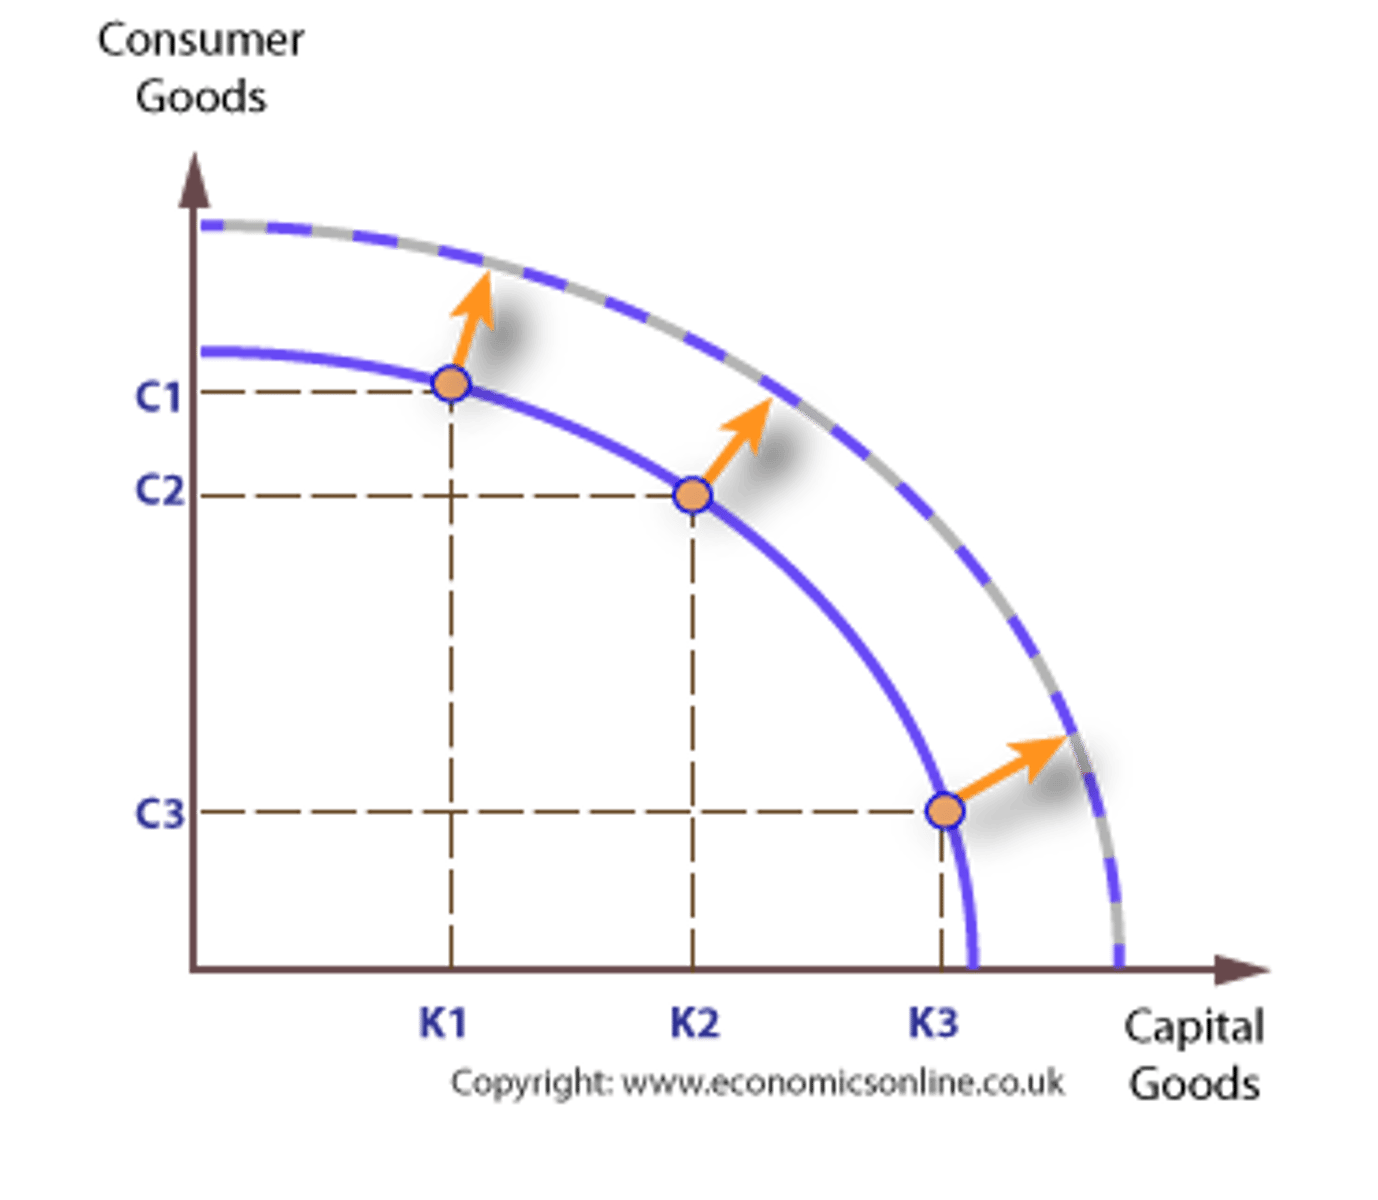
Factors causing an outward shift in the PPC
-Technological improvements that lead to increased productivity
-Discovery of new resources e.g oil and gas
-Changes that increase the working population e.g immigration or a raised retirement age
Factors that cause an inward shift in the PPC
-A prolonged recession which could lead to permanent loss of productive capacity
-A global disaster such as global warming, war or a pandemic
Productive efficiency
When maximum output is produced from the available factors of production and when it is not possible to produce more of one good or service without producing less of another
Allocative efficiency
When an economy's factors of production are being used to produce a combination of goods and services that maximises society's welfare
The demand curve (Price determination in a competitive market)
-Because demand increase as the price decreases, the demand curve is sloped downwards, creating an inverse relationship (income effect)
-As price increases, consumers find cheaper substitutes (substitution effect)
Utility theory
The amount of satisfaction or benefit that a consumer gains from consuming a good or service
Marginal utility
The satisfaction gained from consuming an additional good or service
Diminishing marginal utility
Decreasing satisfaction or usefulness as additional units of a good or service are consumed. For example, there is no need to drink three cups of coffee as the need for coffee is satisfied after two cups
Imperfect information
When economic agents do not need to know everything they need to know in order to make a fully informed decision
Ceteris Paribus
A Latin phrase that means "all other things held constant". It allows us to isolate the impact of price changes and see the impact is has on quantity demanded.
Causes of a shift in the demand curve
Population, Advertising, Substitutes, Interest rates, Fashions and trends, Incomes, Complimentary goods (PASIFIC)
Factors that affect the price elasticity of demand
Availability of substitutes, Income levels, Nature of product (luxury vs necessity), Time period (for people to find alternatives to a good in response to a change in price)
The Supply curve
-As prices increase it becomes profitable to supply more, meaning quantity and price have a direct relationship. This also means the supply curve slopes upwards
Factors that affect the supply curve
Productivity, Indirect tax, Number of firms, Technology, Subsidies, Weather, Costs of production
Factors that affect price elasticity of supply
Time taken to expand supply, Size of spare capacity, Available stocks of goods, Ease of switching production
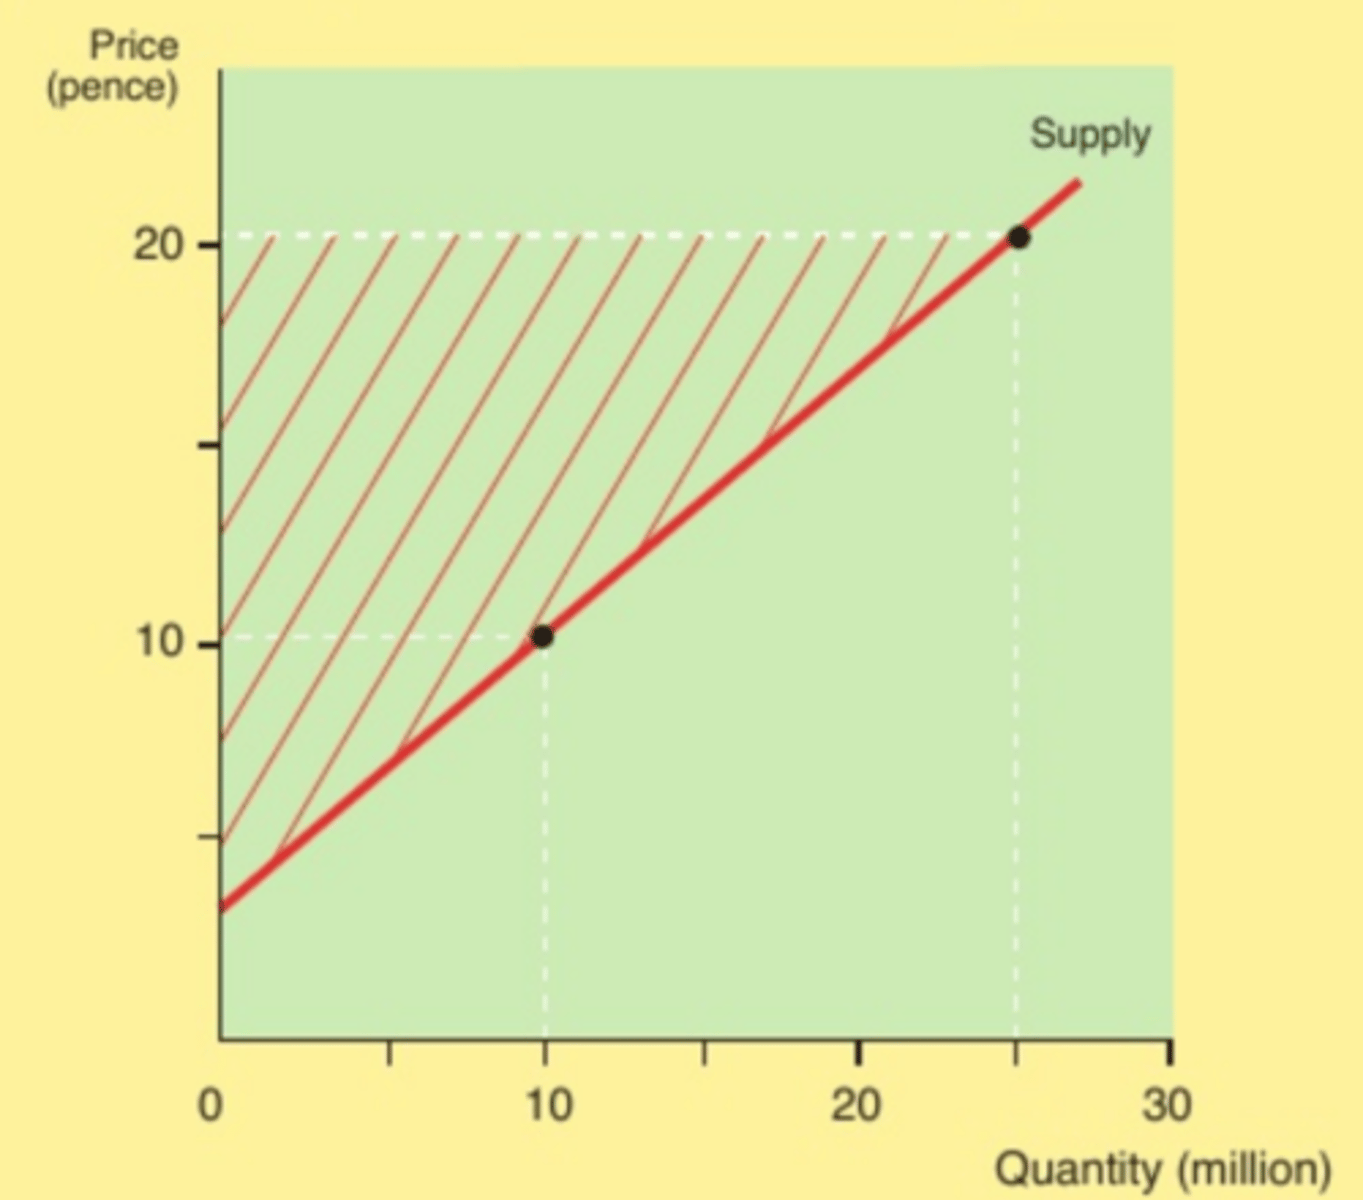
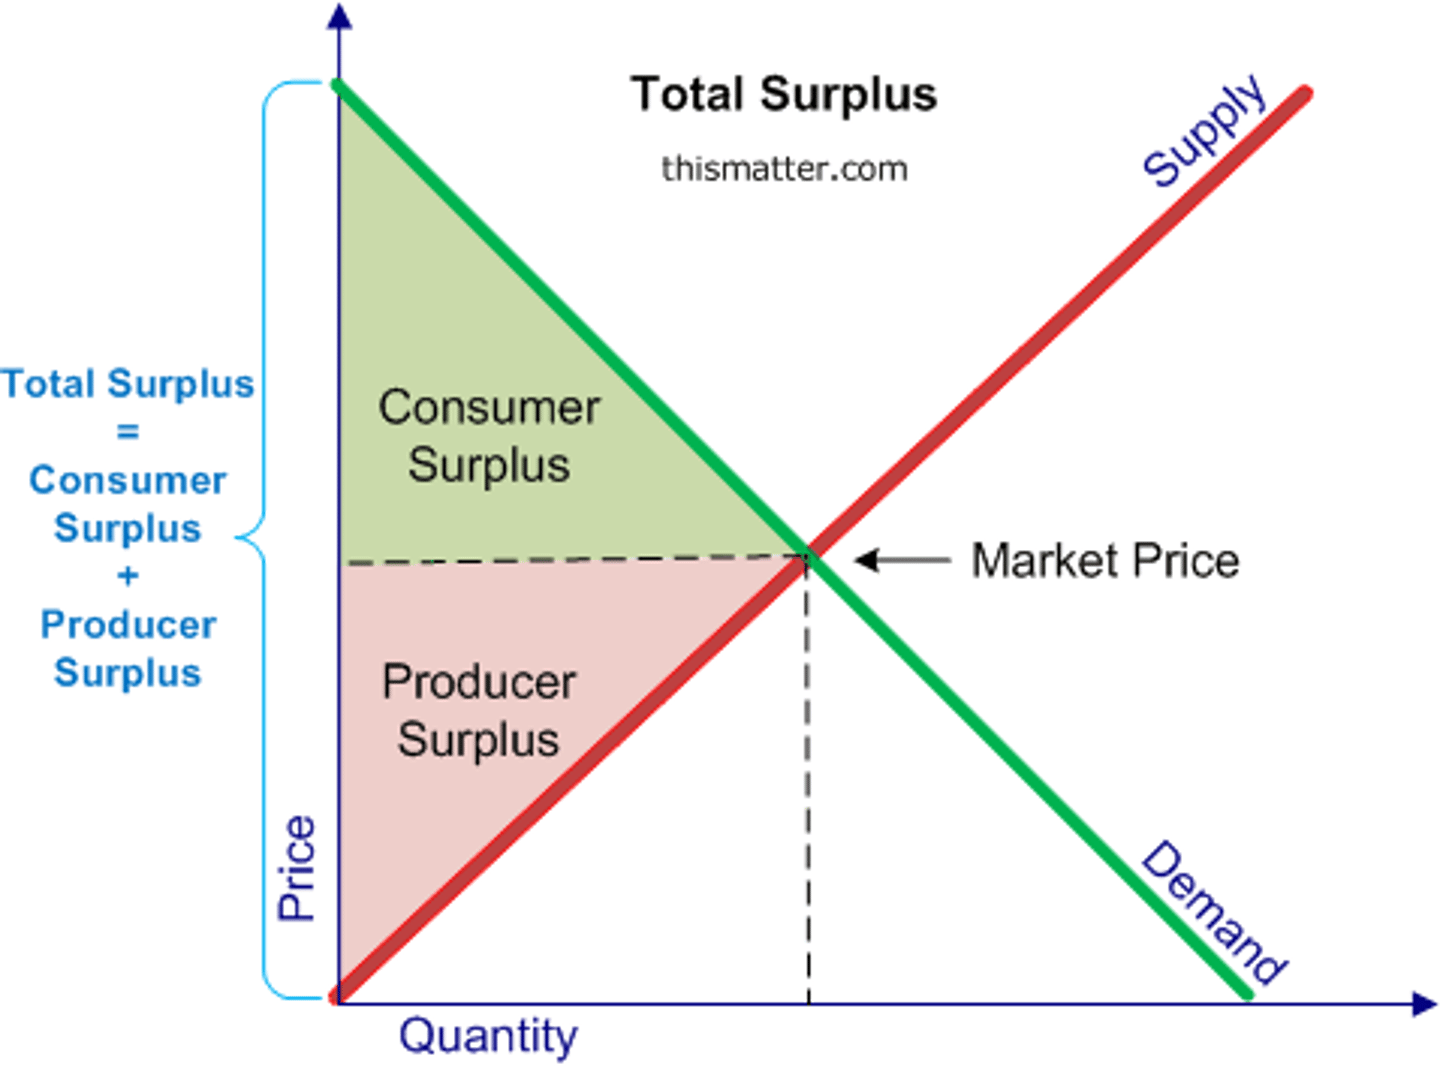
The producer surplus
The difference between what a producer is willing and able to supply a good for and the profit they actually receive. Every producer has a minimum price they would accept for their good, if someone payed for a good at the market price, that is a gain for the producer as they may have been willing to accept a price below that, leading to the producer surplus.
Consumer surplus
The difference between what consumers are willing able to purchase a good and the actual price. If the price of a movie ticket is £15 and a consumer is willing to pay £18, the consumer surplus is £3. Every customer has a maximum price their willing to pay before they buy a good, which is usually above the market price. The fact that the market price is below the maximum price their willing to pay is a benefit for the consumer as they pay less money for the good, creating the consumer surplus.
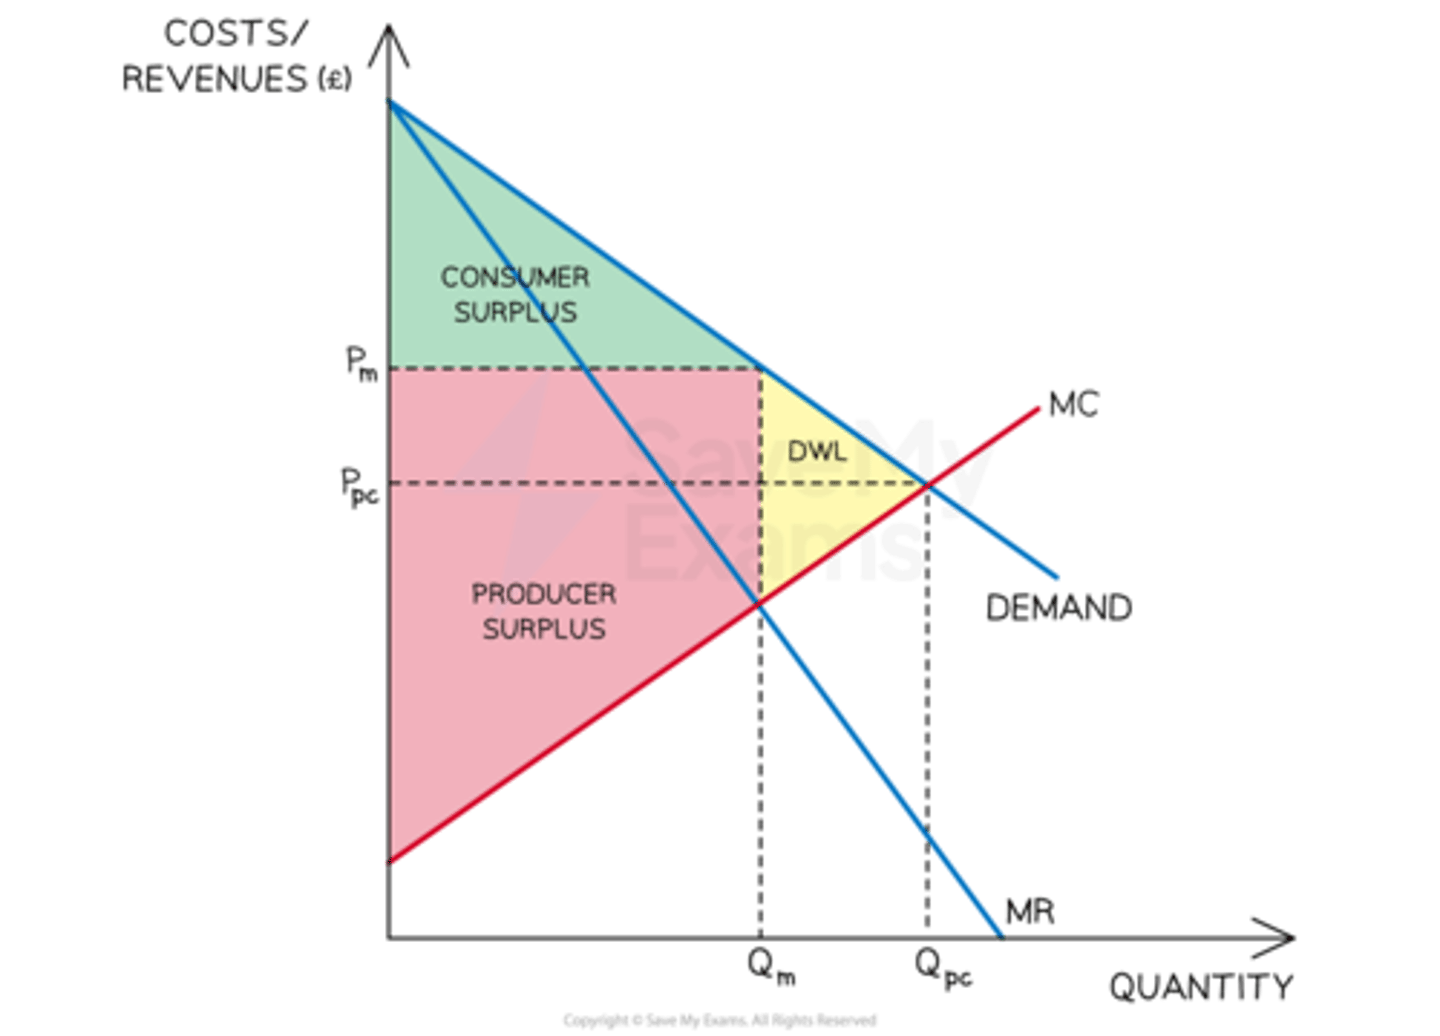
Consumer and producer surplus in a monopoly
-In a monopoly, the firm tends to restrict output so prices rise.
-As prices rise, the producer surplus will increase and the consumer surplus will decrease.
-The decrease in the consumer surplus is equal to the increase in price and the DWL
-The a DWL is created from the decrease in output as the firm seeks to increase prices
Fluctuation of elasticity
if the price of an elastic good is extremely low and the price becomes even lower, demand would be inelastic as the maximum amount of consumers are willing able to buy the good
Short run benefits of competition
-Lower prices
-More choice
-Non-price competition e.g vouchers, gifts, discounts. fast delivery
Long run benefits of competition
-Sustained lower prices
-Improvements in tech
-More R&D
Characteristics of perfect competition
-Large numbers of buyers and sellers
-perfect knowledge of the market
-no barriers to entry or exit from the market
-each firm sells an identical product
Contestable market
-A contestable market is a market that has very low barriers to entry and you can easily enter and exit the market, having the same access to technology and information as established firms in an industry.
-How contestable a market is determines how firms will seek to make profit. A contestable market will see firms quickly enter and exit a market to see supernormal profit and a less contestable market will see firms try to increase quality and reduce prices.
Sunk costs
-This is when a firm makes large investments into an industry, which are very hard to recover or cannot be recovered. For example, A firm may have bought expensive assets that are specialised and difficult to sell.
-The deeper the sunk costs the less contestable the market is
Market structures
-Market structures are characteristics of a certain market in which a firm or industry operates.
-These characteristics can include: Barriers to entry, degree of competition, type of product (homogenous or differentiated), number of buyers, size of firms
-Market structures also depend on if there is perfect or imperfect competition e.g Oligolpoly, monopoly
Dynamic efficiency
-Long-term efficiency from a firm re-investing its profits into innovation
-Firms can reduce long-term costs by re-investing profits.
-R&D allows firms to allocate resources in the most optimal way as new technologies are more productively efficient and firms gain better knowledge into what consumers want due to it correcting imperfect information market failure
-Investing in himan capital such as education makes workers more productive.
-Reinvesting in capital increases productive efficiency.
Hit and run competition
-When a firm who seeks supernormal profit will quickly enter and exit a contestable market to see large profit increases.
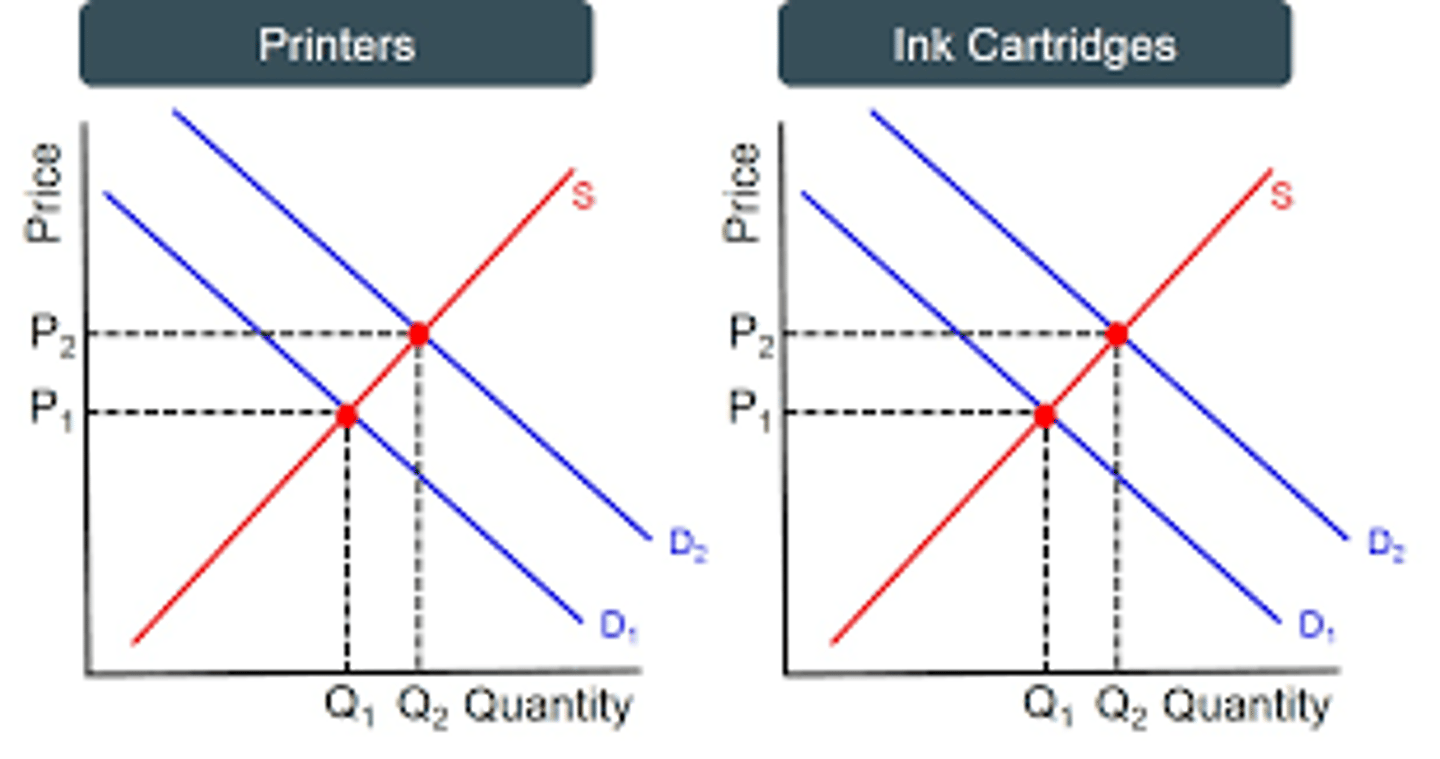
Joint demand
When the demand of two goods that are consumed together are interlinked. If the supply of printers shifts the the right then the demand for printer ink shifts to the right.
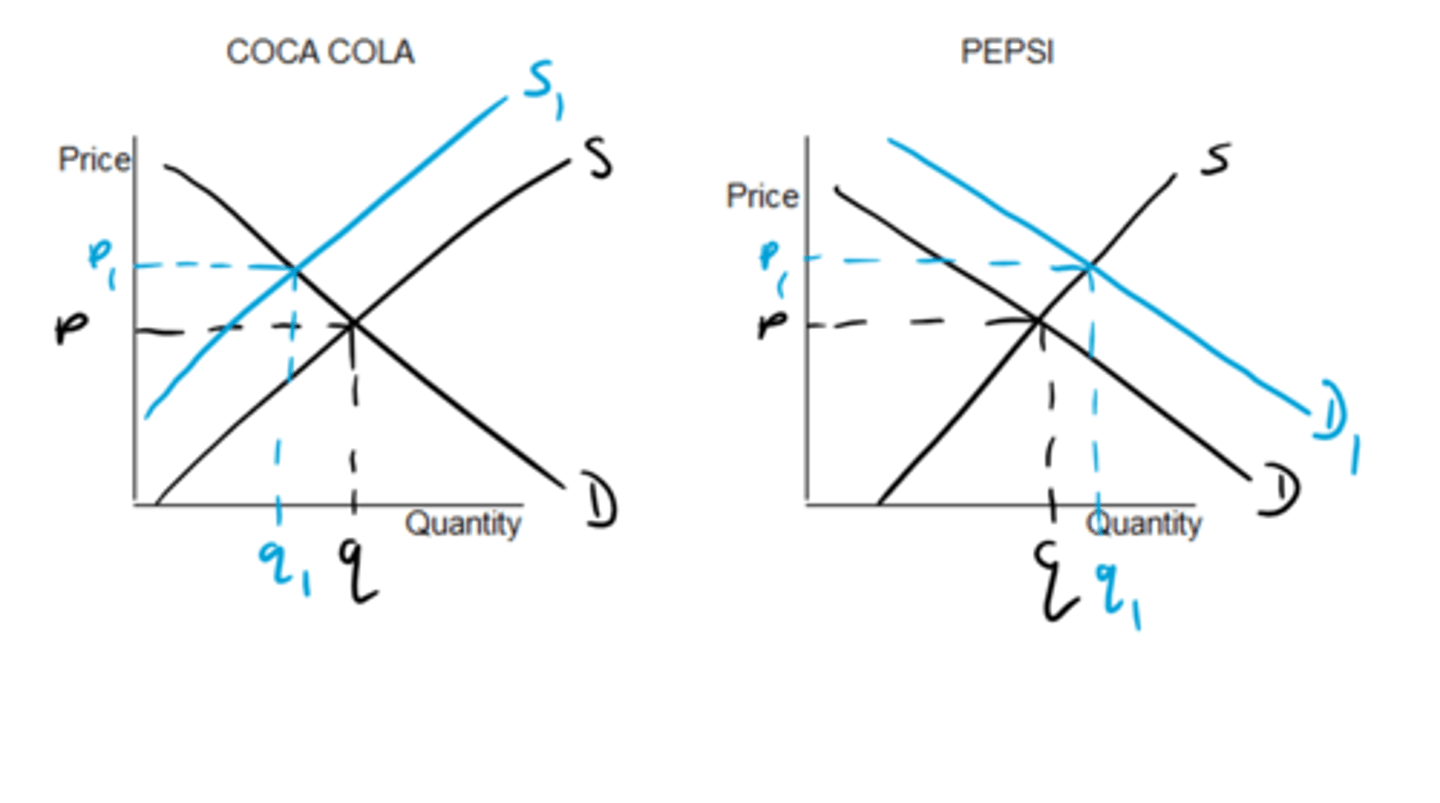
Competitive demand
When one good or service may be consumed as an alternative to another good or service. If the supply of beef shifts to the left then the demand for pork shifts to the right
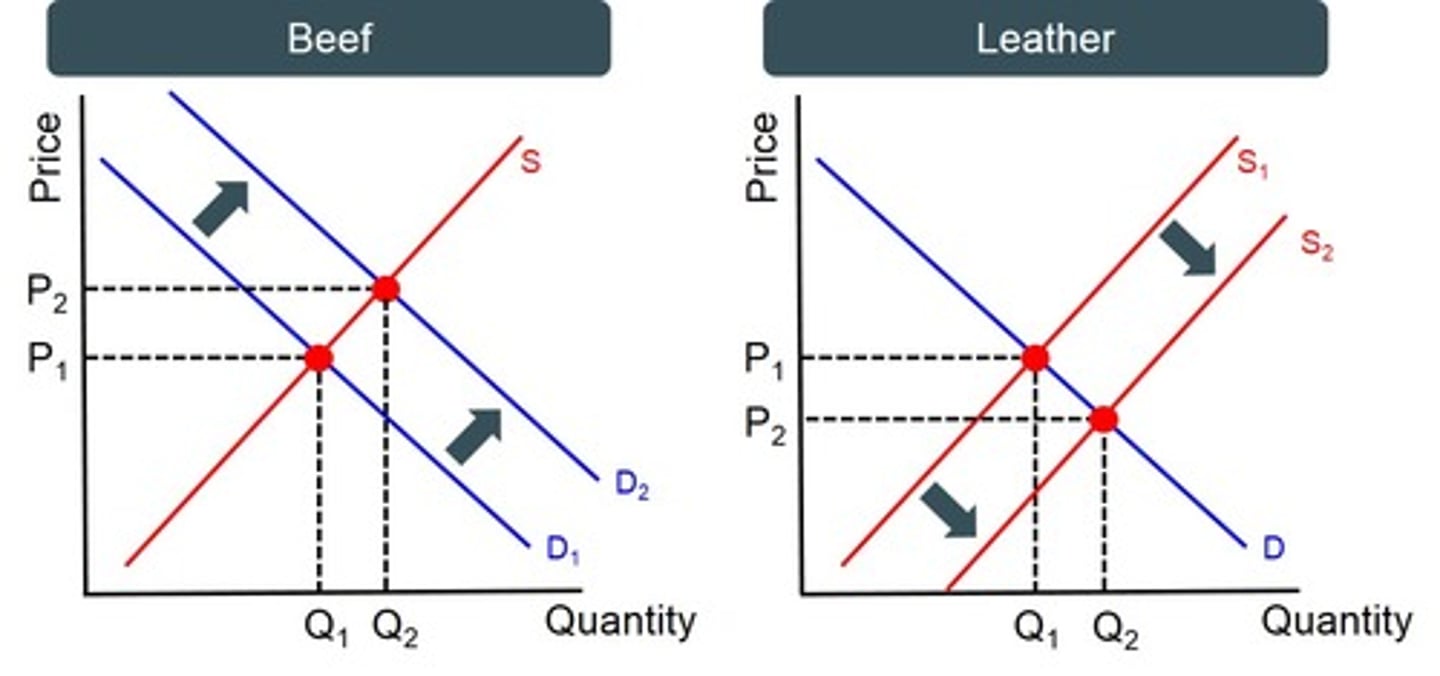
Joint supply
When the supply of two goods that are consumed together are interlinked. If the demand for beer shifts to the left the supply of leather shifts to the right
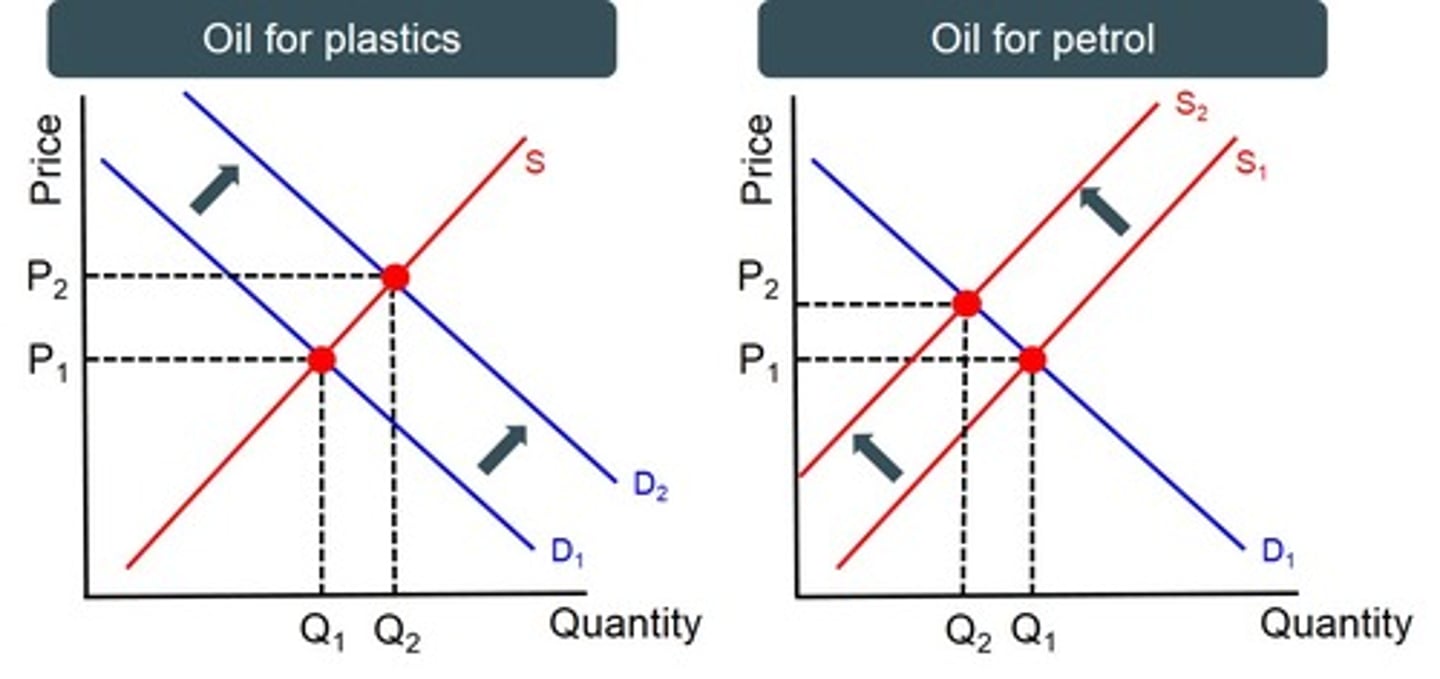
Composite demand
When a good is demanded for more than one use. If the demand for oil for plastics increases then the supply for oil for petrol decreases.
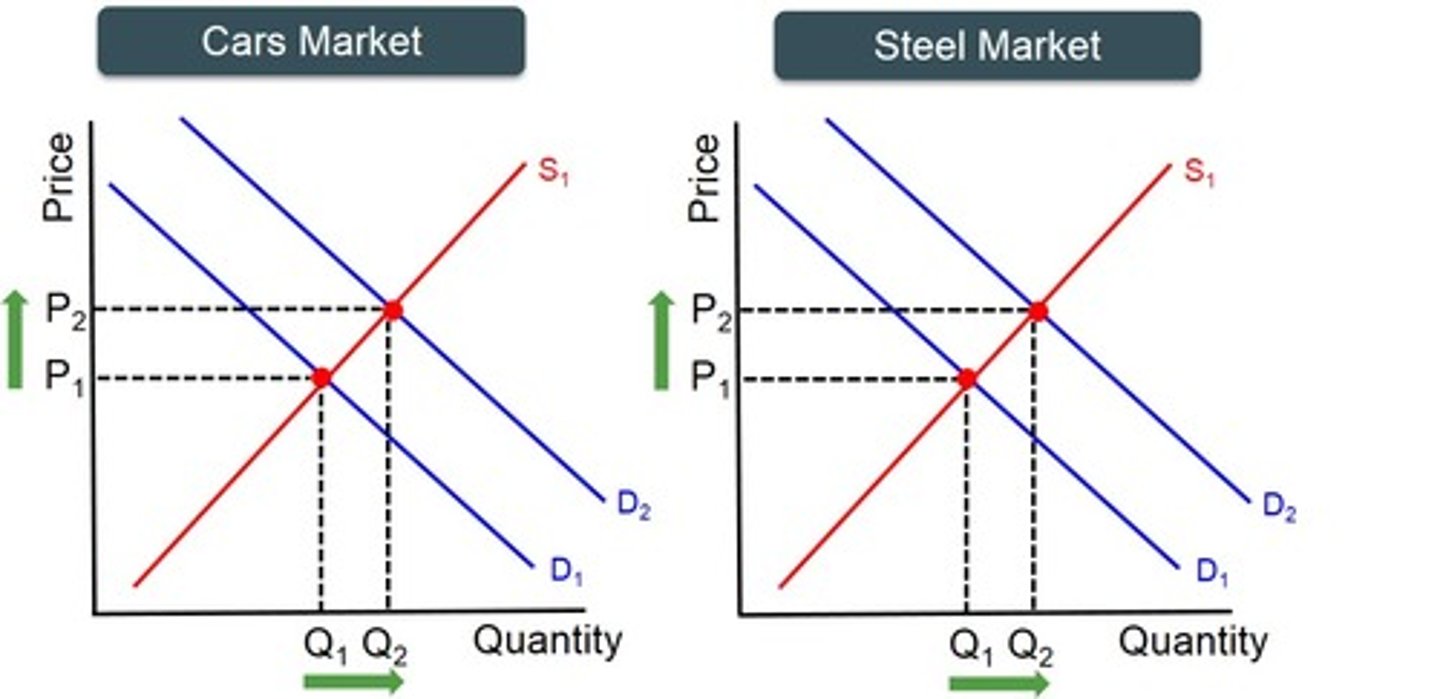
Derived demand
When demand for one good or service comes from the demand for another good or service. Id the demand for takeaway coffee increases then the demand for baristas increases
Income elasticity of demand
The responsiveness of demand to a change in income. Equation = %change in quantity demanded/%change in income. Normal goods will have a positive income elasticity. Luxury goods will have an income elasticity above 1 and inferior foods are below 1
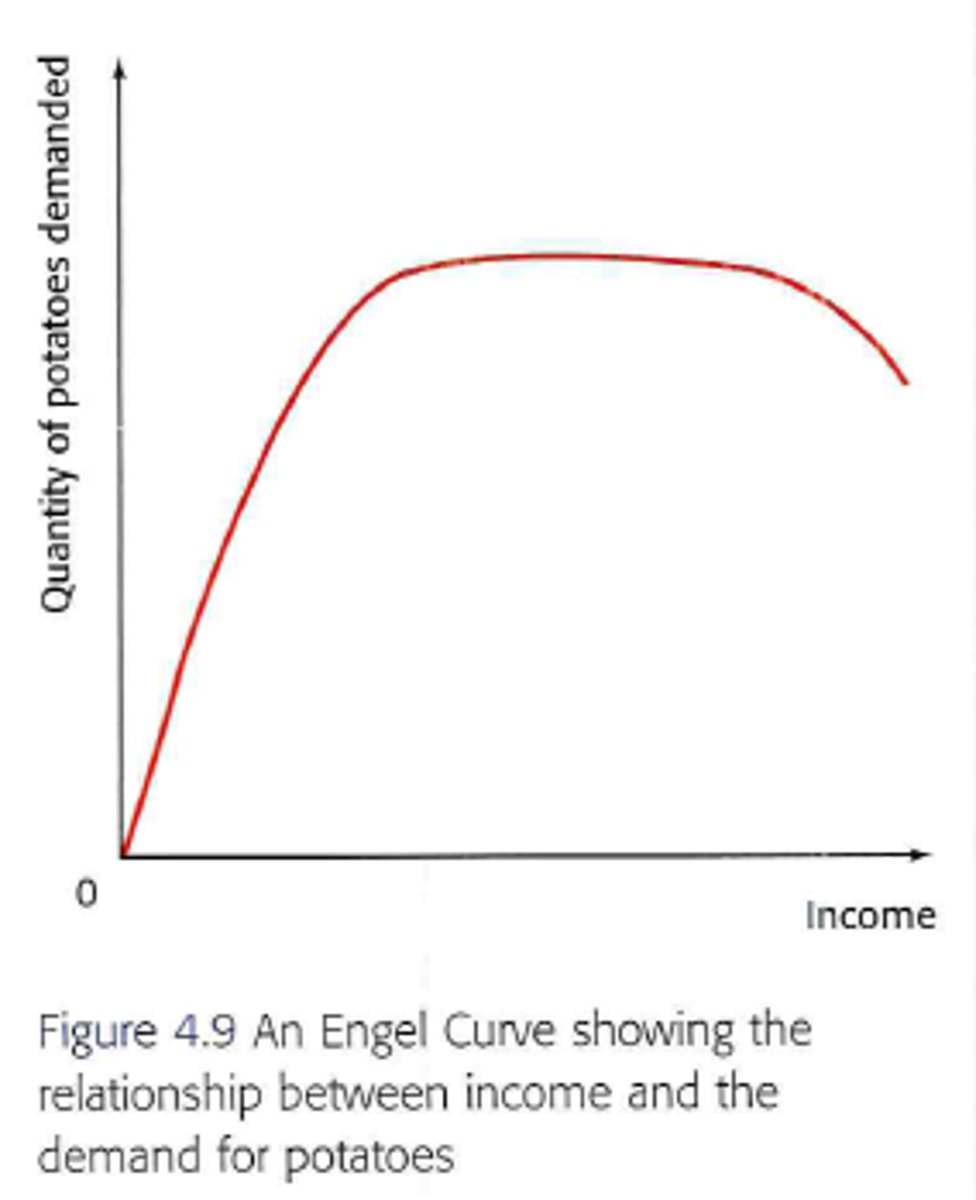
Income elasticity of demand graph
At the lowest level of income, demand is inelastic as consumers will buy anything they can afford. As incomes rise, demand is more elastic as consumers can afford to buy more goods, including substitutes for other goods. As incomes rise even more, demand remains inelastic but consumers will instead buy more luxury goods rather than inferior foods, meaning the demand for some essential goods among high earners will decrease.
Importance of income elasticity of demand
-Firms can predict if demand will increase or decrease.
-Id income is expected to increase firms can increase price to meet demand
Cross price elasticity of demand
Considers the effect of a change in the price of good B on the quantity demand of good A. This can be in the form of a complimentary good, in which the price will be directly proportional, or if it is a substitute the price will be inversely proportional.
Equation for cross price elasticity of demand
%change in quantity demanded for good A/%change in quantity demanded for good B
Market failiure
When scarece resources are not allocated effectively
Types of market failiure
Public goods, monopolies, positive and negative consumption externalities, positive and negative production externalities, factor immobility, inequality, information asymmetry.
Public goods
A public good is a good that is used by everyone and is non-rivalrous and non-excludable. Firms cannot produce a public good as there are always "free riders". Examples include public parks and streetlights.
Non-excludability
Individuals cannot be excluded from consuming a good. They are provided the good whether they have paid for the good through indirect tax or not
Non-rivalrous
Consumption by any one person does not affect the consumption of others.
Free riders
People who directly benefit from the consumption of a private good but who do not contribute towards its provision
Quasi-public good
A good that has some of the characteristics of a public good but are not completely free. Examples include beaches where fees are charged.
Monopoly Power
A market structure where a single seller dominates the market, reducing competition and leading to higher prices for consumers. This means that a monopoly may intentionally not make full use of its factors of production to create allocative inefficiency, meaning they produce less output in order to increase the price of their goods, which is market failure.
Information Asymmetry
A situation where one party has more or better information than the other, leading to the consumer choosing an option for a good or service which is not financially suitable for them. This leads to an overconsumption of a good, which differs from the socially optimum level of output, leading to allocative inefficiency and market failure
Imperfect Competition
Market structures that fall between perfect competition and monopoly, resulting in inefficiencies in pricing and output.
Factor Immobility
The inability of factors of production to move freely to where they are most needed, causing unemployment and inefficiency. Examples include no spare capacity or spare room
Geographical immobility
When skilled labour is unable to move between places due to distance and travelling costs. This means that potentially skilled labour cannot access the main areas of employment for their work. If there are less skilled workers in an industry, it may decrease output, causing allocative inefficiency and market failure.
Occupational immobility
When workers are not able to change jobs due to lack of transferable skills. This is a market failure because it means that labour isn't used to its full allocative potential, leading to a misallocation of resources.
Inequality
Disparities in wealth and income distribution that can lead to social and economic inefficiencies. This means that a large portion of the population cannot afford good education and healthcare, leading to an underconsumption of merit goods. This is not the socially optimal for the much of the population, which means that allocative inefficiency and market failure have taken place.
Positive externality in production
A positive knock-on effect that the production of a good has on a third party. If a new airport runway is built, it may bring in extra tourism revenue for the government
Graphing a positive externality in production
MPC is greater than MSC of producing a good, making it better for wider society. The DWL between MPC and MSC is an underproduction as firms only look at their costs rather than the costs to society, meaning that there will be an underproduction of airports because it is expensive for the firms.
Positive externality in consumption
Positive externalities in consumption occur when the actions of individual consumers have wider benefits to society.
Graphing a Positive externality in consumption
MSB is greater than MPB because consuming more of a good that benefits society will increase the MSB. The DWL between Q1 and Q2 represents an underconsumption as consumers only account for their MPB, meaning they consume less of a beneficial good than society would prefer. The optimum point is where MSB=MSC
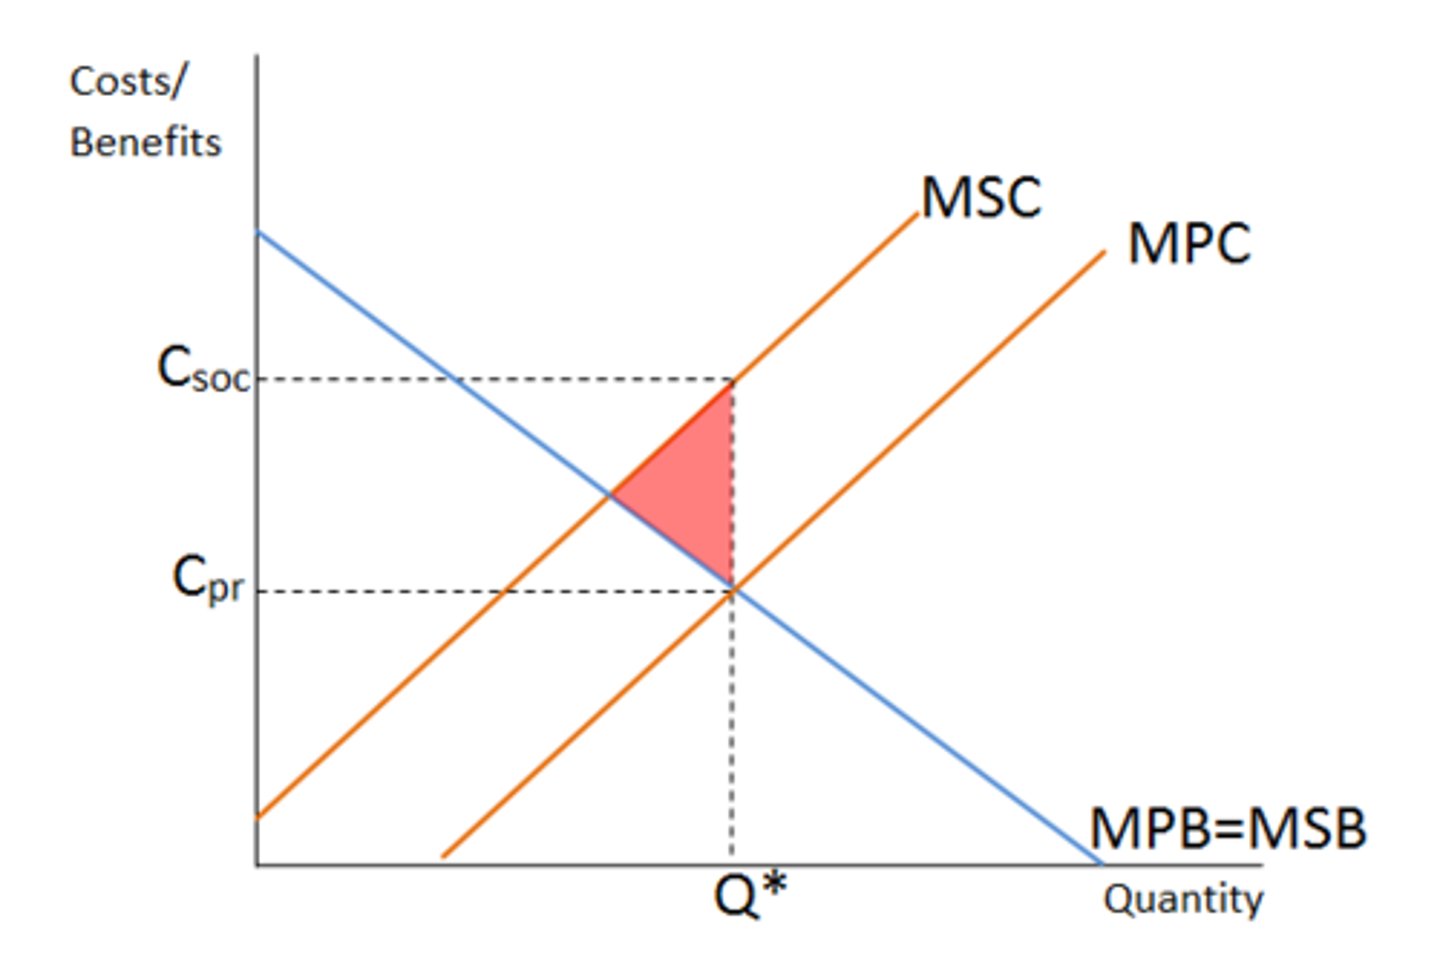
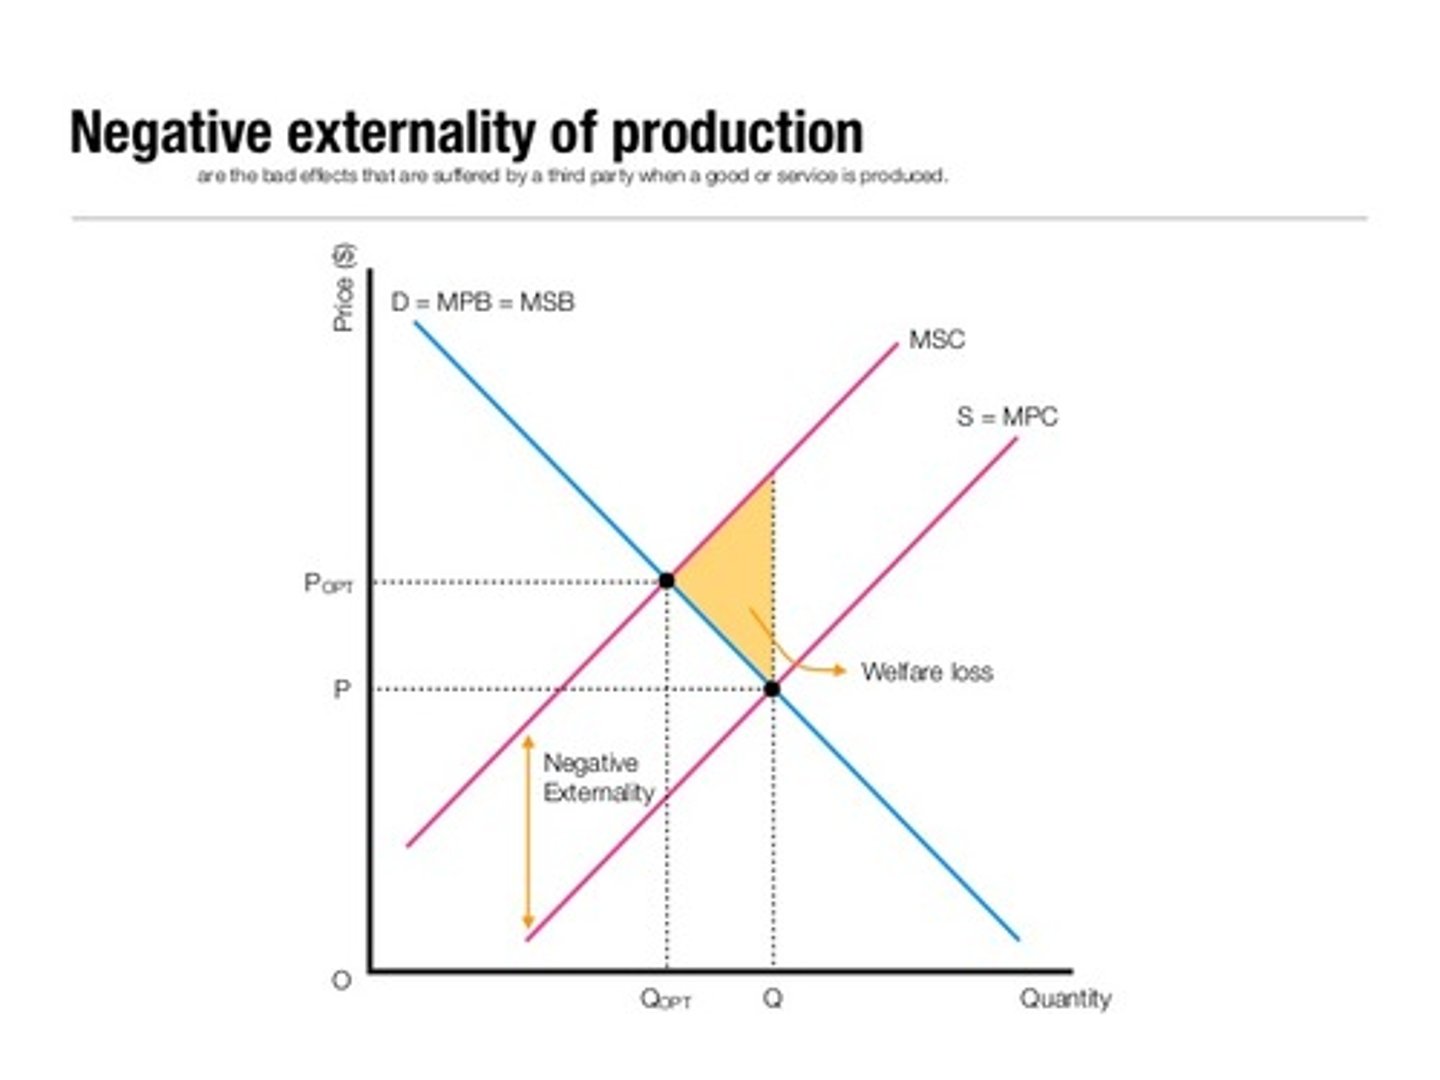
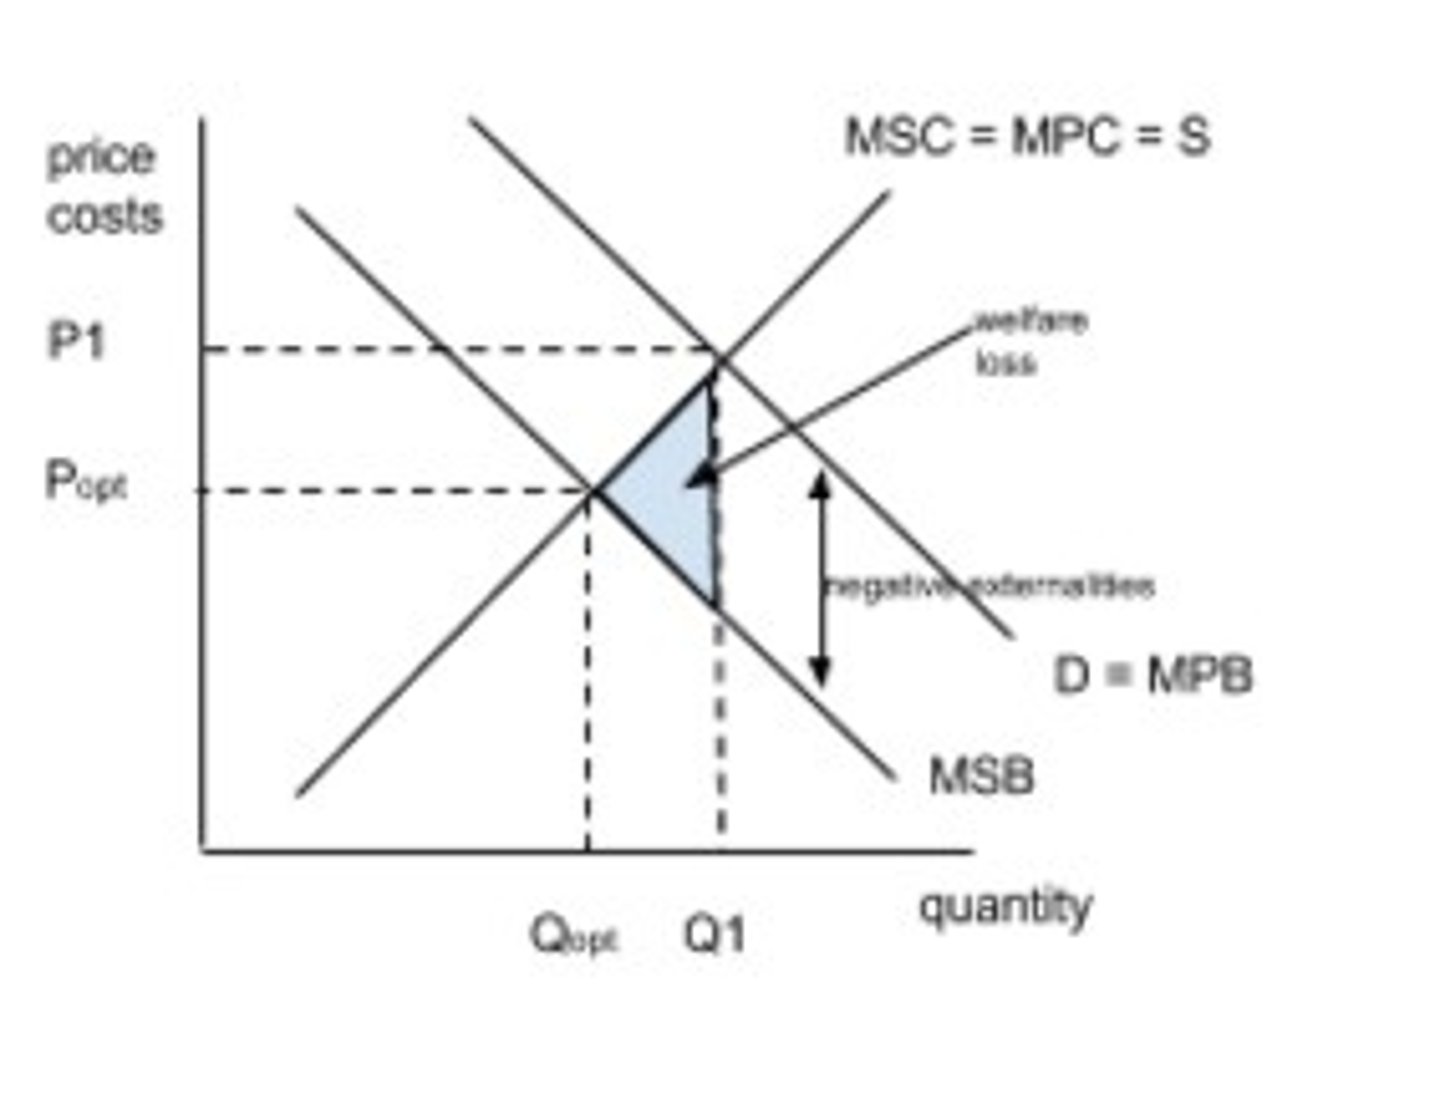
Negative externalities in production
Negative externalities in production arise when a firm fails to take into account the wider negative impacts of their activities on society.
Graphing negative externalities in production
The MSC is greater than the MPC as firms do not take into account the impacts of the production of their good has on wider society, the only care about their own costs. The DWL represents the overproduction of a negative good. The MSB=MSC
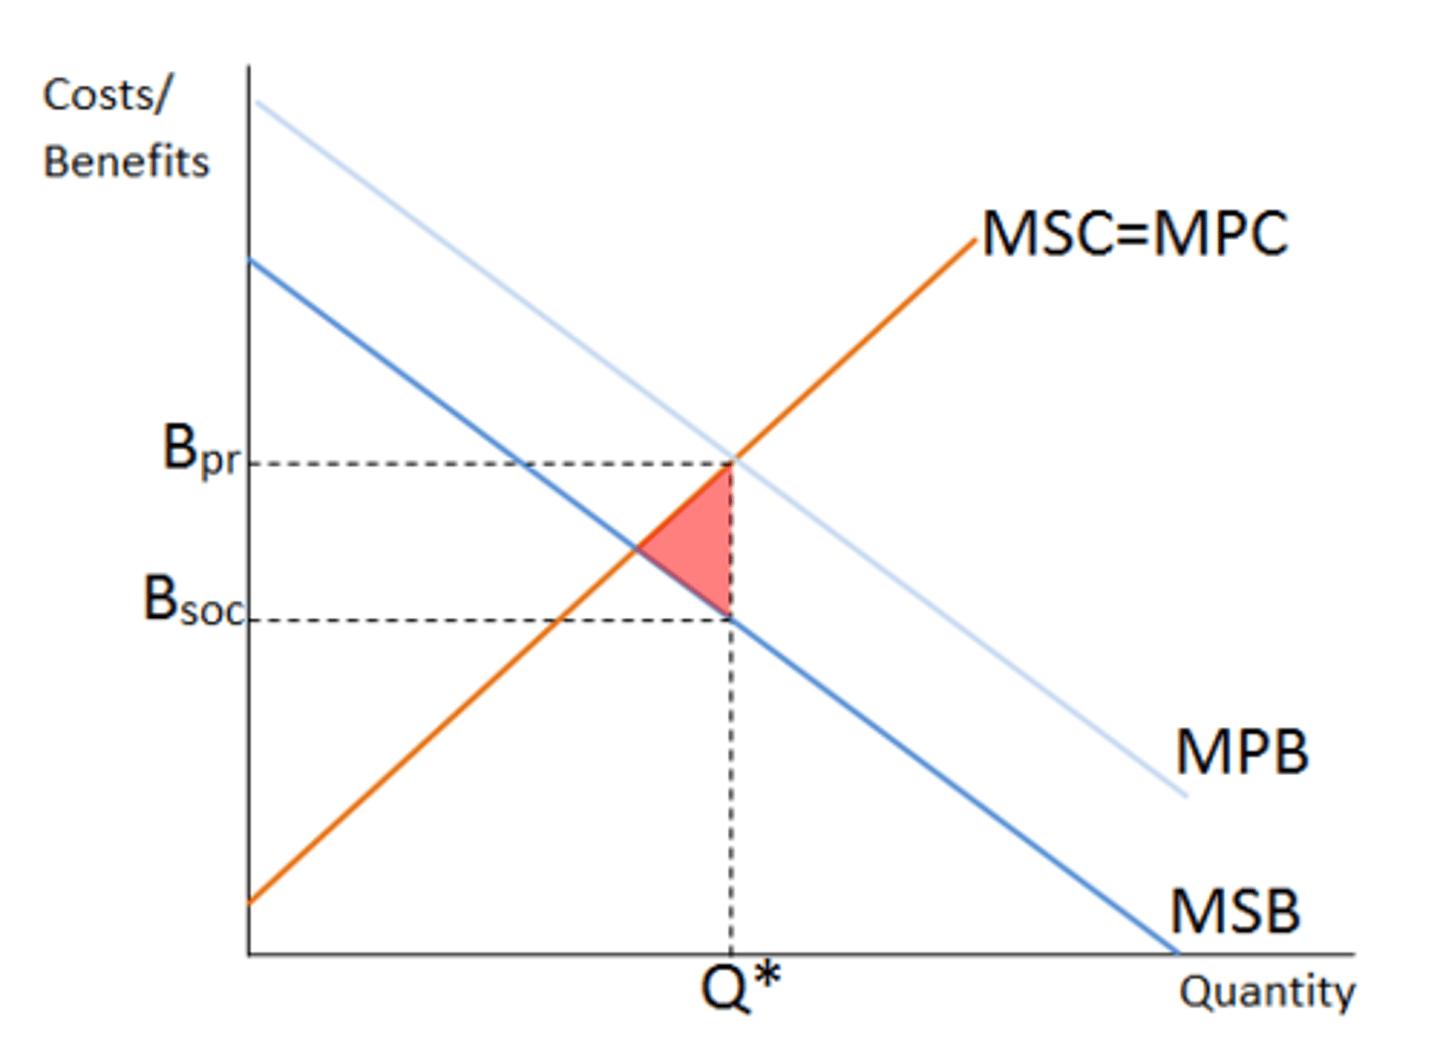
Negative externalities in consumption
This occurs when the consumption of a good is more beneficial to an individual rather than society
Graphing negative externalities in consumption
MPB is greater than MSB as there is a greater benefit for the individual rather than society. The DWL represents an overconsumption of a good as consumers only care about the MPB rather than the MSB. The optimum point is MSB=MSC
Merit good
A good which is under-consumed in a free market system, such as education or healthcare.
Demerit good
A good which is over-consumed in a free market situation, such as fast food or cigarettes
Correcting market failure: Subsidies
Use: When there is an under consumed good, the government may subsidise a firm that produces that good so they can expand production.
Problems: Firms may use the money to pay shareholders instead, subsidies are expensive and are useless if allocated inefficiently, if demand is inelastic for the good demand will not increase.
Correcting market failure: Information provision
Use: To educate the population about the effects of consuming a good in the hopes they stop or start consuming that good
Problems: No guarantee of success: many are not really affected and will still consume the good due to factors like peer pressure, habitual use and addiction, mental health.
-The cost of advertising and education in schools and clinics is also very expensive for the government
Correcting market failure: Indirect tax
Use: Putting taxes on production in order to drive up costs for the producer, which is then payed for through higher prices.
Problems: Indirect taxes are regressive, meaning they will have a greater impact on those with lower incomes, as they will have to pay a greater share of their income for a good than a wealthy person.
-If a good is inelastic, then a change in price will not greatly affect a change in demand.
Correcting market failure: Regulation
Use: Banning or limiting the production of a good because it has negative externalities.
Problems: The cost of enforcing the regulation is high e.g the cost of higher specialised staff with new detecting tech.
- Creates black markets which creates opportunities for criminal activity to thrive
-If the regulation is too strict firms may go under or relocate to other countries, consumers will look to black markets.
Correcting market failure: Maximum price ceiling
Use: To bring down the cost of an under-consumed good in the hopes that it increases demand
Problems: If the price is set to low, it may mean that firms costs outweigh their profits, leading to firms going under or relocating
-Firms may decrease production, widening a supply-demand gap
Correcting market failure: Minimum price control
Use: By setting a high minimum price, fewer people will buy a good as it is more expensive.
Problems: This is regressive as it has a greater effect on those with lower incomes as buying the good takes a greater share of their income.
-If demand is inelastic, then demand will not be affected by a minimum price control.
-If not set at the right level, firms could go under or relocate as demand is too low to meet supply.
Correcting market failure: State provision
Use: If there is a good that is under consumed in the free market, the government will supply a good such as education and healthcare.
Problems: If a good is free, it will inevitably cause excess demand (Market could intervene to relieve pressure if there is excess demand)
-It will also cost lots of tax payer money, which could lead to increased taxes and cuts to other services in the long run.
Keynsian economic school of thought
Keynsians believe that government intervention is usually necessary, with them supporting fiscal and monetary policy to correct the market. In a recession, they argue that sticky wages mean that firms cannot lower wages due to contracts and unions, leading to firms firing workers. Therefore, the economy can operate below full employment.
Neo-classical economic school of thought
Neo-classical economists believe that government intervention will only result in market failure, in the market always corrects itself. In a recession, wages are not sticky but flexible, so no wrokers are fired and the economy readjusts by itself without government intervention.
Government failiure
When government intervention leads to increased or a new market failure
Government failure: Imperfect information
-A government may not have perfect information about a market their trying to regulate, which can lead to market inefficiency and failure. e.g the financial market is very fast and complex and regulation often can't keep up with markets
Government failure: Conflicting objectives
When one government policy comes at the expense of another. For example, environmental regulations around cutting down trees may conflict with a subsidy to farmers who wish to increase output
Government failure: Administrative costs
Regulation and administration can be expensive, sometimes costing more than what the cost would be without government regulation, making the allocation of resources worse. For example, the cost of hiring workers to monitor a regulation may exceed the cost caused by the market failure.
Government failure: Market distortions
This is when the government intervenes with a price signal to correct a market failure, but may end up causing others such as shortages and surpluses. A minimum price control may lead to surpluses and a maximum price control may lead to shortages.
Government failure: Unintended consequences
This is the idea that governments create extra , unforeseen issues in the market as a result of intervention. For example, more people may consume harder drugs if there is heavy regulation around alcohol
Government failure: Regulatory capture
When firms influence regulation rules in the government to benefit the firm. This is done by some firms spending millions to influence politicians and regulators to make regulations to fit their product or reduce competition.
Total revenue and Average revenue calculation
Total revenue = Price x quantity
Average revenue = Total revenue/quantity
-All thing being equal and not economies of scale, more output always leads to less revenue
Marginal revenue
The revenue gained off producing one extra unit of output. Calculation = TRn-(TRn-1)
e.g: The total revenue gained producing the 100th good from the 99th good
The profit maximising point
MARGINAL COST = MARGINAL REVENUE
-This is because at the point where TR>MC, you are not producing some units of production, which could bring in more revenue. When TR
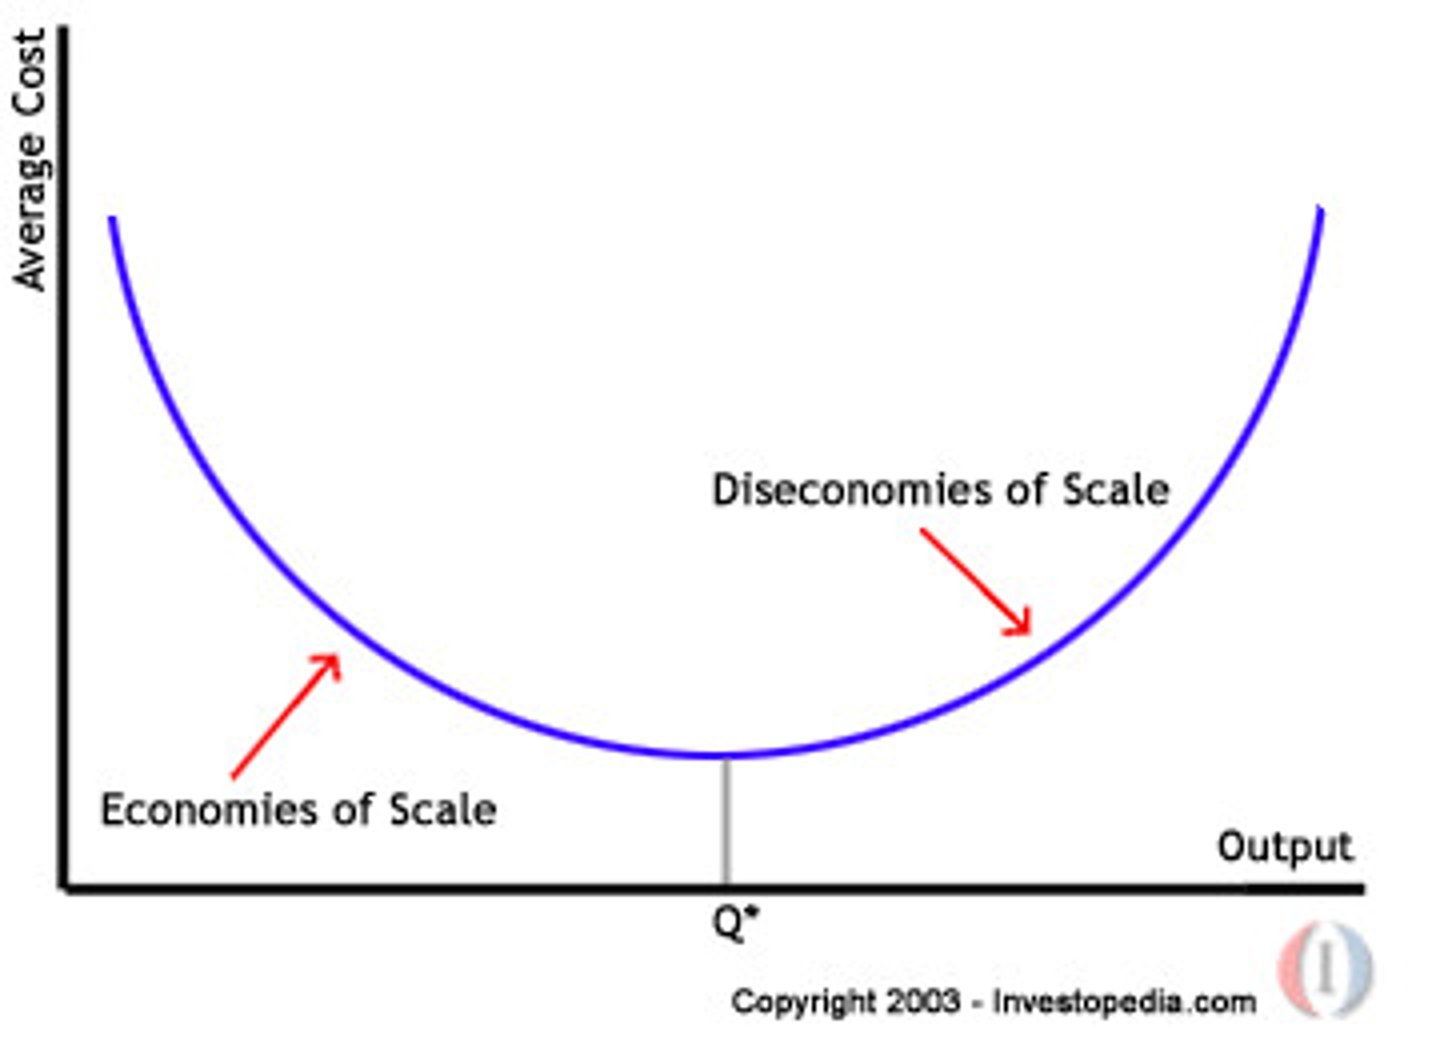
Minimum efficient scale of production
The lowest level of output at which average total costs of production are minimised. In the graph, Q is the MESP

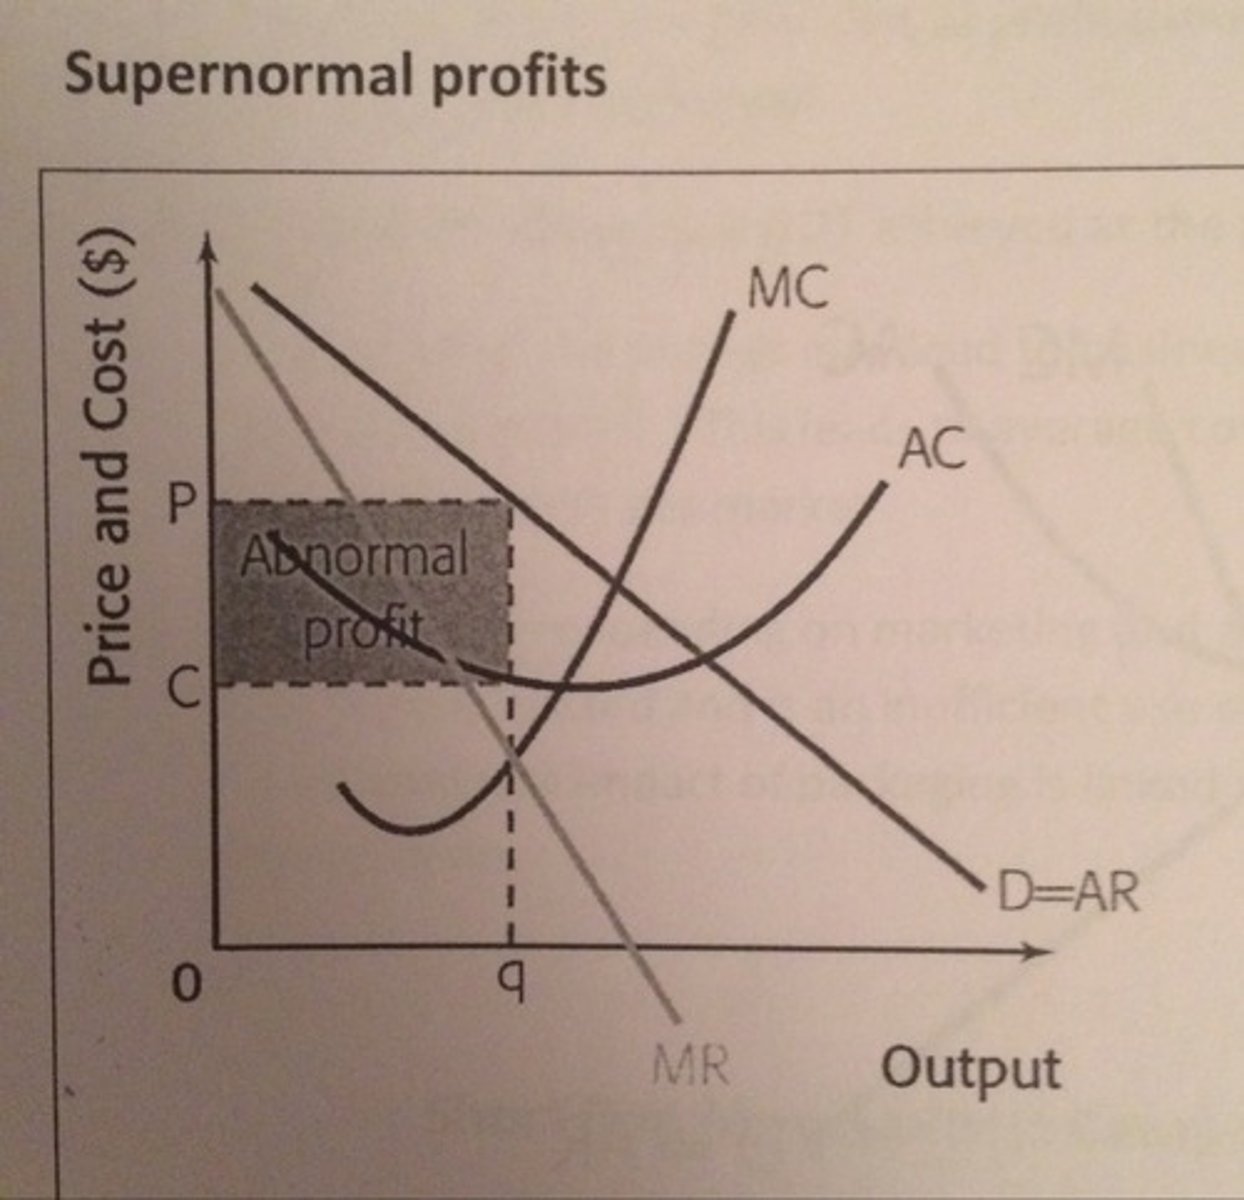
Supernormal profit
When a firm makes enough excess profit which allows them to expand quickly and compete affectively
Normal profit
When there is enough profit so that the firm can effectively run but not enough to expand rapidly or compete affectively
Economies of scale
-Factors which all lead long-run average costs to fall as production increases.
Internal economies of scale
These refer to the cost advantages of increasing production for a singular firm
Types of internal economies of scale
Risk bearing, Financial, marketing, technical, managerial, purchasing
External economies of scale
The cost advantages a whole industry receives of expanding production.
Diseconomies of scale
When a firms long-run average costs increase when a firm increases output. Q* is at the optimum point where costs are lowest and output is highest. This can be because it can be hard to communicate and coordinate spending across a large firm.
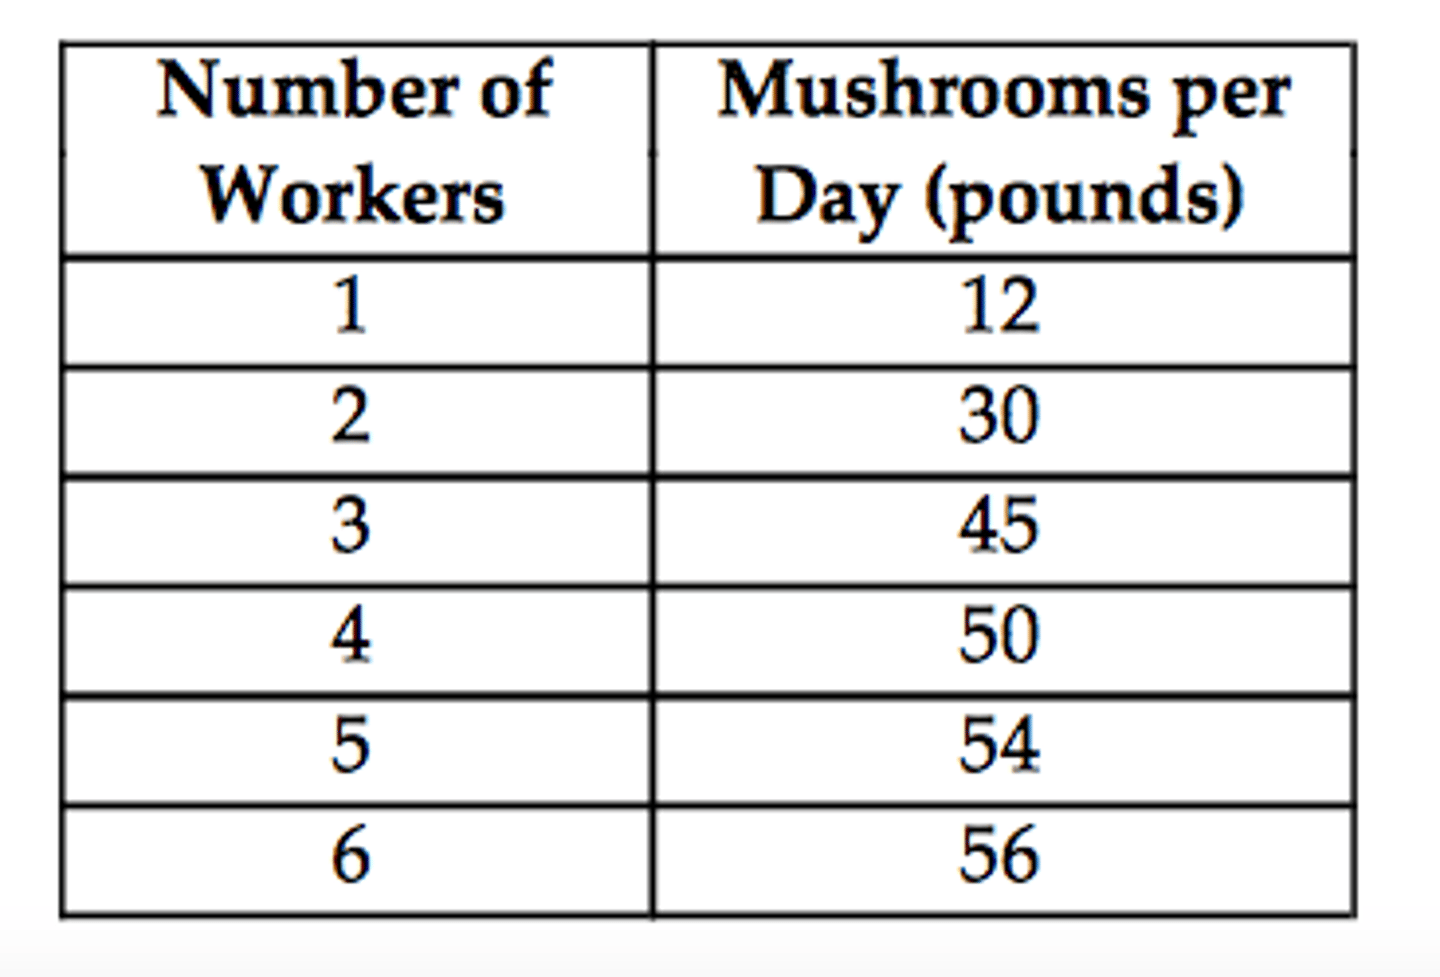
Law of diminishing marginal returns
When one factor of production is increased while others are kept the same, the marginal output of each additional unit begins to fall
Economies of scale on a diagram
As the law of diminishing marginal returns increases short run average costs, Using economies of scale can shift the SRAC curve downwards from SRAC 1 to SRAC 2. As the SRAC keeps shifting downwards, this then means the LRAC curve moves downwards as well. A shift in LRAC would come from external economies of scale.
Fixed costs
Costs which do not change with the level of output e.g rent, pay for non-production staff, price of capital
Variable costs
Costs which changes as the amount of output changes, e.g wages for workers, price of raw materials
The short run
-The time period in which the price of one factor of production is fixed, while others are variable.
-This means that some factors are variable such as the amount of workers in a restaurant, while others are fixed such as the size of the kitchen
-This matters because it can lead to diminishing returns e.g too many workers in the kitchen
The long run
-The time period in which all factors of production are variable
-In the long run, firms can largely change scale
-No diminishing marginal returns from fixed costs
Returns to scale
The relationship between the increases in quantity of a firms inputs and the proportional change in output
Why might a firm choose to maximise revenue?
-Higher output compared with profit maximising, which can lead to higher market share
-Higher levels of output can lead to lower average costs due to economies of scale
-Easier to gauge success with revenue as profit margins can be very slim
-May be a barrier to entry for new firms so less competition