Rates of reaction
1/14
There's no tags or description
Looks like no tags are added yet.
Name | Mastery | Learn | Test | Matching | Spaced | Call with Kai |
|---|
No analytics yet
Send a link to your students to track their progress
15 Terms
Simple collision theory
Particles must collide with enough energy (minimum activation energy - Ea) and in the correct orientation for a reaction to occur.
Increasing concentration (solutions) for rate of reaction
More particles in the same volume.
Particles are closer together.
Collision frequency increases.
More successful collisions per second.
Reaction rate increases.
Increasing pressure (gases) for rate of reactionGas particles are forced into a smaller volume.
Particles are closer together.
Collision frequency increases.
More successful collisions per second.
Reaction rate increases.
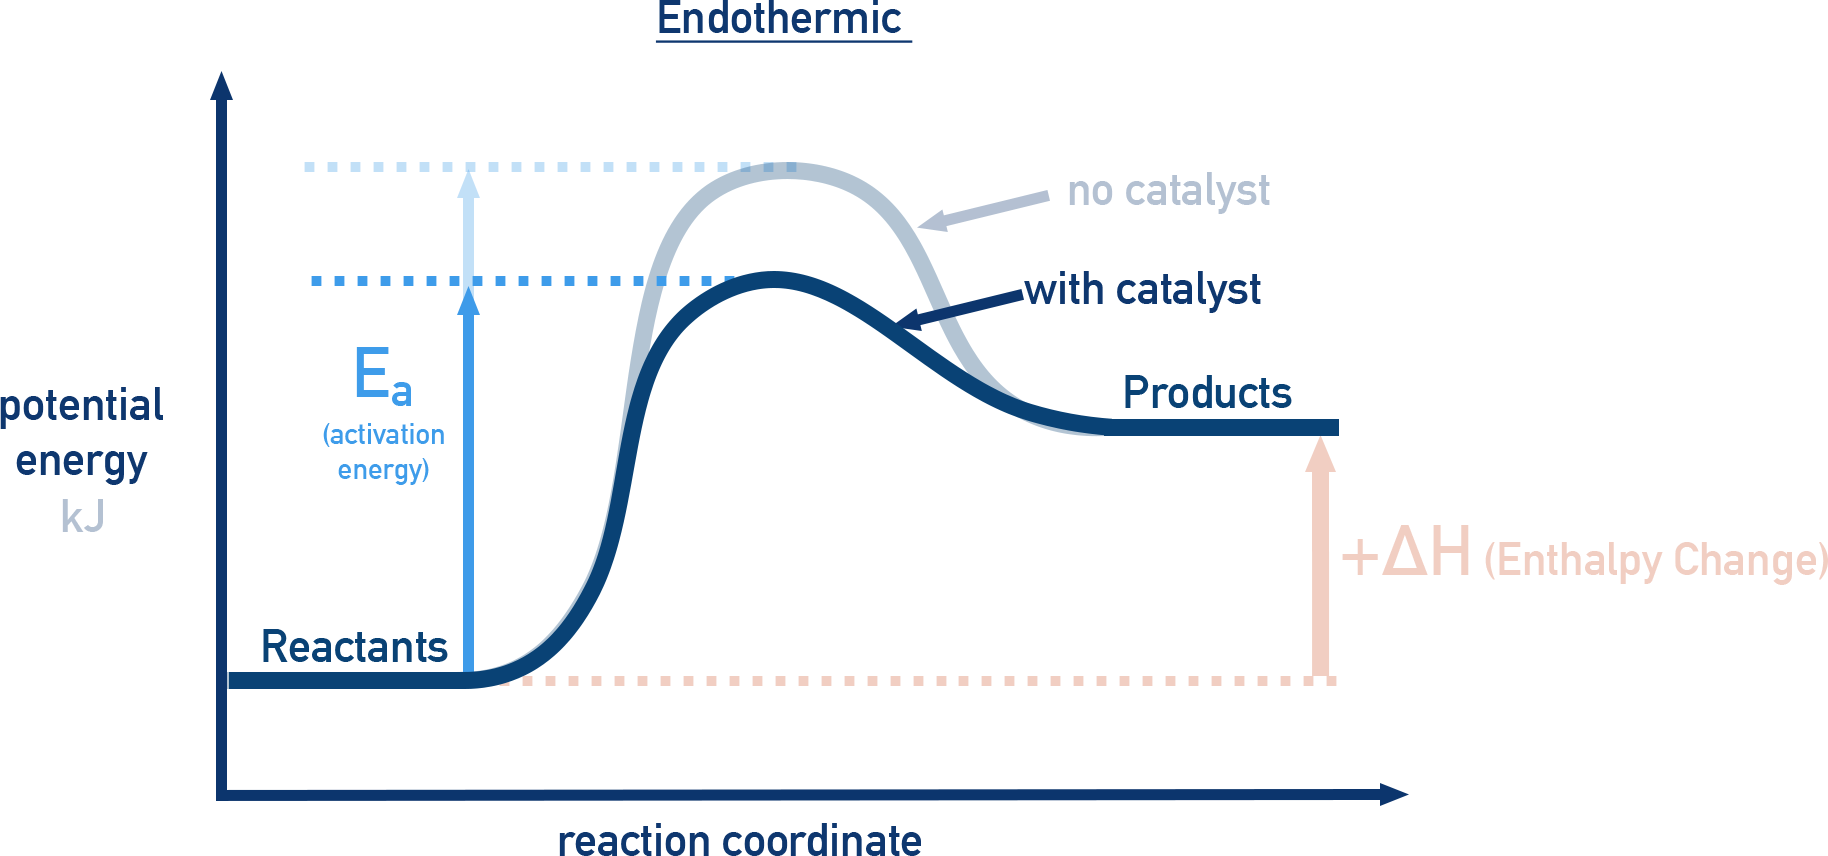
Catalysts
A catalyst increases the rate of a reaction by increasing the number of successful collisions per second.
It is not used up in the overall reaction.
It can be recovered unchanged at the end.
It takes part in intermediate steps but is regenerated later.
A catalyst provides an alternative reaction pathway with a lower activation energy (Ea).
Activation energy is the minimum energy particles need for a successful collision.
Because the activation energy is lower:
A greater proportion of particles have enough energy to react.
More collisions are successful.
The reaction rate increases.
Enthalpy diagrams
Types of catalysts
A homogeneous catalyst is in the same physical state (phase) as the reactants.
A heterogeneous catalyst is in a different physical state (phase) from the reactants
Economic importance of catalysts
Catalysts reduce costs because they:
Increase reaction rates, so more product is made per second.
Allow reactions to run at lower temperatures and pressures.
This reduces energy costs, especially electricity or fuel needed for heating.Economic importance
Sustainability benefits catalysts
Many industrial reactions normally need high temperatures to proceed quickly. Catalysts allow the same reactions to happen at lower temperatures.
This leads to:
Less fuel burned (often fossil fuels)
Lower energy demand
Reduced energy waste
Because less fossil fuel is burned:
Less carbon dioxide is released
Smaller greenhouse gas footprint
Helps reduce climate change impact
Investigation reaction rate, mass change
Method
Reactants are placed on a balance.
The reaction is started (often in a flask on the balance).
The mass is recorded at regular time intervals.
Why mass changes
A gas may be produced and escapes from the flask (e.g. CO₂).
This causes the mass to decrease over time.
What is done with results
Plot mass vs time
Calculate rate from the gradient of the graph
Investigation reaction rate, gas volume
Method
Reaction carried out in a sealed flask connected to a:
gas syringe or
upturned measuring cylinder in water
Gas produced is collected and measured at set time intervals.
What is recorded
Volume of gas (cm³) vs time
Analysis
Plot volume vs time
Steeper curve = faster reaction
Rate = gradient of graph
Investigation reaction rate, dissapearing cross
Method
A reaction produces a cloudy precipitate (solid forms).
A cross is placed under a flask.
Time is measured until the cross can no longer be seen.
What is recorded
Time taken for cloudiness to obscure the cross
Rate calculation
Reaction rate is often taken as:
Rate∝1/time
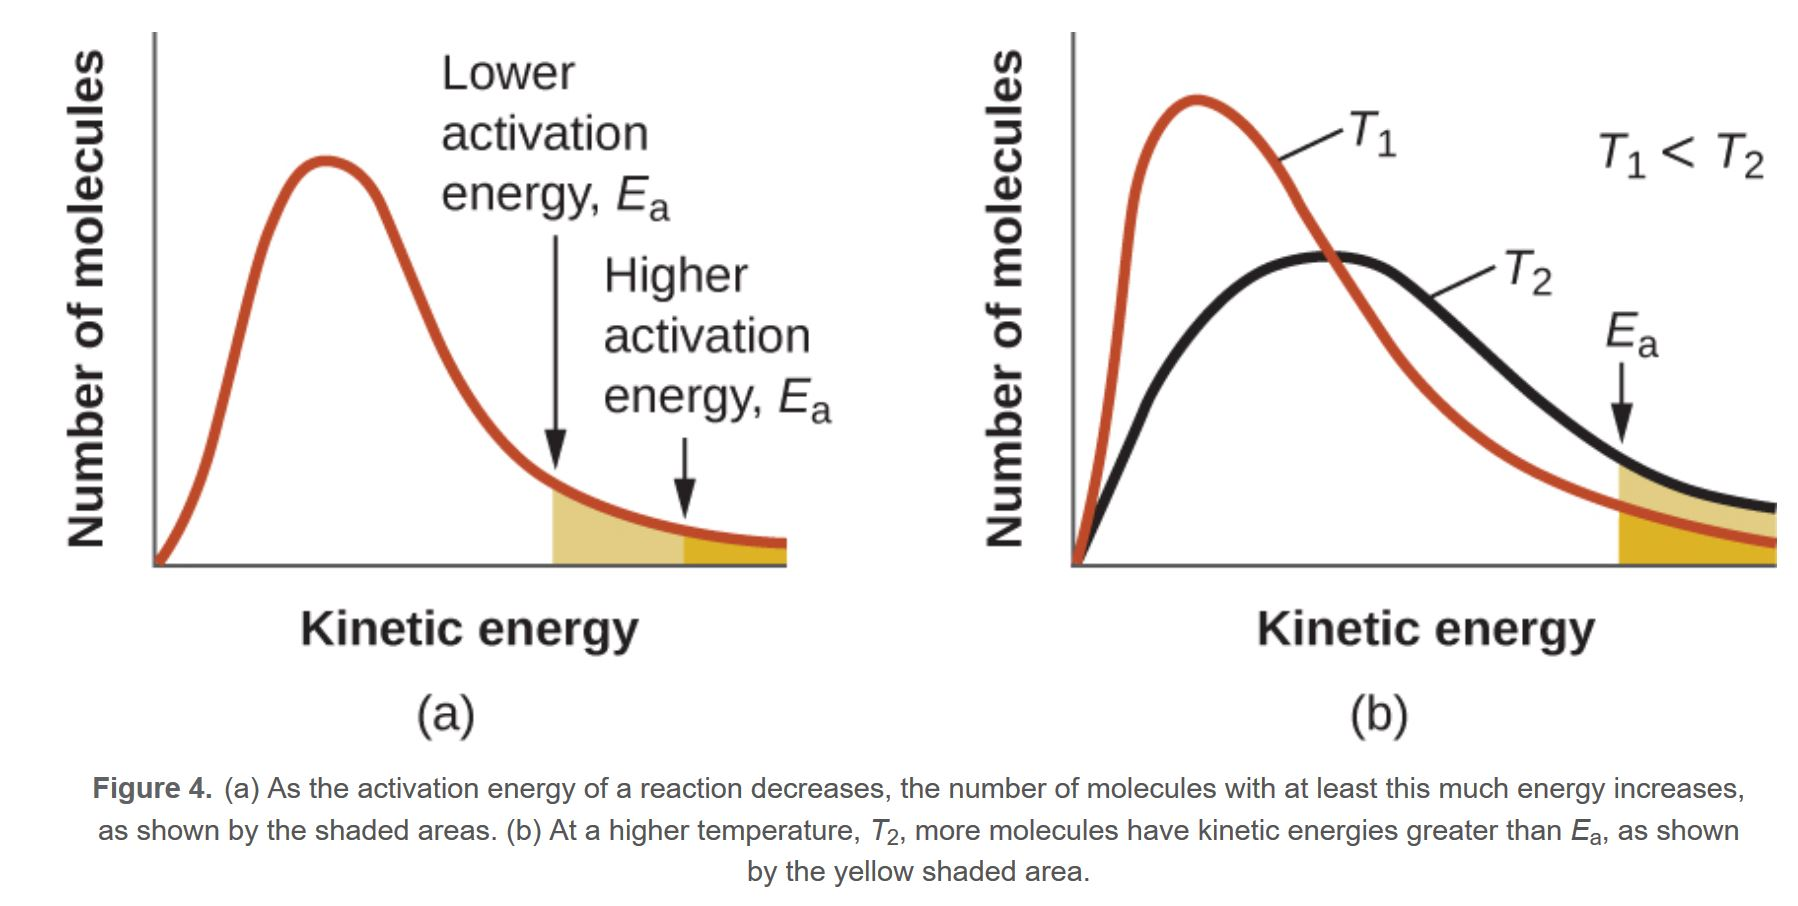
Boltzman distribution curve
The curve shows number of particles vs energy
Particles have a range of energies (Boltzmann distribution)
Most have moderate energy; few have very high or low energy
Only particles with energy ≥ activation energy (Ea) react
Rate depends on proportion of particles above Ea
Boltzmann distributions and reaction rate, temperature
At higher temperature, particles have more kinetic energy overall.
The Boltzmann distribution becomes:
wider and flatter
shifted to the right
A larger proportion of particles have energy ≥ Ea
So the area under the curve beyond Ea increases
More succsesful collisions per second reaction rate increases
Boltzmann distributions and reaction rate, catalyst
A catalyst does not change the Boltzmann distribution
Ea line moves left on the graph
A larger proportion of particles now exceed Ea
More succsessful collisions with particles exceeding minimum activitation energy thus reaction rate increases
Boltzmann distribution diagram catalyst (left) and temperature (right)