Chapter 13, 15, 16 Macroeconomics 1020
1/73
Earn XP
Description and Tags
- Chapters from achieve, for other chapters, look at midterm flashcards
Name | Mastery | Learn | Test | Matching | Spaced | Call with Kai |
|---|
No analytics yet
Send a link to your students to track their progress
74 Terms
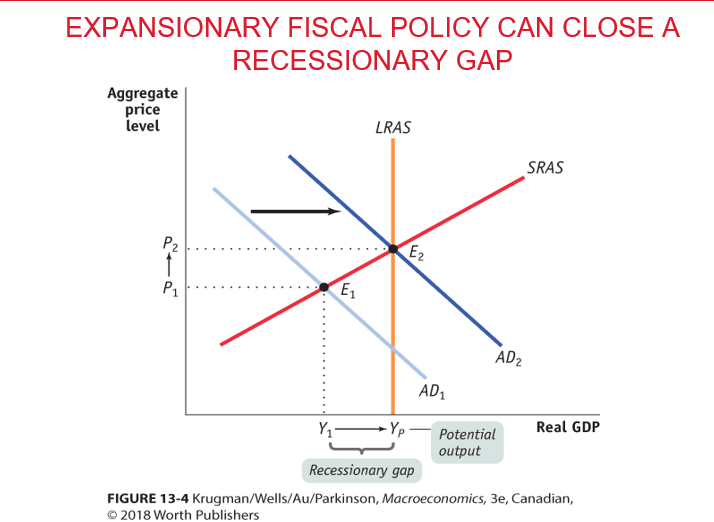
Expansionary fiscal policy
Fiscal policy that increases aggregate demand by increasing government purchases, decreasing taxes, or increasing transfers
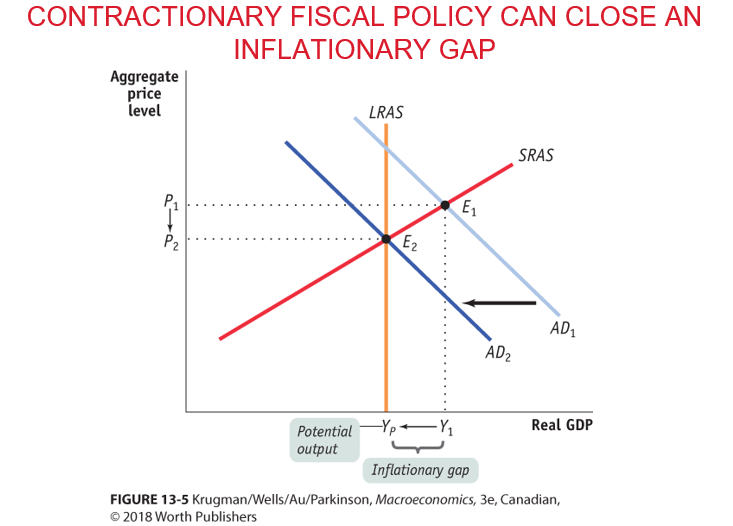
Contractionary fiscal policy
Fiscal policy that decreases aggregate demand by decreasing government purchases, increasing taxes, or decreasing transfers
Crowding out
Crowding out is when government spending reduces private spending.
What are the criticisms of expansionary fiscal policy? Explain each. (3)
• Claim 1: “Government spending always crowds out private spending.”
–True only if economy is at full employment
Increase in G comes at firm’s expense
–Expansionary fiscal policy during recession puts unemployed resources to work
Generates higher income and higher spending
Claim 2: “Government borrowing always crowds out private investment spending.”
– True if only economy is not depressed
– If it is, a fiscal expansion will lead to higher incomes, which lead to increased savings
• Claim 3: “Government budget deficits reduce private spending.”
– Ricardian equivalence
Consumer will cut spendings today for when taxes raise
Can consumers have this much foresight? Probably not
– Even if Ricardian equivalence is true fiscal policy can be effective because consumers will decrease consumption overtime
What are the lags in fiscal policy? (3)
Governments may not immediately recognize a recessionary gap because economic data are slow to collect and analyze (Realize the output gap by collecting data)
The government has to develop a spending plan, which can itself take months, particularly if politicians take time debating how the money should be spent and passing legislation (Develop a plan)
It takes time to implement the plan, as projects like road construction start slowly before major funds are spent (Implement the plan)
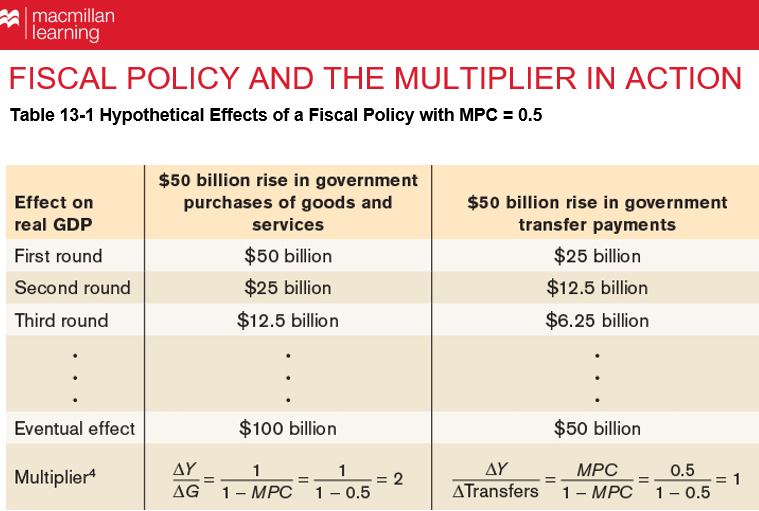
Will a $50 billion tax cut (or increase in transfers) have the same effect as a $50 billion increase in government purchases? Explain using the idea of the multiplier effect.
No
A $50B increase in government purchases is more powerful because the change in government purchases is direct
The change in taxes or transfers is indirect
Who among the population should get tax cuts or increases in government transfers? Explain using the idea of the multiplier effect.
It depends on the multiplier of a specific group
Lump-sum taxes
Taxes that do not depend on the taxpayer’s income
Non-lump-sum taxes
Taxes that depend on the taxpayer’s income
Does adding taxes to the multiplier cause leakage?
Yes. Taxes reduce the size of the multiplier because they take away part of additional income that would otherwise be spent.
In Keynesian economics, taxes are considered a leakage since they lower the marginal propensity to consume (MPC).
Automatic stabilizers
• Features of the economy that automatically smooth out fluctuations without government action
During a recession:
• Tax revenue falls (non–lump sum taxes)
• Transfers like employment insurance and social assistance rise
→ boosts spending (expansionary effect)
During an inflationary gap:
• Tax revenue rises
• Transfer payments fall (e.g., you lose benefits when employed)
→ reduces spending (contractionary effect)
Discretionary fiscal policy
• Discretionary fiscal policy arises from deliberate actions by policy makers> Different impacts (automatic, discretionary)
– Legislation of tax cuts
– Increase on government spending
– Government transfers
Austerity
• Sharp cuts in spending plus tax increase.
Govt would cut off worker but people who did have jobs had to pay higher taxes
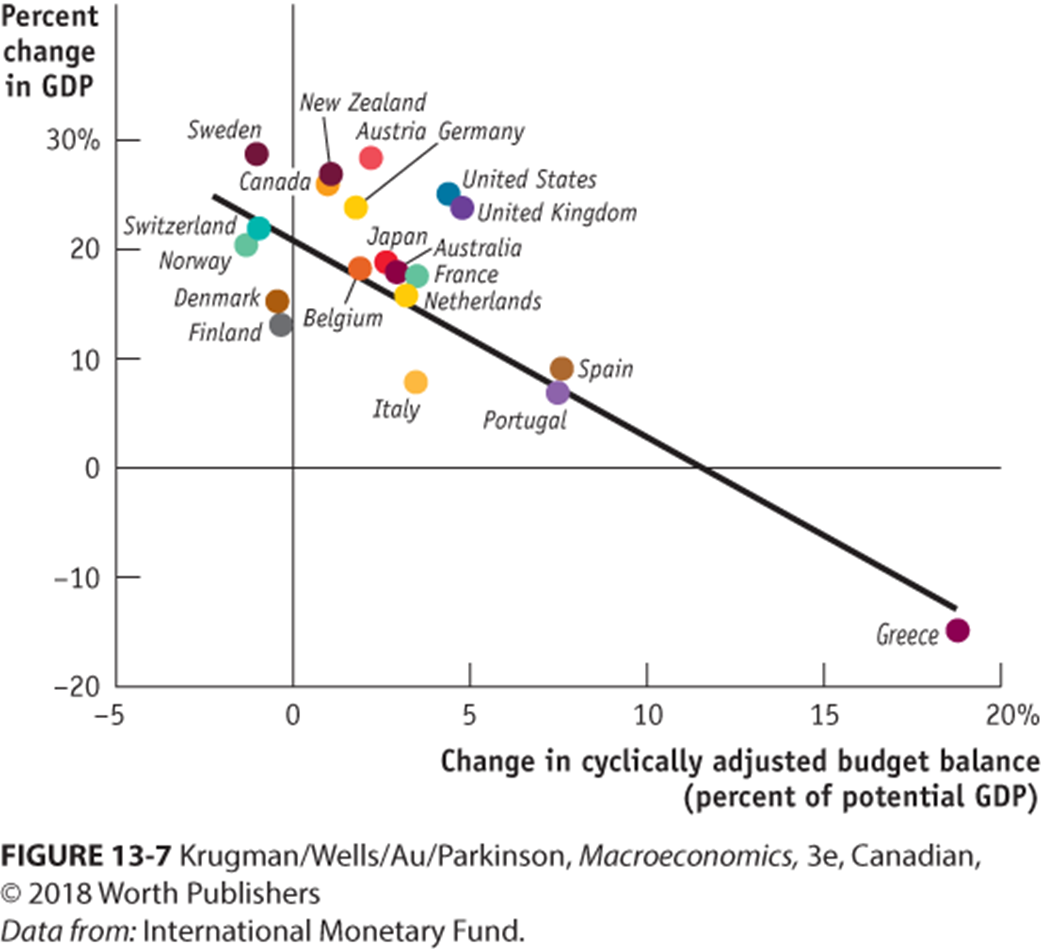
Explain this with the idea of austerity
-Gives correlation between correlation, contraction and GDP
-The slope of fitted line is the multiplier (-1.8 is the slope)
-Average multiplier of 1.8, every dollar that was cut resulted in $1,8 out of the economy
-Stuff government was spending money on suddenly stopped
-Countries on the left had their stuff in order and not in a crises
-The middle countries were most likely of their banks loaning (supply side of loanable fund)
How do surpluses and deficits fit into the analysis of fiscal policy? Are deficits ever a good thing and surpluses a bad thing?
They reflect the stance of fiscal policy: deficits are expansionary (increase demand), while surpluses are contractionary (reduce demand).
Yes. Deficits are useful in recessions to boost the economy, while surpluses can be harmful then. In booms, the opposite is true.
Can we measure fiscal policy directly from budget balance?
Not exactly because we can’t say for sure if there is a deficit, we can’t say if there is a surplus and vice versa
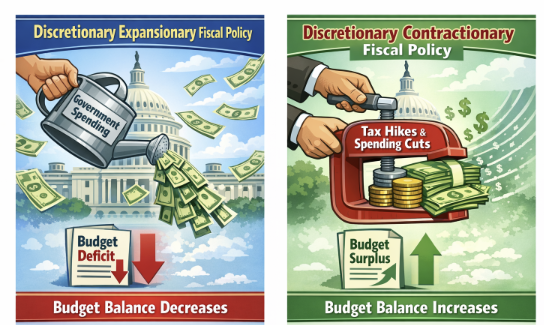
How do discretionary fiscal policies affect the government’s budget balance?
Discretionary expansionary fiscal policies reduce the budget balance for that year.
An increase in government spending (G) lowers the budget balance and can lead to a budget deficit.
Discretionary contractionary fiscal policies increase the budget balance for that year.
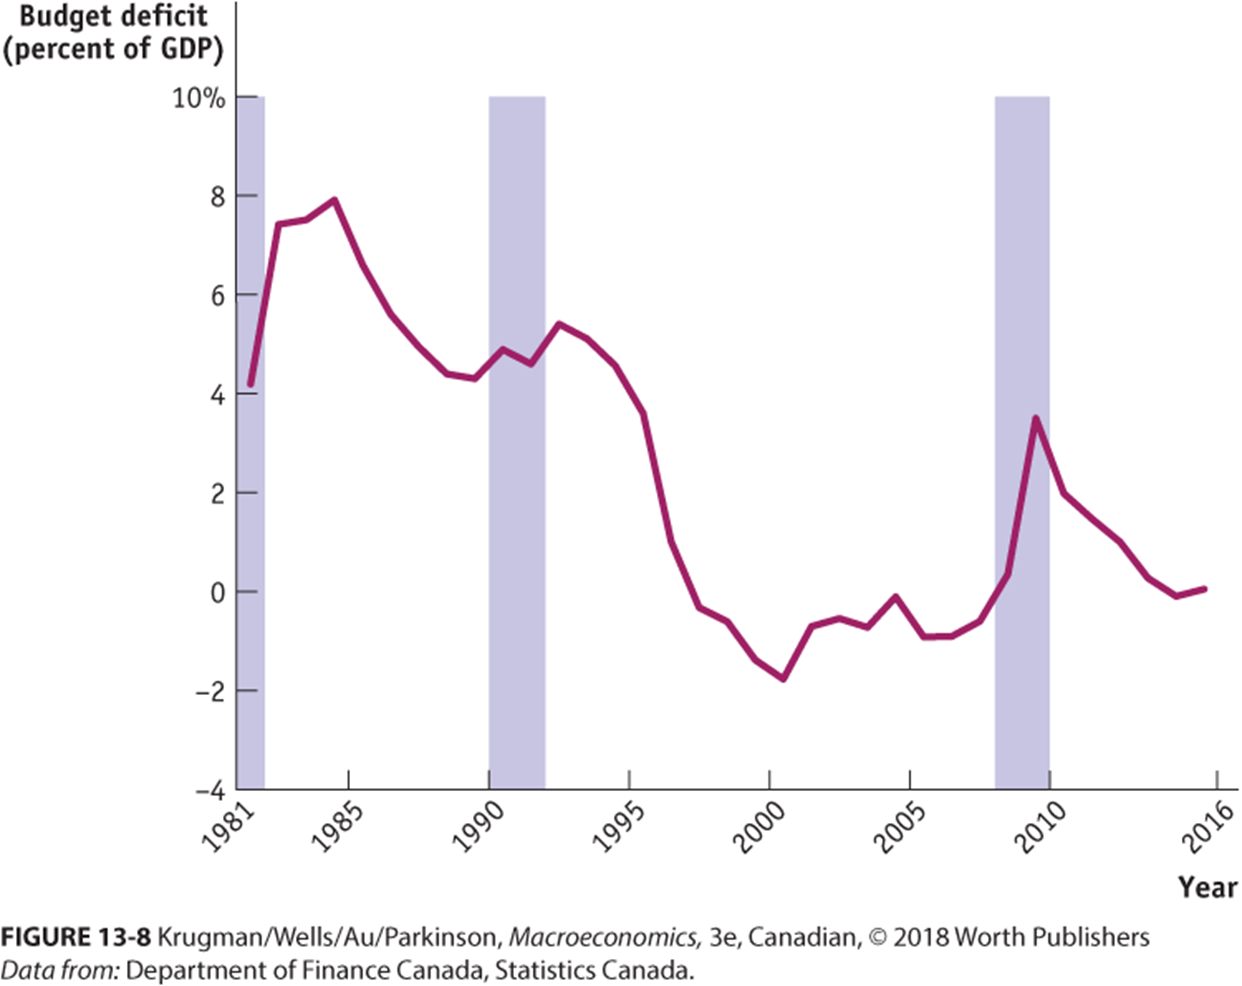
Explain this graph with the ide of budget balance and the business cycle
-Some of the fluctuations in the budget balance comes from the business cycle
-Budget moves to deficit when economy experiences recession
-Shaded area is recession
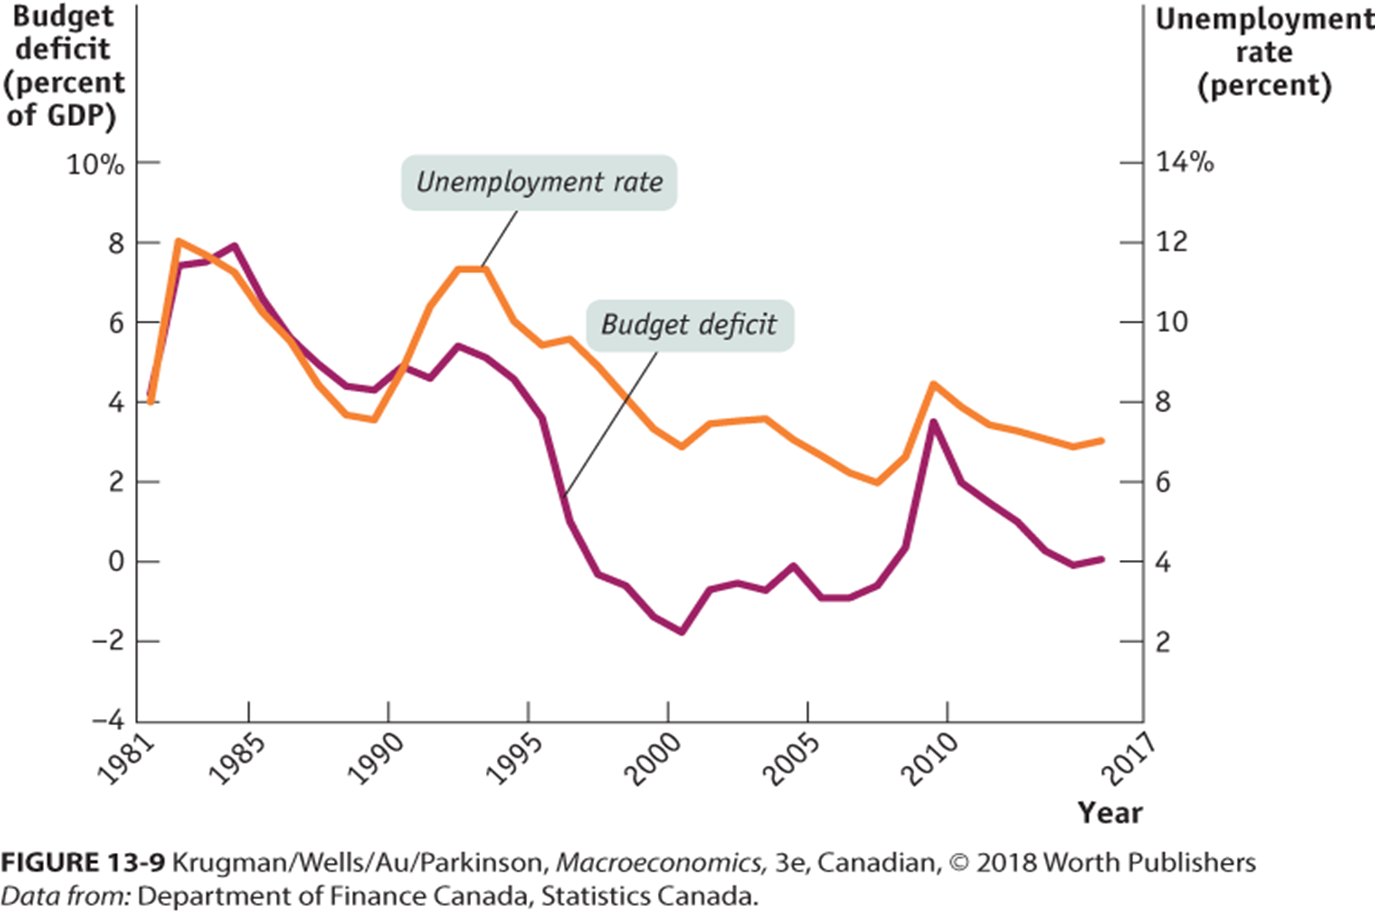
When does the budget deficit rise? Explain using the idea of budget balance and unemployment
Budget deficit always rises when unemployment rate rises and vice versa
Cyclically adjusted budget balance
An estimate of what the government’s budget balance (deficit or surplus) would be if the economy were operating at its potential output (i.e., no boom or recession).
It removes the effects of the business cycle, so things like temporarily low tax revenue during a recession or unusually high revenue during a boom don’t distort the picture
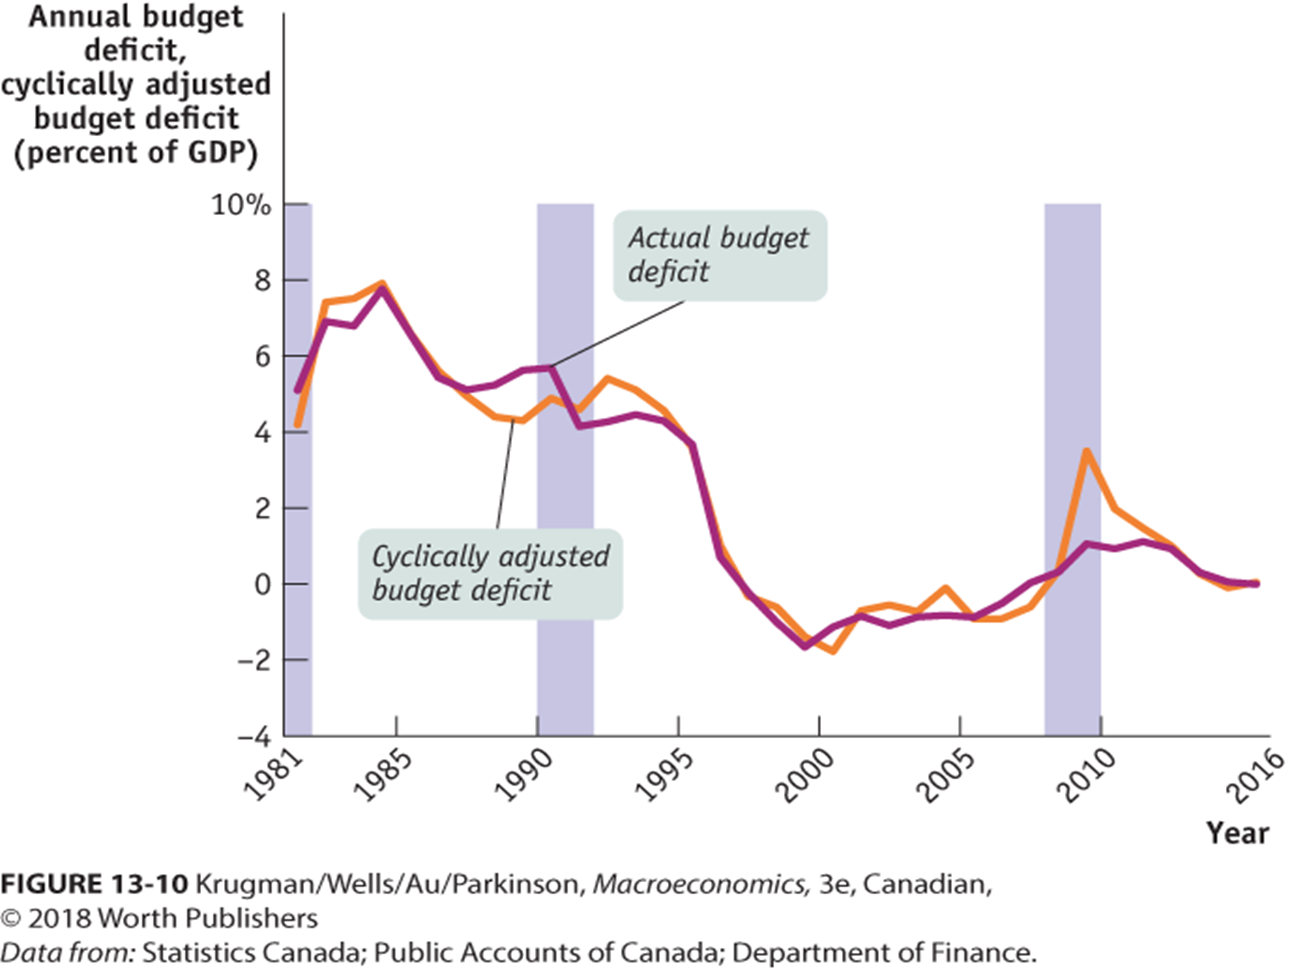
What does the graph comparing the actual budget deficit and the cyclically adjusted budget deficit show?
It shows how Canada’s actual budget deficit changes with the business cycle, while the cyclically adjusted budget deficit removes the effects of recessions and booms.
Actual deficit rises in recessions because revenue falls and spending rises.
Cyclically adjusted deficit stays smoother, showing the government’s underlying fiscal stance
Should the budget be balanced every year? Why or why not?
No. Balancing the budget every year would weaken automatic stabilizers.
In a recession, taxes fall and transfers rise, creating a deficit.
Forcing a balanced budget would remove these stabilizers.
But persistent deficits can cause problems, so the budget should be balanced on average, not every year.
What is the difference between deficits and debts?
• A deficit is the difference between what government spends and its tax revenue over a given period.
• A debt is the sum of money a government owes at a particular time. Debt can be from current deficit or past deficit.
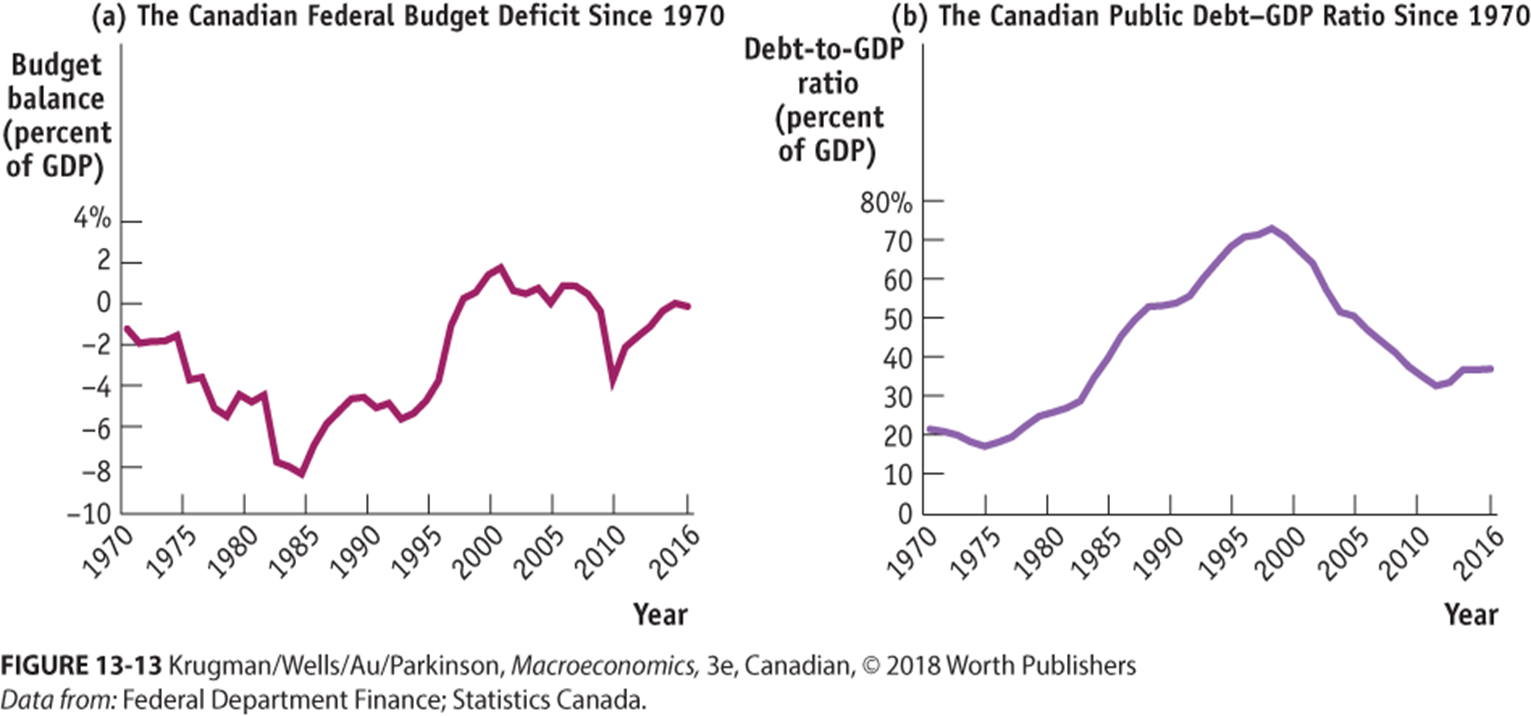
What do the graphs of Canada’s budget deficit and debt‑to‑GDP ratio since 1970 show?
They show how long periods of budget deficits cause the debt‑to‑GDP ratio to rise, and how surpluses in the late 1990s reduced it.
The budget balance is below zero most years → persistent deficits.
Debt‑to‑GDP climbs to a peak in the mid‑1990s.
Surpluses in the late 1990s–early 2000s lower the debt ratio.
Later deficits slow the decline.
What is the long‑run implication of persistent budget deficits?
Persistent budget deficits have long‑run consequences because they lead to an increase in public debt.
Potential Dangers Posed by Rising Government Debt (2)
•1. Crowding out
occurs when increased government spending, funded by borrowing, leads to higher interest rates, reducing private sector investment and consumption
•2. Financial pressure and default (Extreme outcome of persistent deficits)
–A heavily indebted government has large interest payments
–In response to that, they will have to increase taxes or borrow more (until they become to much). Once these aren’t an option anymore, you have to follow fiscal austerity — cutting spending.
Can’t a government that has trouble borrowing just print money to pay its bills?
Yes but this is a problem
By printing more money, inflation is created
Implicit liabilities
Debts government must pay at a futured date
Does current deficit include implicit liabilities?
No
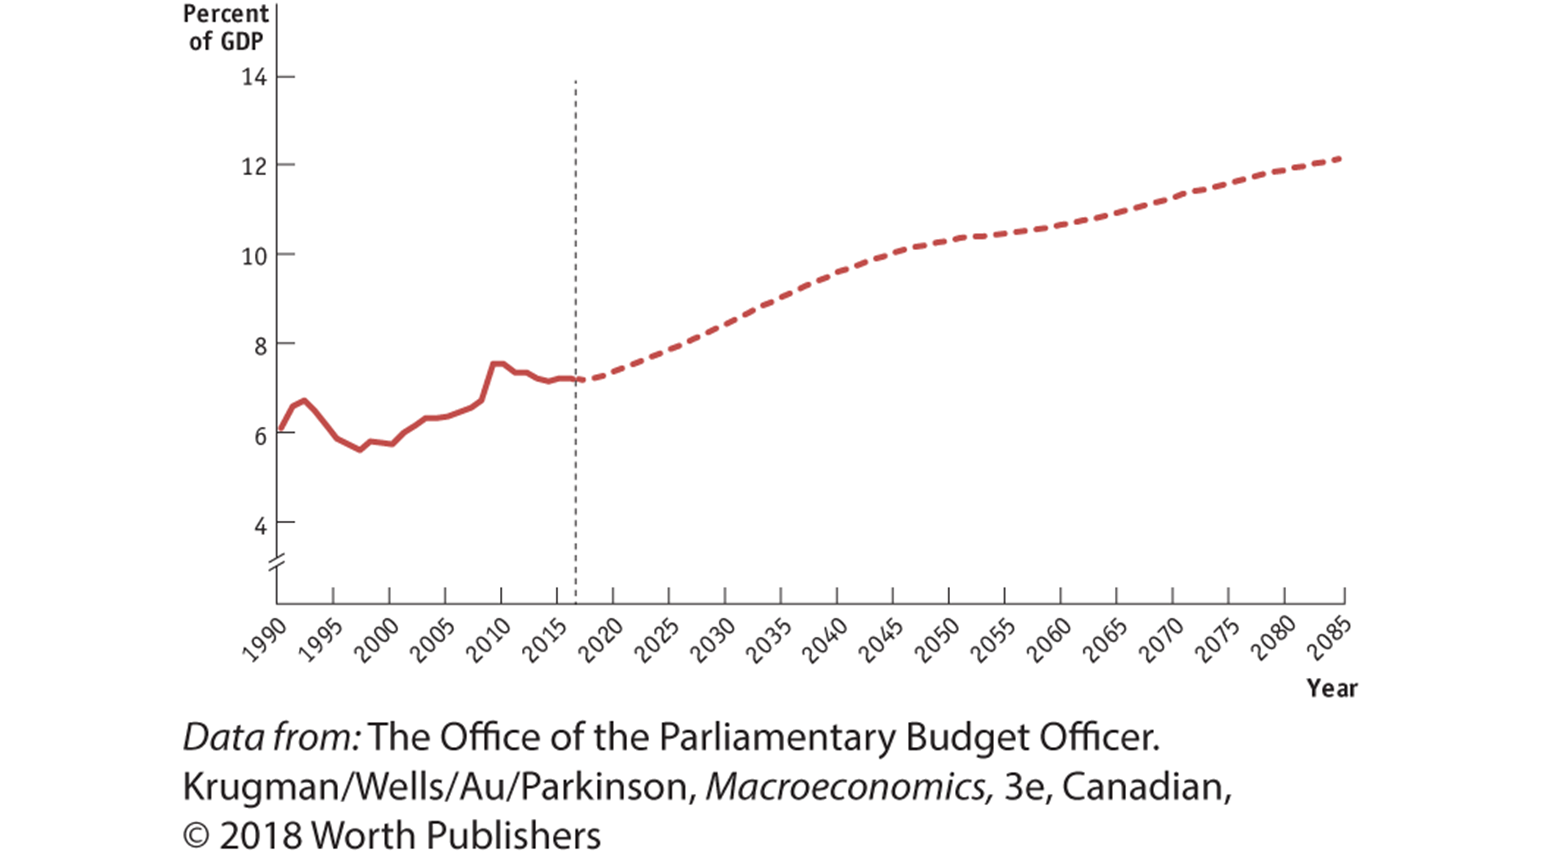
What does the graph illustrate about implicit liabilities?
It shows that implicit liabilities are future government obligations that rise over time and increase fiscal pressure, even though they don’t appear as current debt.
Historical costs are stable, but projected costs rise sharply.
These future commitments push spending to over 12% of GDP by 2085.
Suggested measures aiming at curbing implicit liabilities (4)
– 1. Increasing immigration to increase labor force growth
– 2. Use funds more efficiently
– 3. Reforming funding models
– 4. Raise taxes
Non-monetary assets
Assets that are not made up of money, nor function as money
Examples: Land and buildings
Short-term interest rates
The interest rates on financial assets that mature within six months or less.
Long-term interest rates
The interest rates on financial assets that mature a number of years in the future
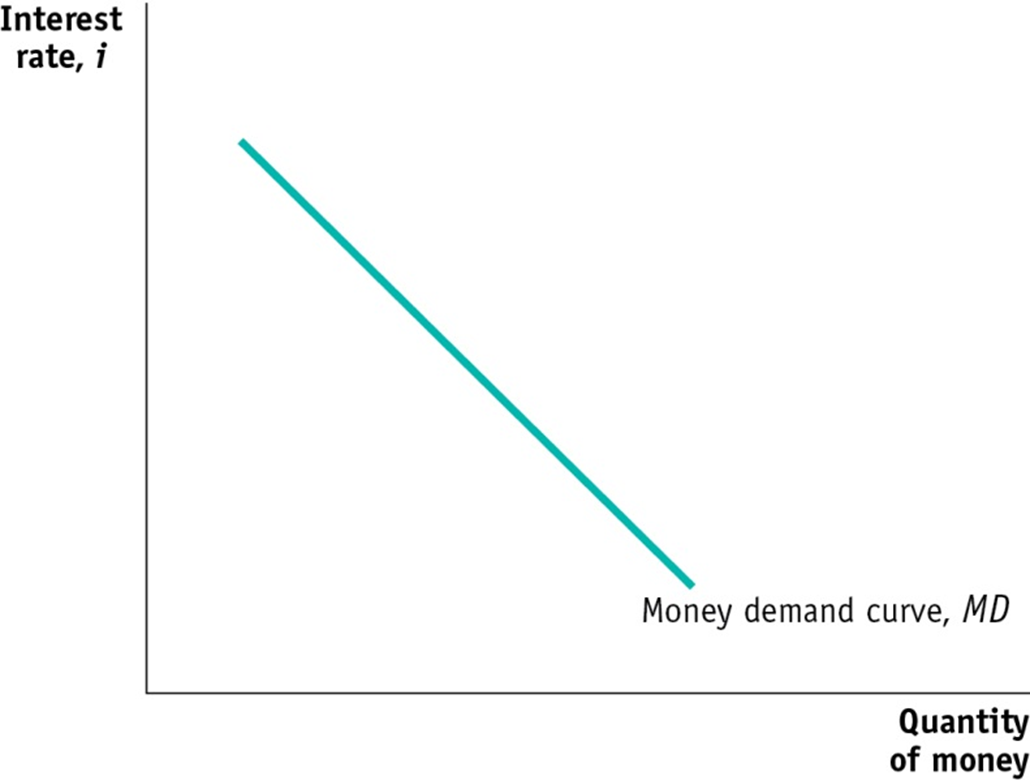
What does the money demand curve show, and why does it slope downward?
The money demand curve illustrates the relationship between the interest rate and the quantity of money demanded.
It slopes downward: a higher interest rate leads to a higher opportunity cost of holding money and reduces the quantity of money demanded.
Correspondingly, a lower interest rate reduces the opportunity cost of holding money and increases the quantity of money demanded.
What are some reasons for shifts of the money demand curve?
•Changes in aggregate price level
•Changes in real GDP
•Changes in credit markets and banking technology
•Changes in institutions
Which way does the demand curve shift when there is an decrease in money demand? Which way does the demand curve shift when there is an increase in money demand?
Decrease shifts left
Increase shifts right
Liquidity Preference Model
A model of the market for money in which the interest rates are determined by the supply and demand for money, with people preferring to hold liquid cash rather than illiquid assets
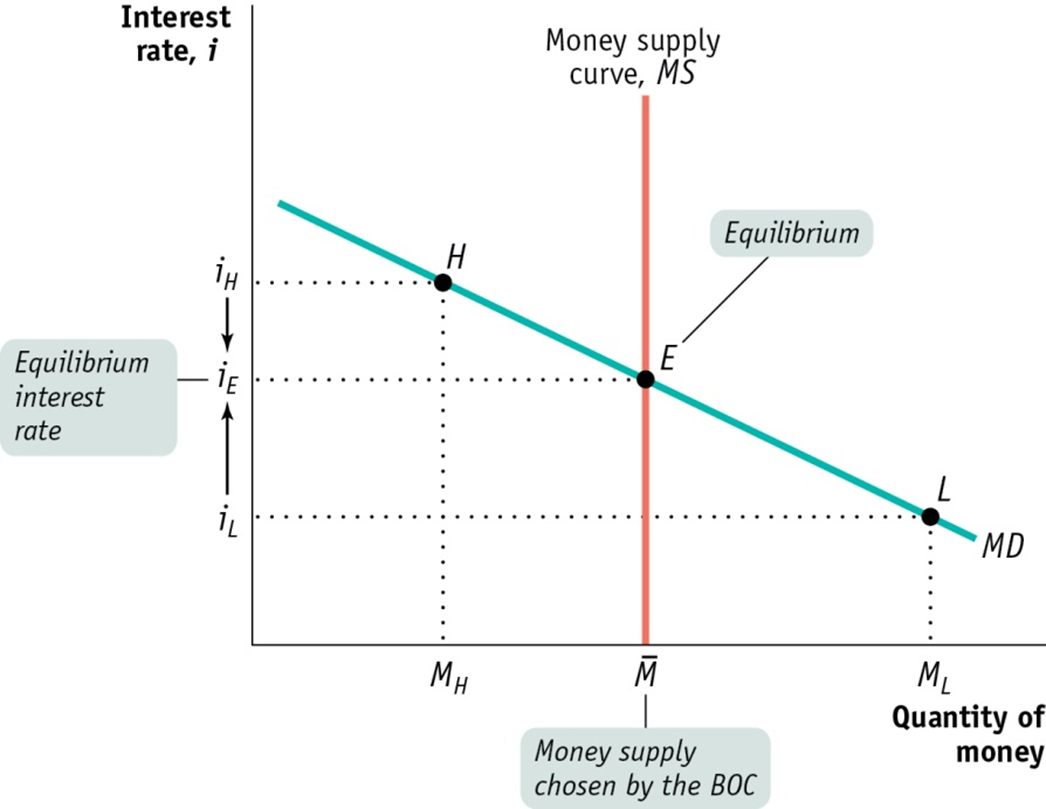
What does the money market graph show about the relationship between the interest rate, the quantity of money, and the equilibrium in the money market?
Money Market Graph
Axes:
Quantity of money (horizontal)
Interest rate (vertical)
Money Supply:
Vertical MS line at (\bar{M}) (chosen by the BOC)
Money Demand:
Downward‑sloping MD curve through points H, E, L
Equilibrium:
Intersection at E gives the equilibrium interest rate (i_E)
Adjustment:
If interest rate is too low → rises toward (i_E)
If too high → falls toward (i_E)
What does the Liquidity Preference Model explain about the short-term interest rate?
The Liquidity Preference Model explains that the short-term interest rate is determined by the supply and demand for money.
The money supply is set by the central bank.
Money demand depends on income and the interest rate.
The equilibrium interest rate occurs where money supply equals money demand.
How does the Bank of Canada implement monetary policy to move the interest rate and affect aggregate output?
The Bank of Canada changes the target overnight interest rate by adjusting the money supply.
Lower money supply → interest rate rises → investment & spending fall → AD shifts left → output falls.
Higher money supply → interest rate falls → investment & spending rise → AD shifts right → output rises.
Changes in interest rates work through four channels: other interest rates, asset prices, exchange rate, and expectations, which together change aggregate demand and real GDPThe Bank of Canada can use expansionary monetary policy to increase aggregate demand and contractionary monetary policy to reduce aggregate demand. The Bank of Canada and other central banks generally try to tame the business cycle while keeping the inflation rate low but positive
Why is monetary policy the main tool for stabilizing economic conditions in a market economy?
Because monetary policy is fast, flexible, and effective at influencing aggregate demand.
Central banks can adjust interest rates quickly and frequently.
Interest rate changes affect spending through multiple channels (borrowing costs, asset prices, exchange rates, expectations).
These channels rapidly influence investment, consumption, and net exports, shifting aggregate demand.
Monetary policy is run by an independent central bank, making it more stable and less political than fiscal policy.
Expansionary monetary policy
Expansionary monetary policy uses lower interest rates to increase aggregate demand and output.
Contractionary monetary
Contractionary monetary policy uses higher interest rates to reduce aggregate demand and output.
What is monetary neutrality in the long run?
Monetary neutrality means that changes in the money supply affect only the price level in the long run — not real GDP or the real interest rate.
So monetary policy has no real long‑run effect on output, making it ineffective for long‑run economic growth, even though it matters in the short run.
Why the Bank of Canada pursues inflation targeting and how does it use monetary policy to achieve the inflation target?
The Bank of Canada uses inflation targeting to keep inflation low, stable, and predictable while stabilizing output.
It announces an inflation target and sets policy to hit it (forward‑looking rule).
It adjusts interest rates to influence spending and aggregate demand.
Monetary policy is preferred because it has shorter implementation lags than fiscal policy.
When interest rates are near zero, monetary policy becomes less effective (zero lower bound).
Hyperinflation
Inflation exceeding 50% per month. At this rate, prices can double in a few days
Inflation tax
Inflation tax is the reduction in the real value (purchasing power) of money due to inflation.
Why can printing money lead to higher rates of inflation and hyperinflation?
Because printing money acts like an inflation tax and creates a self‑reinforcing cycle.
More money printed → value of money falls → inflation rises
People hold less real money (M/P)
Government gets less revenue from printing
Prints even more to compensate
Leads to rapid price increases and eventually hyperinflation
Short run Phillips curve
A graphical representation of the negative short-run relationship between the unemployment rate and the inflation rate
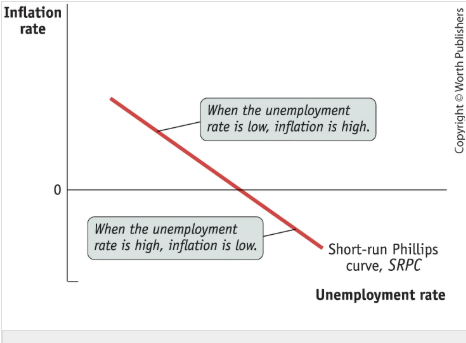
How does the Phillips Curve describe the short‑run trade‑off between inflation and unemployment?
The short‑run Phillips Curve shows a negative relationship between inflation and unemployment.
When aggregate demand rises, output moves above potential → firms hire more → unemployment falls → wages and prices rise → inflation increases.
When aggregate demand falls, output drops below potential → firms cut jobs → unemployment rises → wage and price growth slows → inflation decreases.
This trade‑off exists because low unemployment increases wage pressure, and high unemployment reduces it.
The SRPC is downward‑sloping: low unemployment = high inflation; high unemployment = low inflation.
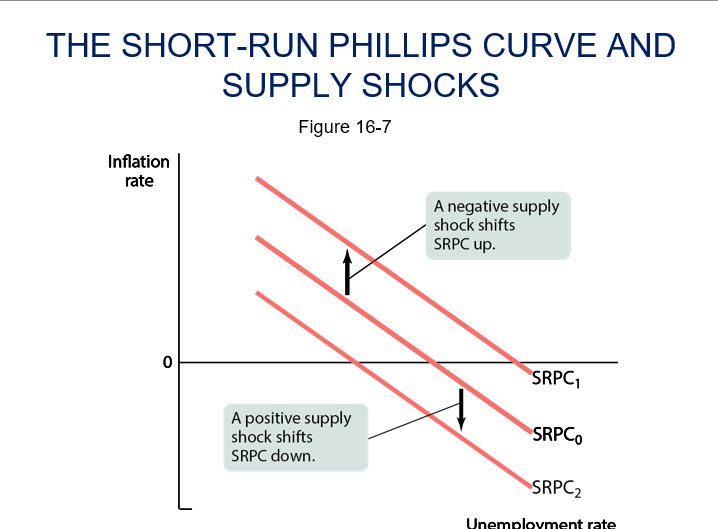
What can shift the short-run Phillips curve?
•Supply shocks
–A negative supply shock shifts SRPC up as the inflation rate increases for every level of the unemployment rate.
–A positive supply shock shifts it down as the inflation rate falls for every level of the unemployment rate.
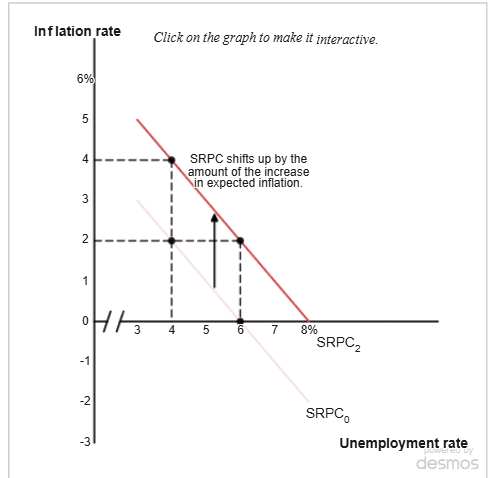
•The expected inflation rate
–It’s the rate of inflation that employers and workers expect in the near future.
–The expected inflation rate is the most important factor, other than the unemployment rate, affecting inflation.
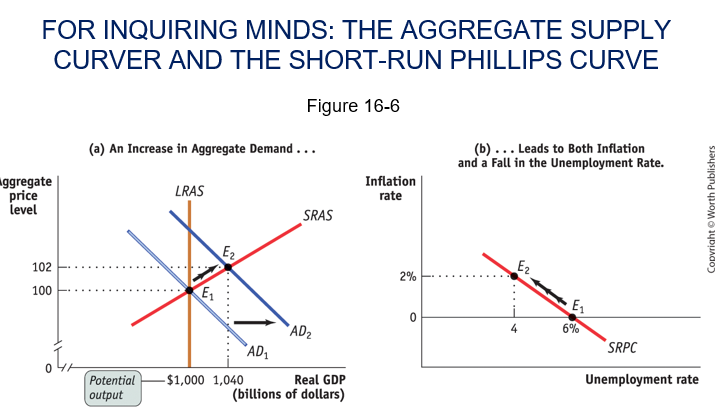
In the short run, what does the Short‑Run Phillips Curve (SRPC) show when aggregate demand increases?
The SRPC shows that in the short run, higher aggregate demand raises inflation and lowers unemployment.
AD–AS graph: AD shifts right → price level rises and real GDP rises above potential → positive output gap.
The output gap reduces unemployment (Okun’s law).
SRPC graph: The economy moves up along the Short‑Run Phillips Curve from E₁ to E₂ — higher inflation, lower unemployment.
Panel (a): if AD increases, a 4% output gap is associated with 2% inflation.
Panel (b): an output gap of 4% reduces the unemployment rate by
4% × 0.5 = 2%, and the inflation rate is 2%.
What does the Short‑Run Phillips Curve (SRPC) say about the trade‑off between unemployment and inflation?
he SRPC says that at any given point in time, there is a short‑run trade‑off between unemployment and inflation.
Lower unemployment → higher inflation
Higher unemployment → lower inflation
This happens because tight labor markets raise wage growth and price pressures, while slack labor markets reduce them.
The long-run Phillips curve (LRPC)
The relationship between unemployment and inflation after expectations of inflation have had time to adjust to experience
What does an attempt to reduce unemployment lead to?
Accelerating inflation
How can accelerating inflation be avoided over time?
To avoid accelerating inflation over time, the unemployment rate must be high enough that the actual rate of inflation matches the expected rate of inflation
The natural rate hypothesis
The relationship between accelerating inflation and the unemployment rate
The nonaccelerating inflation rate of unemployment (NAIRU)
The unemployment rate at which inflation does not change over time
Why is the Long‑Run Phillips Curve (LRPC) vertical, and what does it show about unemployment and inflation in the long run?
The LRPC is vertical because in the long run there is no trade‑off between unemployment and inflation.
It shows the long‑run relationship after inflation expectations adjust.
The curve is vertical at the NAIRU (natural rate of unemployment).
Any unemployment rate below the NAIRU causes ever‑accelerating inflation.
Because accelerating inflation is unsustainable, unemployment cannot stay below the NAIRU in the long run.
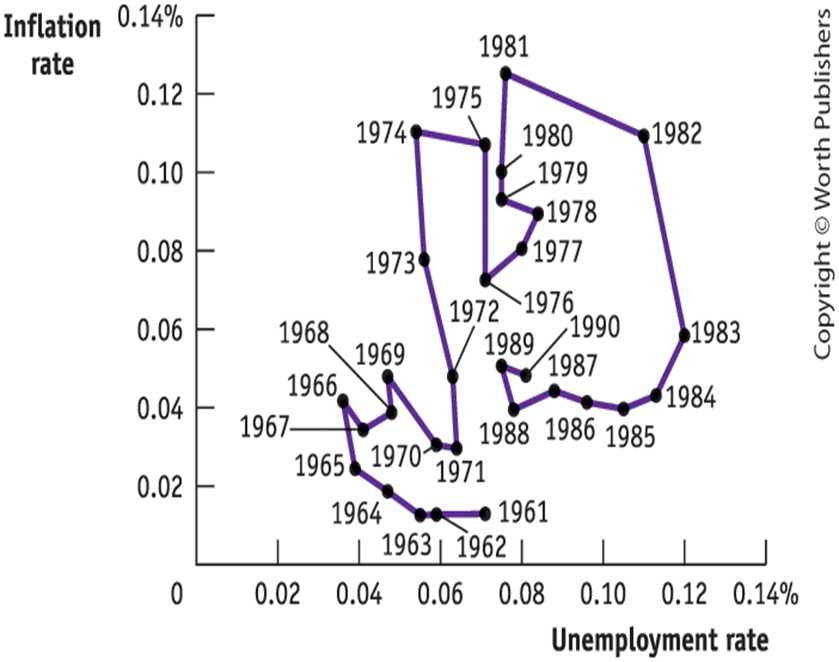
What does the Canadian data from 1961–1990 show about the Phillips Curve relationship between unemployment and inflation?
The historical data shows that the Phillips Curve relationship broke down after the 1960s.
In the 1950s–60s, Canada showed the expected trade‑off: low unemployment ↔ high inflation.
In the 1970s–early 1980s, negative supply shocks and higher‑than‑expected inflation caused high unemployment and high inflation at the same time (stagflation).
In the late 1980s–1990s, both inflation and unemployment fell, showing no stable trade‑off.
This demonstrates that the Phillips Curve does not hold in the long run.
How do inflation expectations shift the short‑run Phillips curve (SRPC)?
Higher expected inflation shifts the entire SRPC upward.
Workers and firms build expected inflation into wages and prices.
If expected inflation rises from 0% → 2% → 4%, the SRPC shifts from SRPC₀ → SRPC₂ → SRPC₄.
Actual inflation = expected inflation when unemployment is at the NAIRU.
Expectations are the mechanism that links today’s inflation to tomorrow’s inflation.
Disinflation
The process of bringing down inflation that is embedded in expectations.
Why does changing expected inflation make the long‑run Phillips curve vertical?
Because expected inflation adjusts, any attempt to keep unemployment below the NAIRU causes accelerating inflation. In the long run, expectations fully adjust and unemployment returns to the NAIRU regardless of inflation, making the long-run Phillips curve vertical.
Policymakers can temporarily lower unemployment, but inflation rises above expectations.
Expectations then rise → SRPC shifts up → inflation accelerates.
This process continues until unemployment returns to the NAIRU.
Result: No long‑run trade‑off between inflation and unemployment → LRPC is vertical.
How do inflation expectations determine the cost of disinflation?
The more inflation is built into expectations, the more unemployment is needed to reduce it.
High expected inflation (e.g., 1980s) → painful disinflation with deep recessions.
Anchored expectations (e.g., 2021–2022) → inflation falls with smaller output and unemployment costs.
Disinflation = forcing actual inflation below expected inflation until expectations fall.
Expectations determine how hard it is to bring inflation down.
How do expectations of deflation affect interest rates and monetary policy?
Expected deflation pushes nominal interest rates toward zero and can cause a liquidity trap.
Expected deflation → lower nominal interest rates (Fisher effect).
Rates can’t fall much below zero → zero lower bound.
At zero, monetary policy becomes ineffective → liquidity trap.
Deflation expectations also raise the real burden of debt → debt deflation → lower spending → deeper slumps.
Why is deflation dangerous for the economy?
Deflation poses several problems because it raises the real burden of debt and can trigger debt deflation.
Falling prices increase the real value of outstanding debt.
Borrowers cut spending sharply; lenders don’t increase spending enough.
This process — debt deflation — intensifies an economic downturn by reducing aggregate demand.
Historically linked to severe recessions (Great Depression, Japan).
Why is deflation difficult to reverse once it starts?
Deflation becomes self‑reinforcing because expectations adjust downward.
If people expect falling prices, they delay spending, reducing demand further.
Firms cut prices and wages → deeper slump → more deflation.
Expectations get “stuck,” anchoring the economy in a low‑inflation, low‑demand equilibrium.
This makes reversing deflation slow, costly, and difficult.
How does deflation lead to the zero lower bound and a liquidity trap?
Deflation makes nominal interest rates more likely to hit the zero lower bound, pushing the economy into a liquidity trap.
Deflation lowers nominal interest rates, making it more likely they hit the zero lower bound (around 0%). At this point, monetary policy becomes ineffective because rates cannot fall further. This can lead to a liquidity trap, where people hold money instead of spending or investing, so demand remains weak.
Zero lower bound
Means interest rates are already so low (close to zero) that the central bank can’t lower them further to boost the economy, so its usual tool doesn’t work well anymore.
Liquidity trap
A situation where conventional monetary policy becomes ineffective because nominal interest rates are at or near zero, causing people to hold onto their cash rather than invest or spend
When can a liquidity trap occur?
A liquidity trap can occur whenever there is a sharp reduction in demand for loanable funds.
Deflation
A falling aggregate price level
Debt deflation
The reduction in aggregate demand arising from the increase in the real burden of outstanding debt caused by deflation