BIO 286 Mathematical Information
1/36
Earn XP
Description and Tags
Mathematical information
Name | Mastery | Learn | Test | Matching | Spaced | Call with Kai |
|---|
No analytics yet
Send a link to your students to track their progress
37 Terms
Little to no heritability looks like:
randomly distributed points across a graph, where x is parent trait value vs. y as offspring trait value
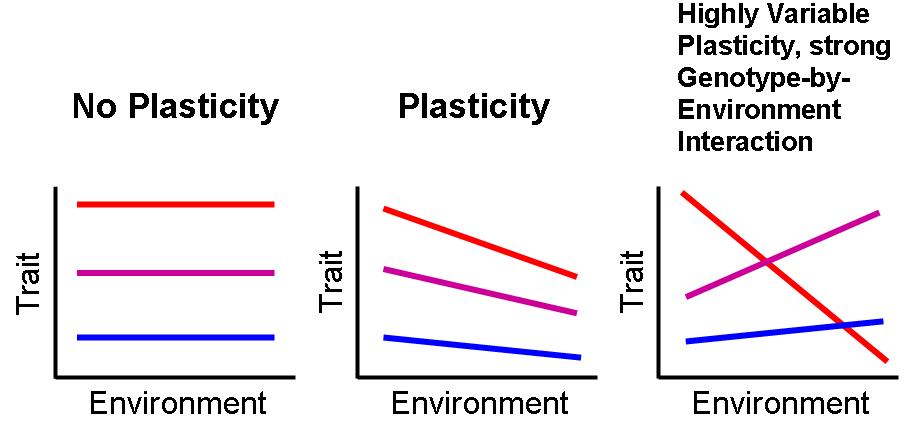
Phenotypic plasticity charts: IS plastic
Phenotypic values plotted across different environments, where each line is 1 genotype. Low plasticity is indicated by a small slope, and high plasticity is indicated by a large slope.
How to find frequency of heterozygotes in population
Use Punnett square idea: if AA = p², aa = q², and Aa = pq, 2pq is the frequency of heterozygotes in population
Selection differential equation
S = (avg trait value of breeders in population) - (avg trait value in whole population)
Aka. S = mu_s - mu
Response to selection equation
R = (heritability coeff)*S
aka. predicts how phenotypic trait changes over time
Absolute fitness equation
AF = # of individuals of each genotype after selection / # of individuals of each genotype before selection
Relative Fitness equation
RF = each absolute fitness value / highest absolute fitness value
Selection coefficient equation
s = 1 - fitness
Is the % of individuals of that genotype selected against
Effective population size
number of breeding individuals in idealized population
Censused population
size of population that has actually been counted
Harmonic mean equation
(1/Ne) = 1/t * sum of (1/Ni)
Altruism equation
(coefficient of relationship)*(how many additional offspring produced due to altruism) - cost > 0
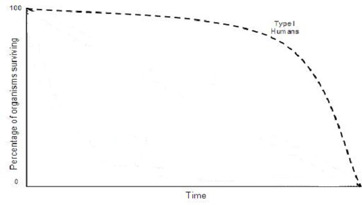
Survivorship curve type 1
Low initial mortality, many mammals
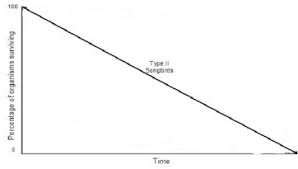
Survivorship curve type 2
relatively constant, most birds
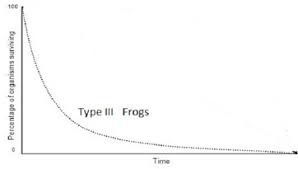
Survivorship curve type 3
high initial mortality
n_x value (life table)
number alive at start of study
x value (life table)
age
lx value (life table)
Surviving proportion as fraction of all newborns in original cohort
lx = # at beginning of cohort / # at start
d_x value (life table)
the number dying at each age interval
d_x = n_x - n_x+1
b_x value (life table)
number of offspring born per individual in age class
b_x = number of offspring produced by individual in age class/# alive in age class
L_x value (life table)
Mean # of individuals alive between age class x and x + 1
L_x = (n_x + n_x+1)/2
T_x value (life table)
age classes remaining for individual alive in age class
T_x = sum of L_x
e_x value (life table)
life expectancy of individuals alive at age x
T_x/n_x
R_0 value
net reproductive rate
R_0 = sum of l_x*b_x
If it’s equal to 1: population size is stable
If it’s greater than 1: population size is increasing
If it’s less than 1: population size is decreasing
r value
Intrinsic rate of increase - per capita growth rate
r = ln(R_0)/(T_c) = b - d
b = per capita birth rate
d = per capita death rate
T_c = sum of (x*L_x*b_x)/R_0
Exponential growth equation for overlapping generations with no resource limitations
dN/dt = rN
Applies if no resource limitations and no gene flow (immigration and emigration equal)
Exponential Growth for future generations
Nt = N_0*e^(rt)
Maximum recruitment rate (dN/dt)
is at K/2
Logistic growth equation that accounts for carrying capacity
dN/dt = rN* (K-N)/K
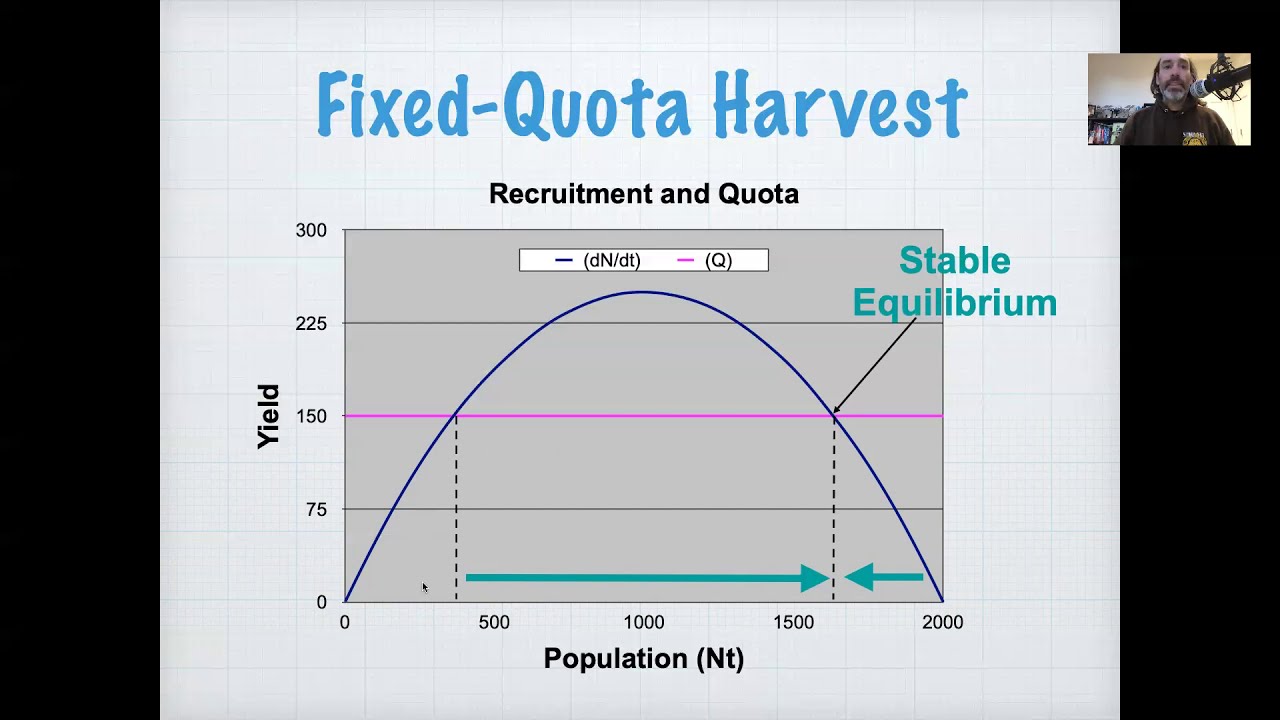
Fixed quota graph
If N is too low, fixed quota drives prey extinct
If N is high enough, population stabilizes at a size below K
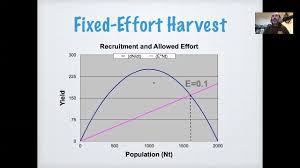
Fixed effort graph
Yield decreases with lower prey densities
Low slope = low effort
Steep slope = high effort
Stable where harvest rate = recruitment rate
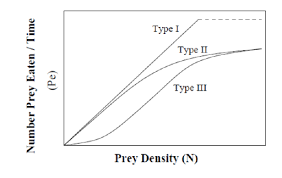
Type I functional response
consumption rates increase with increasing prey density

Type II functional response
easy to find prey, initially eaten in proportion to density, but handling time/digestion cause plateau

Type III functional response
Difficult to find prey at low density. As density increases, predator efficiency to detect prey increases, but handling time eventually causes plateau
Ingestion efficiency equation
energy available / energy ingested
Assimilation efficiency
energy assimilated / energy ingested
Production efficiency equation
energy in new tissue / energy assimilated