Dynamic Electrochemistry
1/76
There's no tags or description
Looks like no tags are added yet.
Name | Mastery | Learn | Test | Matching | Spaced | Call with Kai |
|---|
No analytics yet
Send a link to your students to track their progress
77 Terms
Give the Nernst Equation
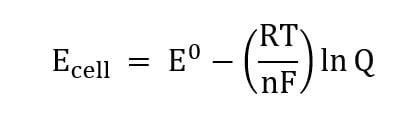
Or
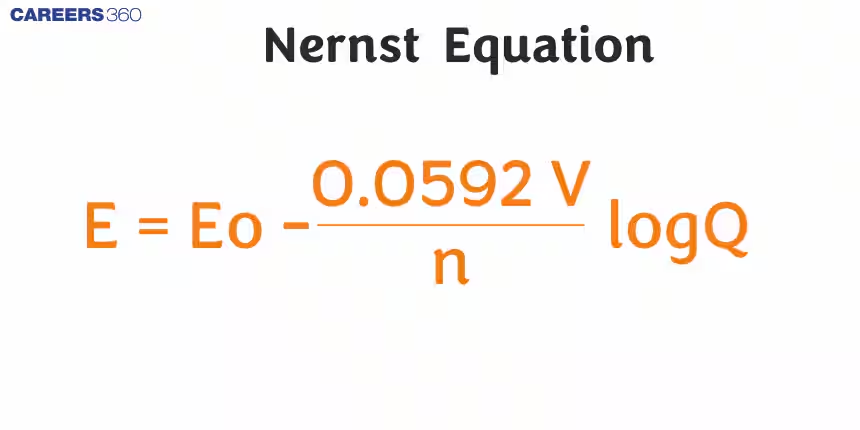
(by combining constants at rt)
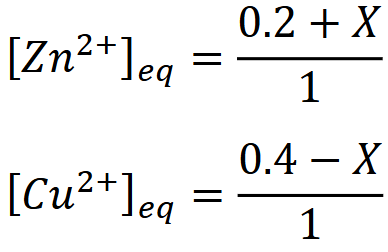
Use equations to describe the concentrations of aqueous species in this system at equilibrium:
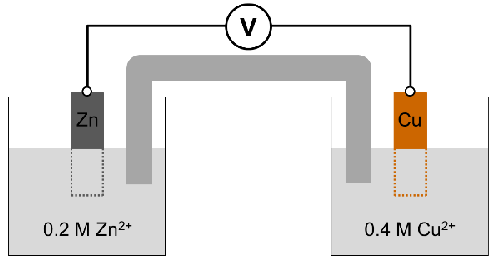
(volume of both solutions is 1L)
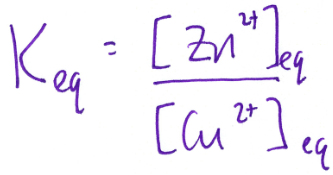
Give the equation for Keq for this system:
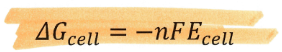
Give the equation for ΔGcell
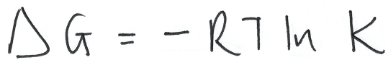
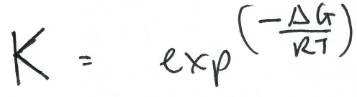
Give the relationship between ΔG and k
Calculate ΔGcell for a system with an Ecell of 4V.
(assume 1 electron transfer system)
Subsequently, calculate k for this system.
ΔGcell = - 1 × 96485 × 4V = - 385,940 Jmol-1
k = 4.48 × 1067 at room temperature
What is the conversion for amps to Cs-1?
1 A = 1Cs-1
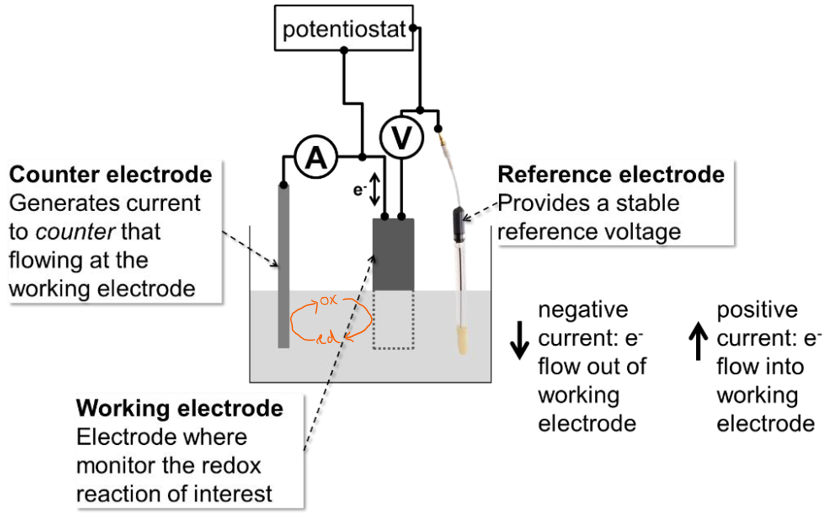
Label the features of this 3-electrode cell
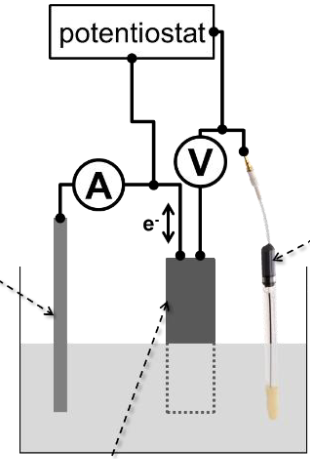
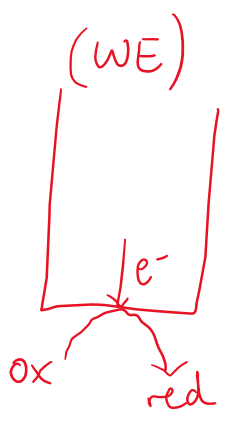
What does a negative current mean?
Electrons are flowing out of the working electrode
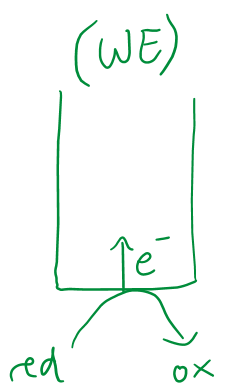
What does a positive current mean?
Electrons are flowing into the working electrode
Draw a diagram to represent negative current.
Draw a diagram to represent positive current.
What does a positive faradaic current indicate?
An oxidation reaction is occuring
What does a negative faradaic current indicate?
An reduction reaction is occuring
What is a non-faradaic current?
When the current thats occuring is due to a non-redox reaction.
What are the conditions for a standard hydrogen electrode (SHE)?
pH = 0, 1 bar H2, Pt electrocatalyst
Give the redox equation for a Ag/AgCl reference electrode.
Using this, give the Nernst equation for when concentrations vary from standard concentrations.
AgCl(S) + e- ⇌ Ag(s) Cl-(aq)
Q = [aq products]/[aq reactants], so in this system Q = [Cl-]
Giving: Ecell = E0 - (RT/F)ln[Cl-]
(standard concentrations = 1M so this applies when [Cl-] ≠ 1)
What is the purpose of a counter electrode?
By acting as a source or sink for electrons, it balances the chemical reactions at the working electrode and ensures electrical neutrality without disturbing the measurement.
Essentially, it prevents the ratio of oxidised/reduced species from changing as the current flows. Eg. each time an oxidation reaction occurs at the reference electrode, a reduction occurs at the counter electrode.
What are the requirements of the electrolyte?
The electolyte must contain enough ions (have sufficiently high ionic conductivity) to transfer a current without solution resistance from impacting the experimental results.
What are the typical electrolytes in 1) aqueous and 2) organic systems?
1) commonly NaCl
2) tetrabutylammonium hexafluorophosphate
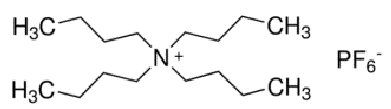
However, sometimes there is enough H+ present in acidic systems that no additional ions are needed.
What is chronoamperometry?
Measuring current as a function of time while a constant voltage is applied.
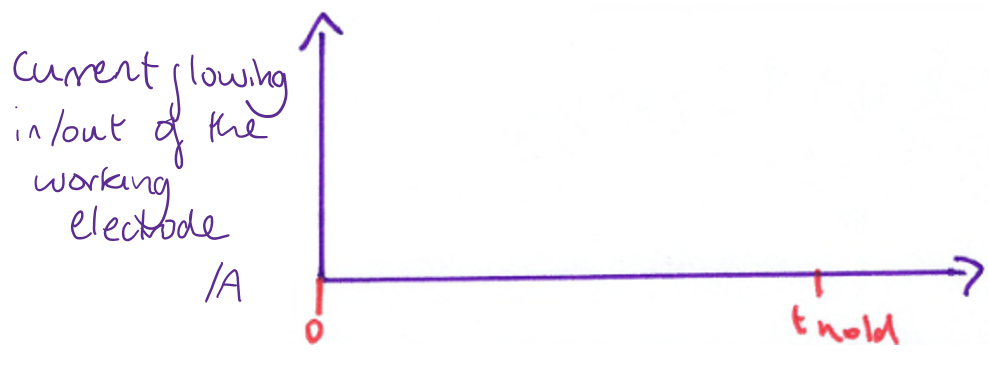
Draw a Control and Measurement graph for a chronoamperometry experiment.
Control:
Plotting the potential of the working electrode over time. Applied voltage is constant (Eapp) so:
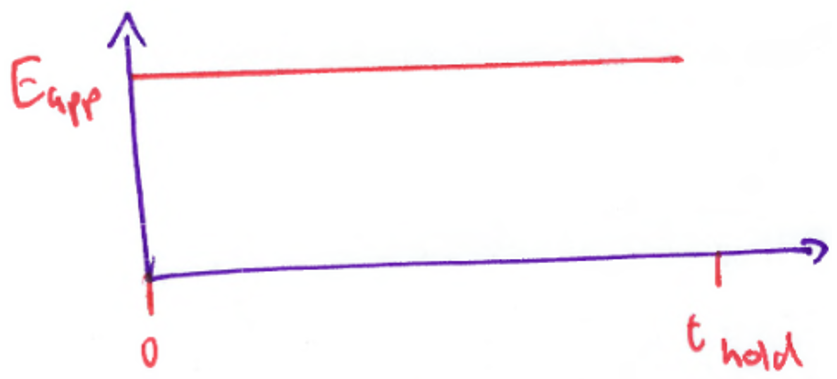
Measurement:
You then measure the current flowing in/out of the working electrode over the same time. Note that no line is shown here but an observed current change will be seen in reality.
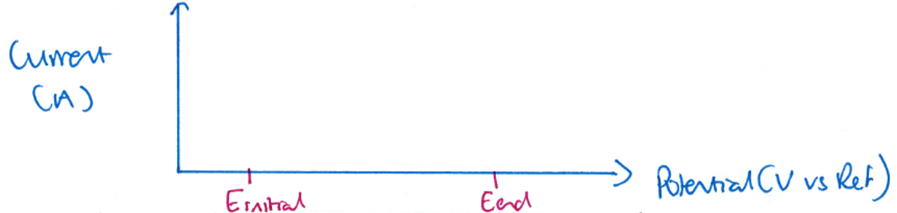
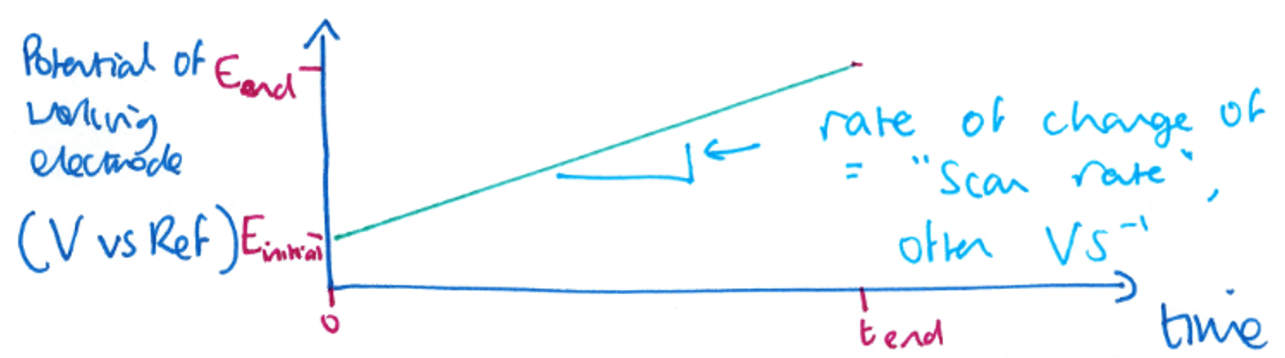
Define voltammetry.
Give the axes of a voltammogram.
Measuring current while changing the applied voltage as a function of time.

A voltammogram plots current vs voltage:
What is the scan rate?
The rate of change of the applied voltage:

What is an anodic scan direction?
A positive change in applied voltage over time:
What is a cathodic scan direction?
A negative change in applied voltage over time.
Imagine the line below goes downwards:

Plot the voltage over time for a linear sweep voltammogram of -0.5 V to +0.5 V vs Ag/AgCl at 100 mVs-1.
What scan direction is this?
1 V range, 100 mVs-1 → 10 second scan.
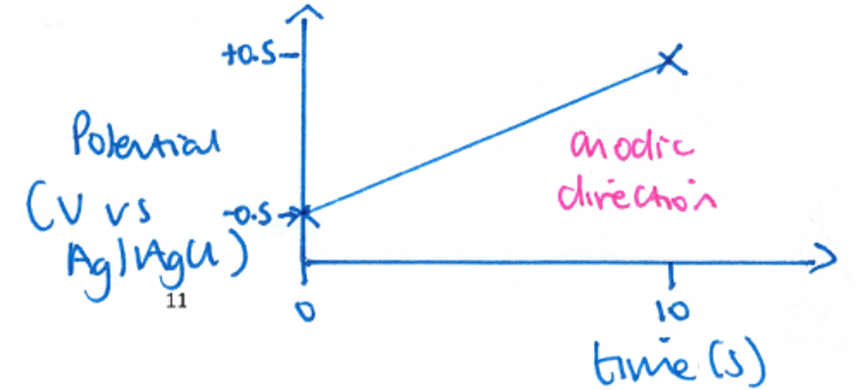
Positive scan direction so anodic scan (scanning the oxidising direction).
What is cyclic voltammetry?
Draw an example plot.
Measuring the current while changing the voltage in both positive and negative ways (forward and back voltage sweep to give both positive and negative gradient)
A repeated voltage cycle is called a scan or sweep.
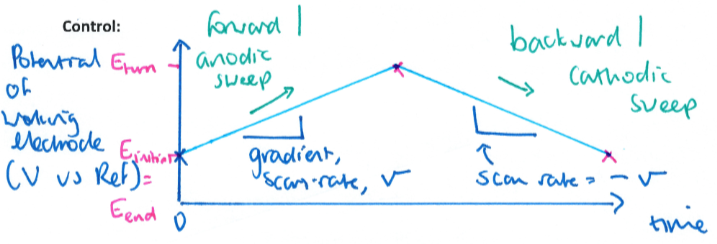
(Positive and negative scan rates are equal and opposite)
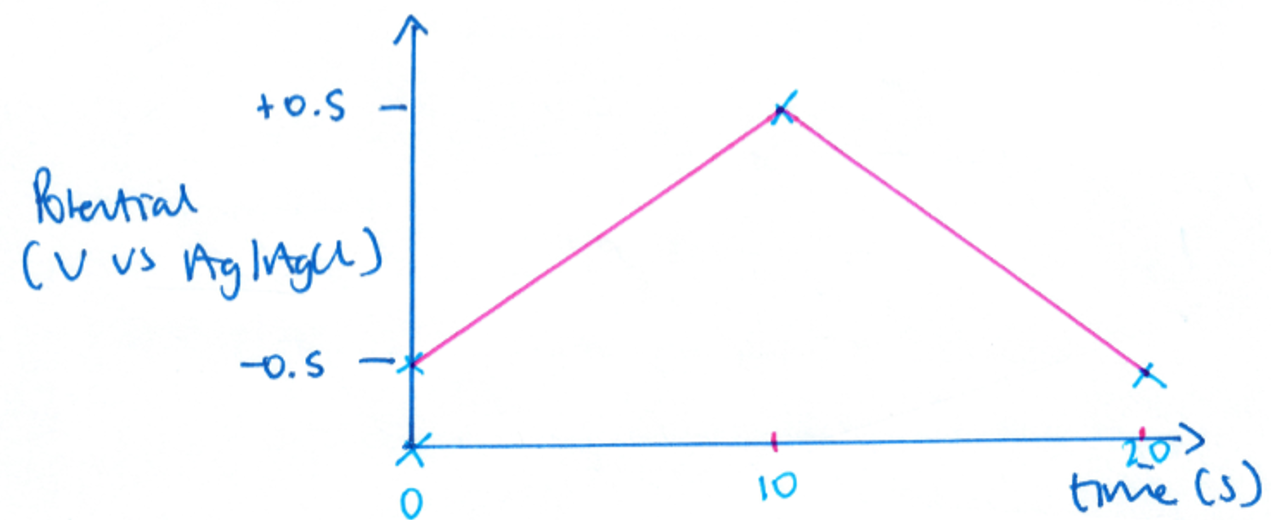
Plot the voltage over time for a cyclic sweep voltammogram of -0.5 V to +0.5 V vs Ag/AgCl at 100 mVs-1.
1 V potential range at 100 mVs-1 → 10s to go one direction, 10s back to start of cycle.
Explain why a baseline current reponse is seen in voltammetry even without the presence of redox active species.
A baseline current is observed (aka non-faradaic current) because of rearrangements that occur at the working electrode surface. (double layer rearrangements)
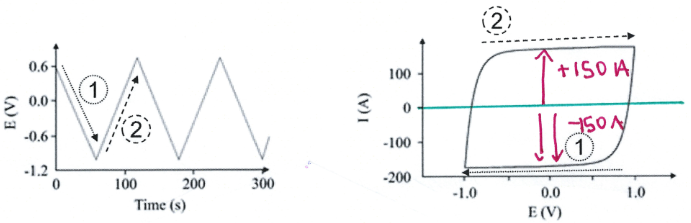
1) Decreasing the voltage of the working electrode increases the electrostatic attraction of positive ions in the solution to the working electrode. Negative ions therefore move away from the electrode surface, giving a negative current.
2) The opposite occurs when the voltage sweep changes direction and the anions are drawn towards the surface and the cations move away.
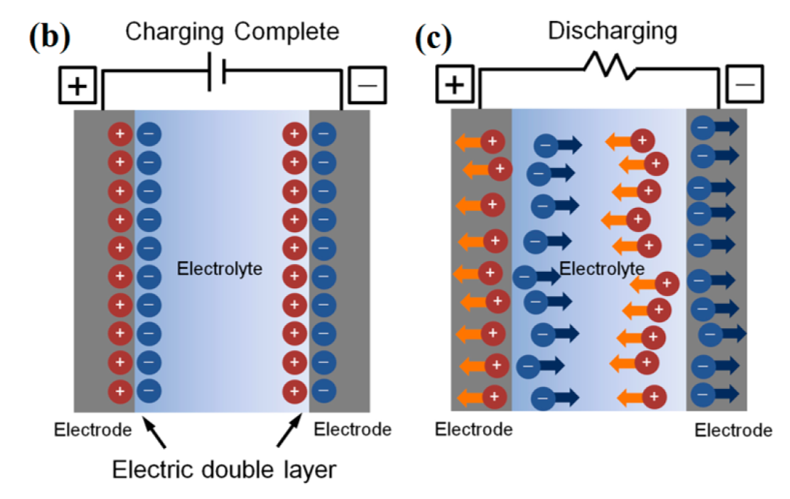
This layer of ions near the electrode surface is called the doubl layer.
Describe and explain the relationship between scan rate and non-faradaic (capacitive) current.
Non-faradaic (/capacitive) current is the baseline measurement of current observed in the absence of redox active species. This is caused by double layer rearrangements.
Scan rate directly controls the rate of ion movement so a linear trend is observed between scan rate and capacitive current.
Current is essentially the speed of ion/electron movement, so faster rearrangement of ions in the double layer means a higher observed current.
Define film electrochemistry.
Draw a diagram to show this.
Experiments conducted with the analyte adsorbed onto the working electrode.
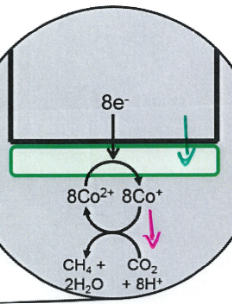
Electrons are transferred from the working electrode to the Co which is immobilised in a protoporphyrin and stuck to the working electrode. This produces Co+, which then passes the electron to the CO2 and H+ to facilitate the reaction.
Define solution electrochemistry.
Experiments conducted with the analyte dissolved in the electrochemical cell solution.
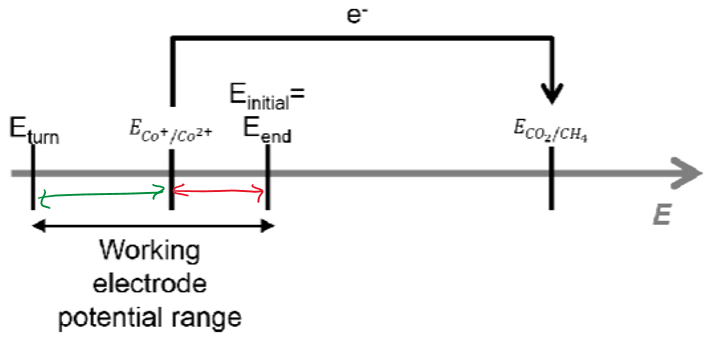
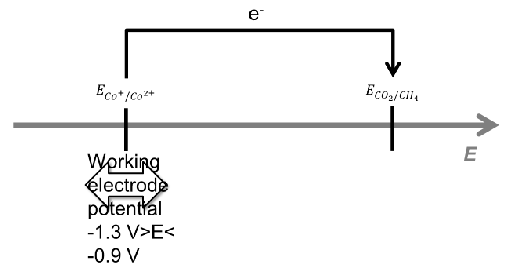
Draw a voltage diagram to demonstrate how electrons flow in this film voltammetry system:
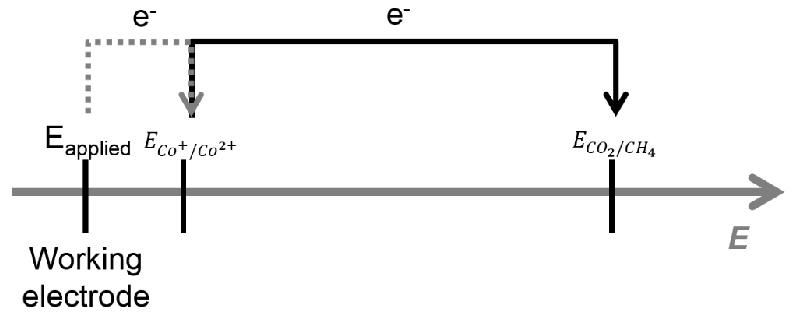
The dotted line is the spontaneous transfer of electrons from the working electrode to the Co film.
The other arrow is the spontaneous tranfer of electrons from the Co+ to the CO2 + H+ to facilitate the foration of CH4.
Given that this current-time trace is for a chronoamperometry experiment for reaction (A), calculate the maximum rate of production of CH4.
(A) CO2 + H+ → CH4 + H2O
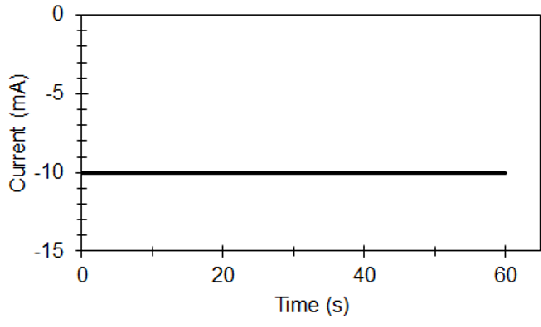
Balancing the equation:
CO2 + 8H+ + 8e- → CH4 + 2H2O
The current produced is -10 mA, so -10 × 10-3 Cs-1 (0.01 Cs-1)
This is the rate of electrons leaving the electrode.
Faraday constant: 96485 Cmol-1
So 0.01/96485 = 1.036 × 10⁻⁷ mol of electrons leaving the electrode per second
8e- used per CH4 produced, so (1.036 × 10⁻⁷)/8 = 1.3 × 10⁻⁸ mol of CH4 produced per second (max - assuming all electrons leaving the electrode are being used in this reaction)
Given that the maximum rate of production of CH4 from the system tested in this figure is 1.3 × 10⁻⁸ mol per second, give the maximum amount of CH4 that could have been produced.
1.3 × 10⁻⁸ mol per second
Voltage was applied for 60s
So 1.3 × 10⁻⁸ mol per second x 60s = 7.7 × 10⁻⁷ mol of CH4 produced total
Given no further information, calculate the maximum amount of CH4 produced by this experiment:
CO2 + H+ → CH4 + H2O
-10 mA = 0.01 Cs-1 of electrons lost from the working electrode.
0.01 Cs-1 × 60s = 0.6 C of charge
Faraday constant: 96485 Cmol-1
So 0.6 C / 96485 Cmol-1 = gives 7.7 × 10⁻⁷ mol of electrons moved.
CO2 + 8H+ + 8e- → CH4 + 2H2O
8e moved per CH4 so (7.7 × 10⁻⁷)/8 = 9.6 × 10⁻⁸ mol of CH4 produced total in the 60 seconds.
What are the variables in this equation? (don’t learn equation)
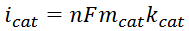
icat: the total catalytic current from the working electrode
n: the number of electrons transferred per molecule of product formed
F: Faraday constant
mcat: molar amount of catalyst (in mol)
kcat: the catalytic turnover rate (s-1)
Calculate the % of the max possible yield of O2 that was generated in this experiment:
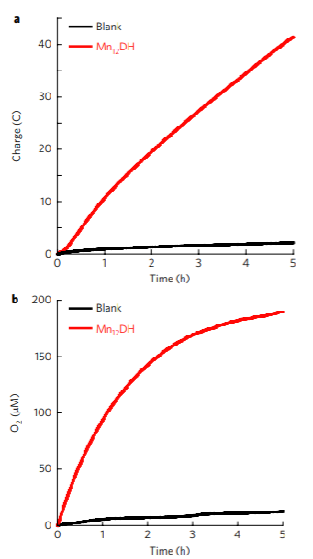
5 mL solution
H2O → O2 + 4H+ + 4e-
Over 5 hours, total of 42 C of charge was passed.
Theoretical max of O2: 42 C / (96485 × 4e-) = 1.09 × 10⁻⁴ mol
Actual amount produced: 180 μM in 5 mL system
(180 × 10-6) × (5 × 10-3) = 9 × 10⁻⁷ mol of O2
So % yield is 9 × 10⁻⁷ / 1.09 × 10-4 = 0.8% of the theoretical maximum.
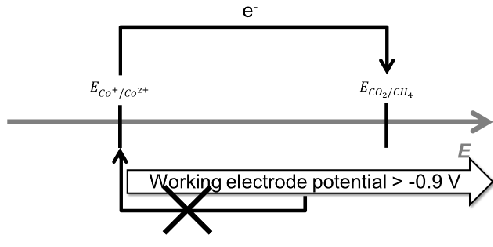
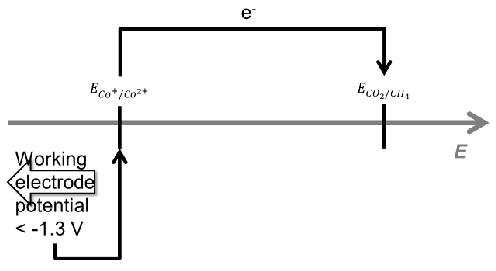
How can cyclic voltrammetry tell you the potential of a catalyst (Ecat)?
By varying the working electrode potential, you can observe the point at which the reaction stops occurring.
This is when the EWE is more positive than the catalyst (analyte) potential so electron transfer is no longer spontaneous (red region).
In the green region, the working electrode is more negative than the catalyst (analyte) potential so it readily transfers electrons.
ECo+/Co2+ = Ecat
Describe region 1 in this graph:
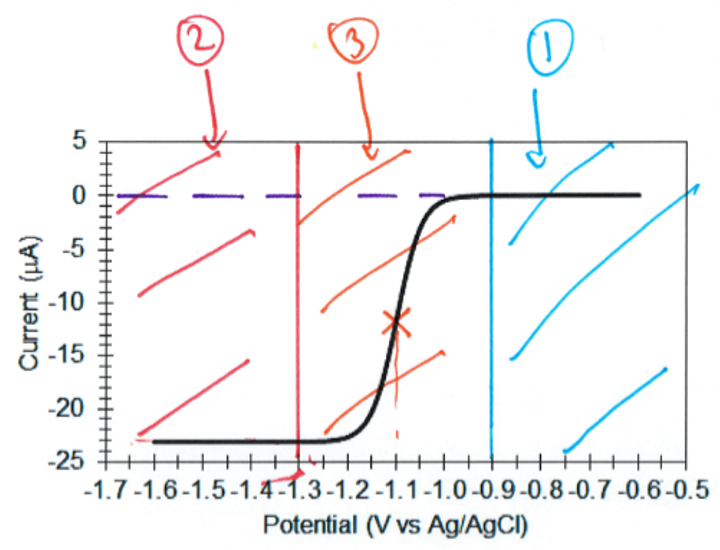
In region 1, the applied potential is more positive than Ecat, so electron transfer from the electrode to the Co doesn’t occur.
Describe region 2 in this graph:
In region 2, electron transfer from the electrode to the Co is spontaneous and rapid so essentially all of the Co is the active state (Co+).
Therefore, the rate of catalysis (ie. current) is independent of working electrode potential.
Describe region 3 in this graph:
In region 3, the working electrode potential is close to Ecat.
In this region, the rate of catalysis (ie. current produced) is dependent on the working electrode potential.
The midpoint of this curve is the ECo2+/Co+ value.
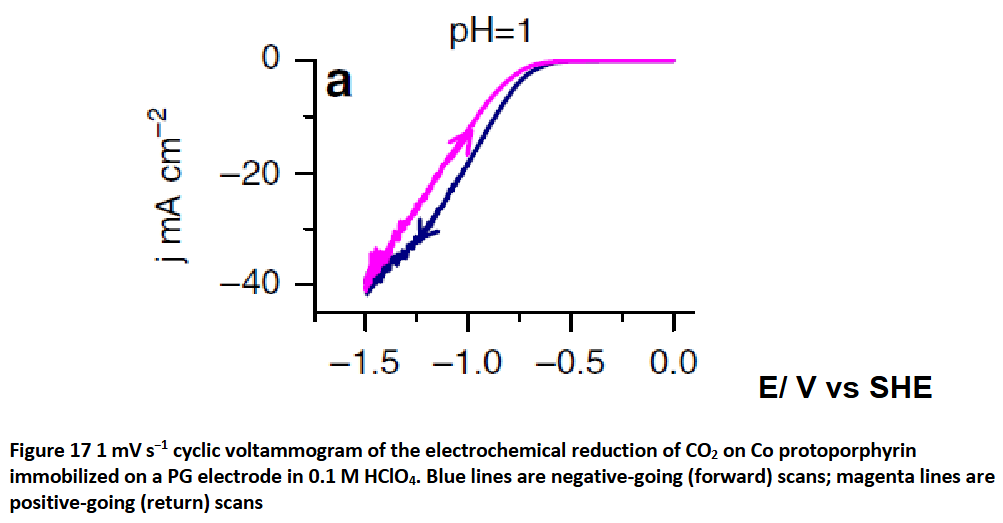
Describe the shape of this graph:
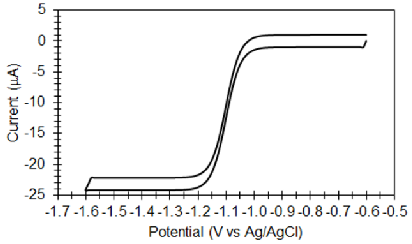
This is a cyclic voltammogram of an ideal electrocatalyst.
The fact that it has an area and isn’t this:
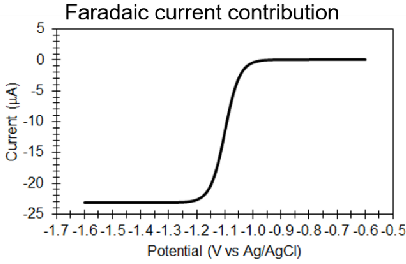
is because of the non-faradaic (background) current contribution.
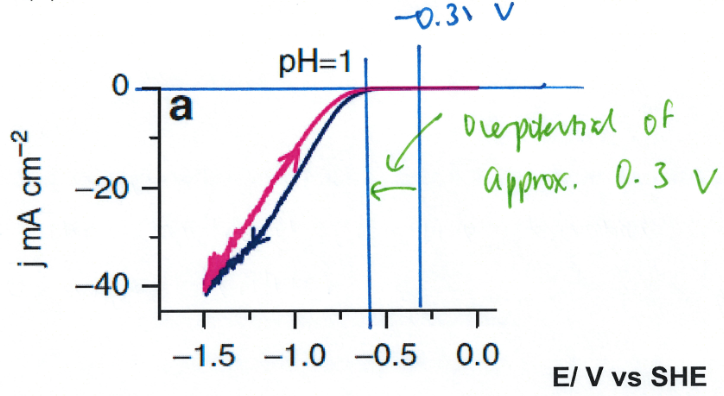
Given that the Ecell value for this system is -0.31 V vs SHE, calculate the overpotential.
What does the y axis of a cyclic voltammogram tell you about a system?
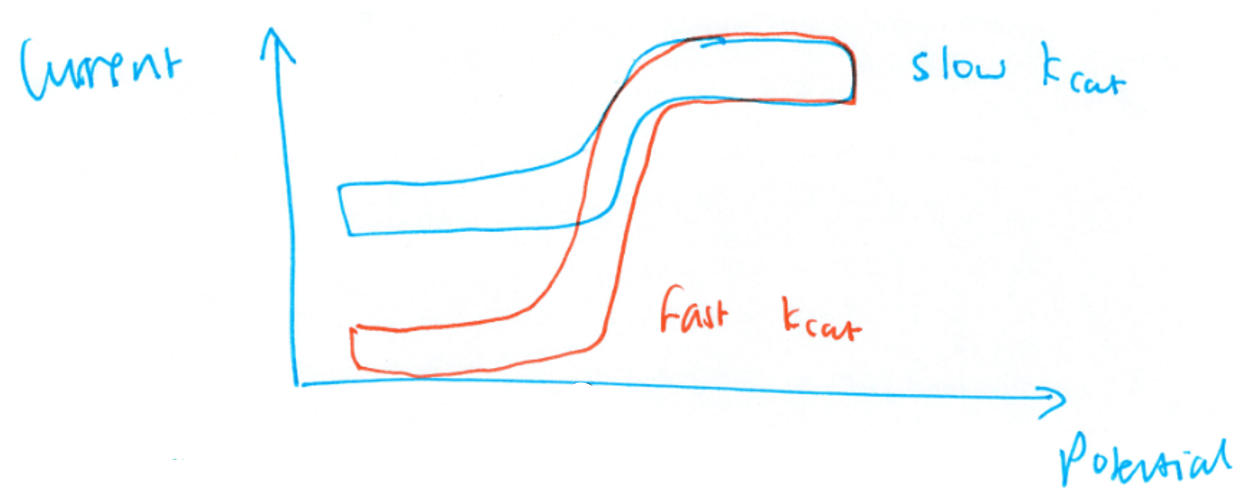
The y axis range tells you speed of electron transfer (kcat)
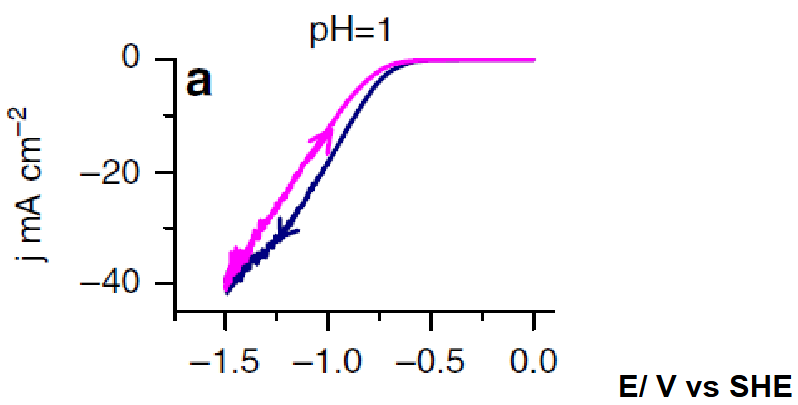
How long did this voltammogram take to run?
Voltage cycled from -1.5 to 0 and back to -1.5, so 3 V range.
1 mVs-1 sweep so 3 / 0.001 = 3,000 s
Why is no electrolyte salt been added in this experiment?
This system is at pH = 1 so has very high [H+] (10-1)
This provides sufficiently high ionic conductivity that no other ions are required to be added.
What does a positive current tell you about an electrochemical system?
A positive current tells you that an oxidative process is occurring:
What does a negative current tell you about an electrochemical system?
A positive current tells you that a reductive process is occurring:
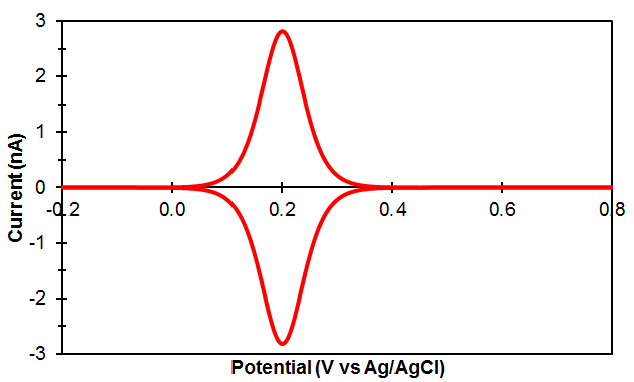
What is shape of a theoretical faradaic current response for a reversible, one-electron redox reaction?
Assuming no non-faradaic current, a fully reversible, one electron redox reaction would give a response as below:
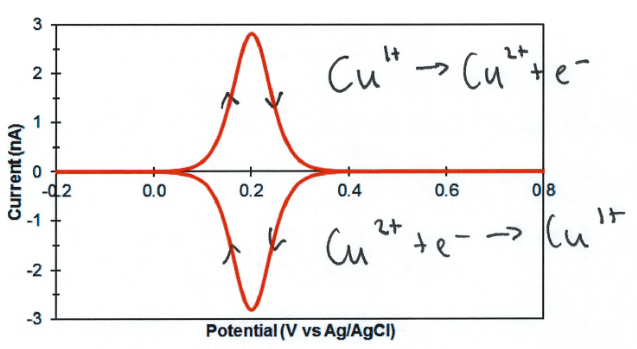
Label the processes occurring in each part of this graph and describe what the graph shape tells you:
This graph is for a Cu2+/1+ system.
This graph shows that E(Cu2+/1+) = +0.2 V vs Ag/AgCl under the specific conditions used in this experiment (pH and temperature).
The shape of this graph shows that this is a fully reversible, one electron transfer redox system.
What does the area of a cyclic voltammogram tell you?
The peak area = charge passed.
Give the amount of charge passed for the oxidative peak of this graph, given that the scan rate is 0.1 Vs-1.
Using this value, calculate the amount of redox active material there is attached to the working electrode.
Oxidative peak is roughly a triangle.
Base = 0.2 V range = 2 seconds
Height = 2.8 nA = 2.8 × 10⁻⁹ A = 2.8 × 10⁻⁹ Cs-1
Area of triangle = ½ x base x height = ½ x 2 x 2.8 × 10-9 = 2.8 × 10⁻⁹ C
(2.8 × 10⁻⁹ C) / (96485 Cmol-1 × 1 electron transferred per protein) = 2.9 × 10⁻¹⁴ mol of redox active material (assuming 1 electron transfer system)
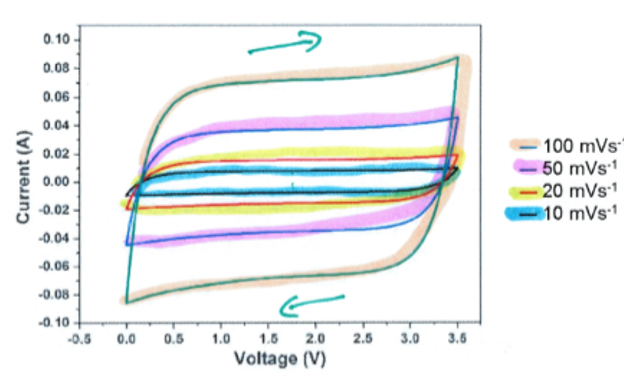
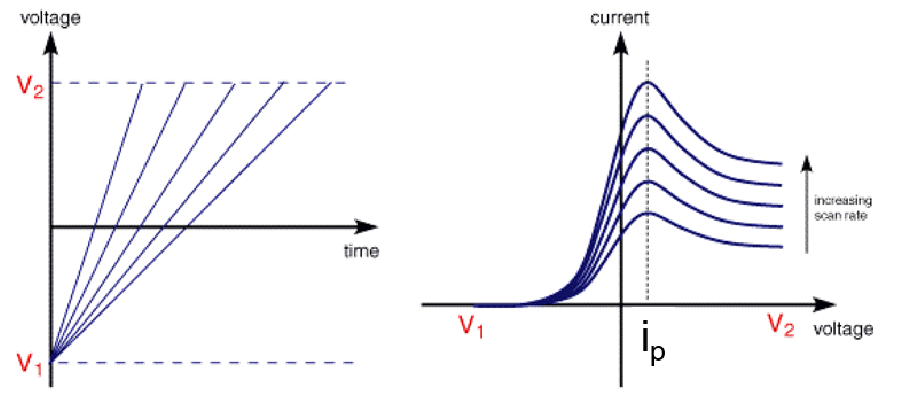
What is the relationship between scan rate and max current produced from a system?
ip ∝ v
If the same amount of redox species is present on the working electrode surface then there will be the same peak area (same amount of total charge passed), no matter the scan rate.
At higher scan rates, more electrons are moved in a shorter time. Current is charge passed over time (Cs-1) so the current peak gets taller, making the peak narrower.
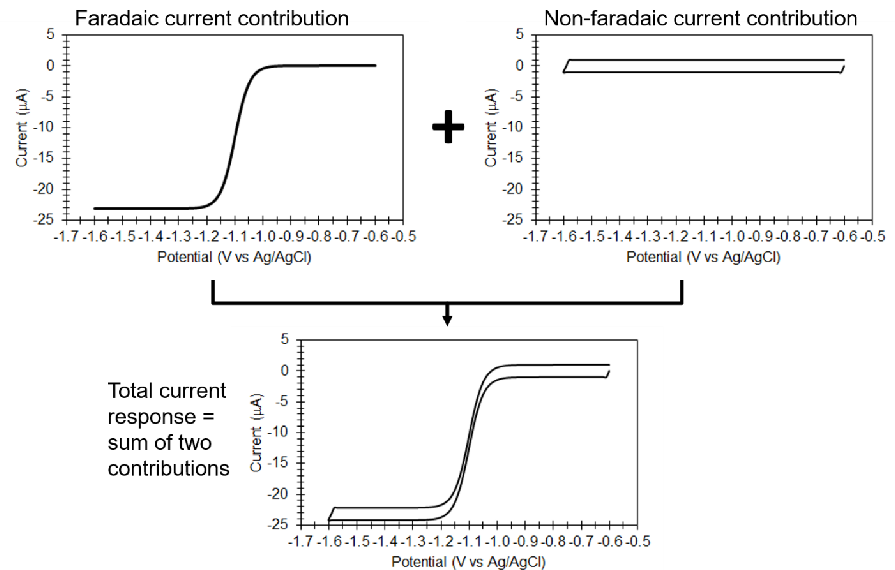
Draw a graph to represent the faradaic and non-faradaic contributions to a current-voltage response in a non-catalytic, reversible film voltammetry experiment.
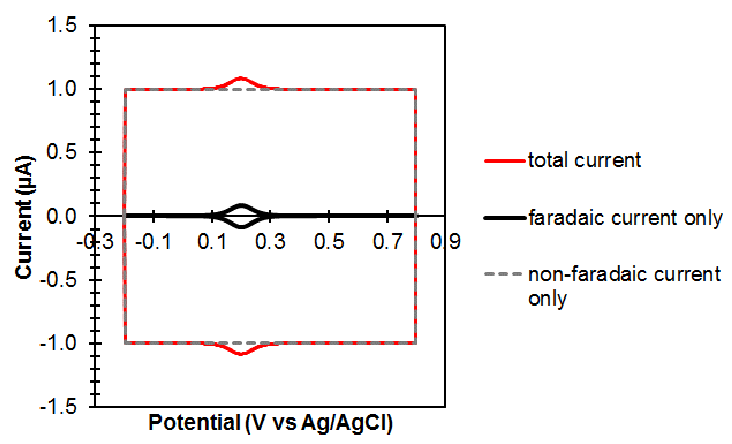
Oxidation and reduction peaks are seen, caused by faradaic current.
Non-faradaic current gives a rectangle background, as expected due to double layer rearrangements.
The combination gives a strangely shaped plot.
What is the difference between a catalytic and non-catalytic system in cyclic film voltammetry?
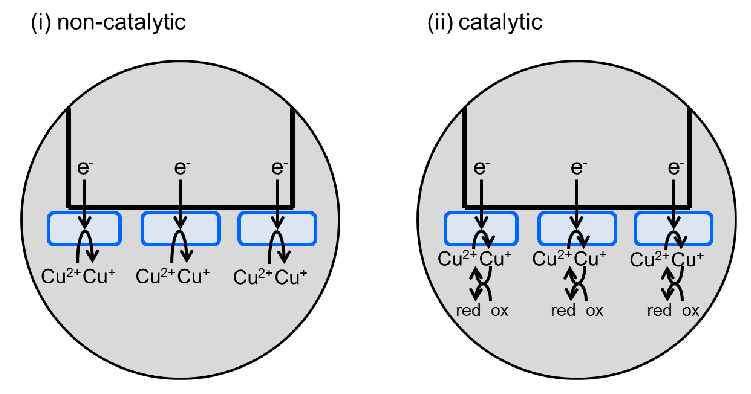
In a catalytic system, a substrate is continuously regenerating the enzyme starting state.
In non-catalytic systems, there is no regeneration of the enzyme (film species).
Explain the 1) shape and 2) trend shown in this graph:
1) The shape is caused by baseline non-faradaic current (double layer rearrangements) making the rectangular shape, and faradaic current caused by electron transfer giving the peaks.
2) The trend shown is the increasing peak size with increasing scan rates (ip ∝ v). At higher scan rates, more electrons are moved in a shorter time. Current is charge passed over time (Cs-1) so the current peak gets taller and narrower.
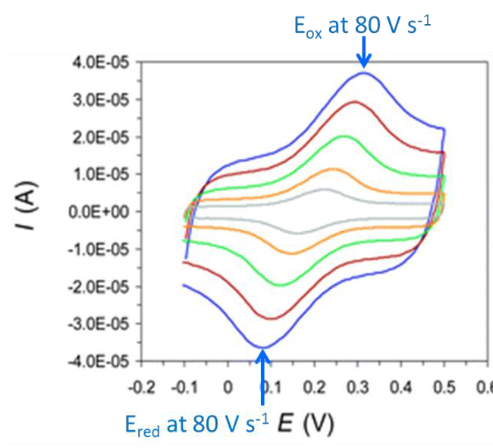
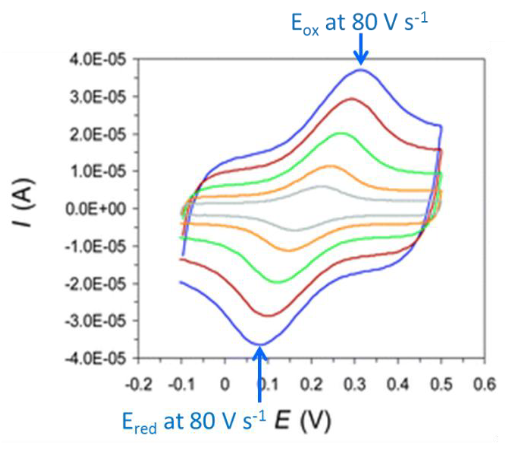
Explain the increasing difference in Eox and Ered shown below:
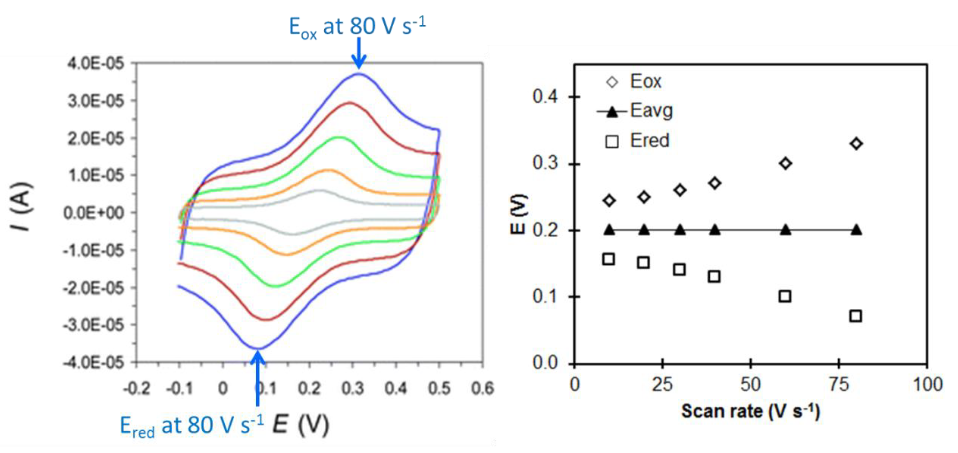
The difference between Eox and Ered increases with scan rate.
This is because of a kinetic delay in the movement of electrons: the delay between the change in potential and the resultant electron movement in the protein in response.
Describe the key difference between film and solution voltammetry.
In solution voltammetry, diffusion is a key factor.
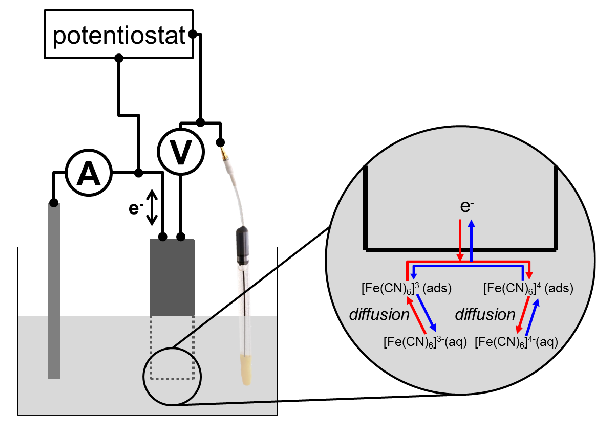
Explain how diffusion impacts solution voltammetry.
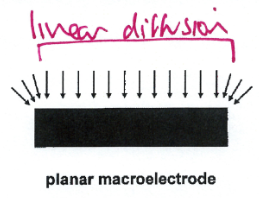
The faradaic signal (current arising from redox reaction) is dominated by linear diffusion effects.
This means that diffusion is only significant when at 90o to the electrode surface.
Describe how a cyclic voltammogram can show whether you are in a film or solution system?
Film:
Solution:
This distortion is observed because of diffusion limiting the rate of reaction and the build up of oxidised or reduced species around the electrode (ox or red depending on scan direction).
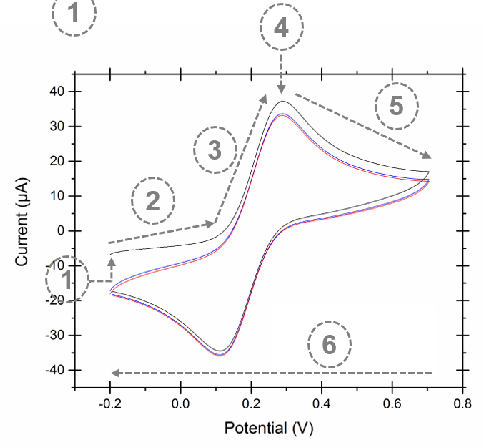
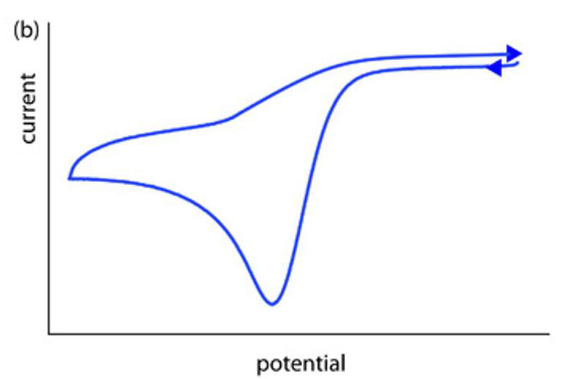
Explain each of the regions of this graph:
1) Negative potential is applied at time = 0.
2) Some reduction (negative current) is seen from -0.2 V to +0.1 V.
3) Positive current (oxidation) is recorded from +0.1 V to +0.3 V. Current increases with potential suggesting that increasing the potential increases the rate of reaction.
4) Around +0.3 V, the current reaches a maximum. This is where diffusion cannot keep up with the rate of oxidation at the electrode surface.
5) From +0.3 V to +0.7 V the current falls slightly. This is because a region of oxidised species builds up around the electrode, slowing the rate of reaction.
6) The scan direction is reversed and gives the same peak-like response.
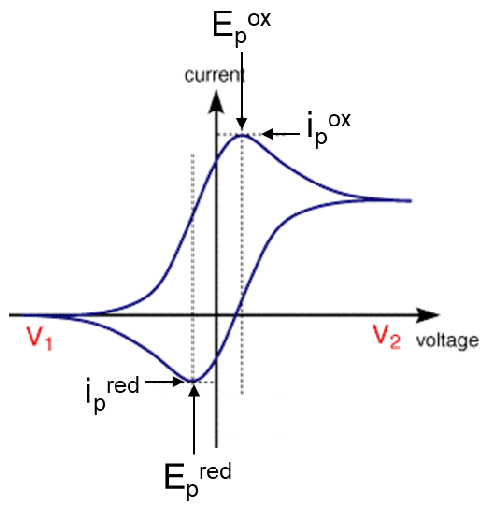
Label this voltammogram with Epox, Epred, ipox and ipred.
What is the equation for a fully reversible process?
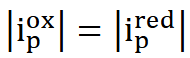
(the absolute value the oxidative current is equal to the reductive current)
Give the Randles-Sevcik equation. When does it apply?
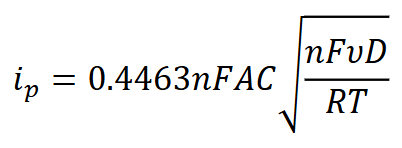
A = electrode area /cm2
D = diffusion coefficient /cm2s-1
C = concentration /molcm-3
ν = scan rate /Vs-1
When an electrochemistry system is under diffusion control, the peak current should be directly proportional to the concentration of the analyte and should scale with the square root of the scan rate.
What is the difference between film and solution voltammetry (in relation to scan rate)?
Film voltammetry: ip ∝ v
Solution voltammetry: ip ∝ √v
Explain this relationship in solution voltammetry:
ip ∝ √v
This is because faster scan rates cause the diffusion layer to be established over a shorter distance. Because the concentration varies from bulk to zero over a narrower length, the concentration gradient is higher, increasing the local rate of diffusion, therefore, a faster voltage sweep rate results in a higher current.
What is E in a voltammogram such as this one?
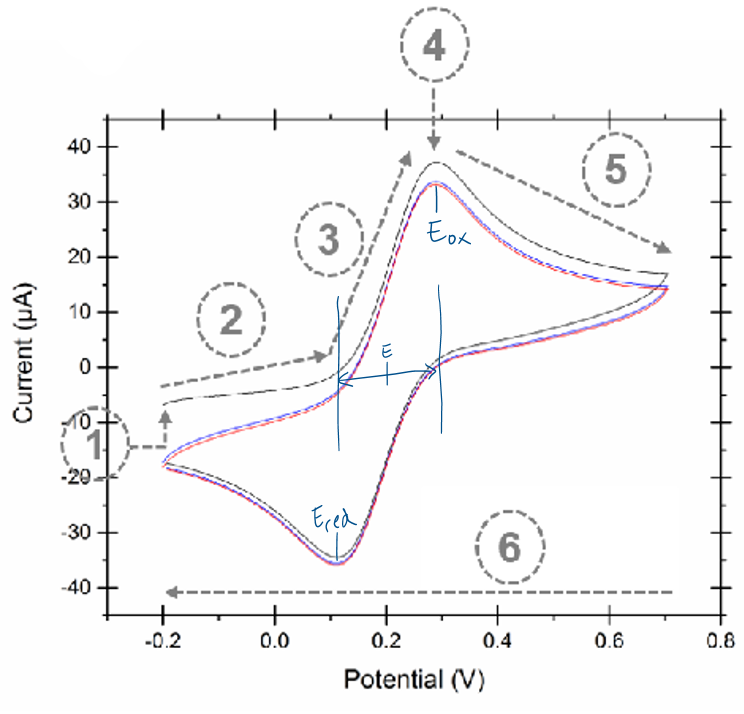
The midpoint potential between Eox and Ered.
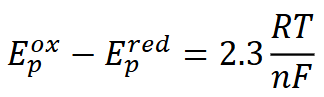
What is the equation used to calculate the number of electrons transferred in an electrochemical reaction?
What is the relationship between peak current and concentration in solution electrochemistry?
ip ∝ C
(because of Randles-Sevcik equation)
What does this graph demonstrate?
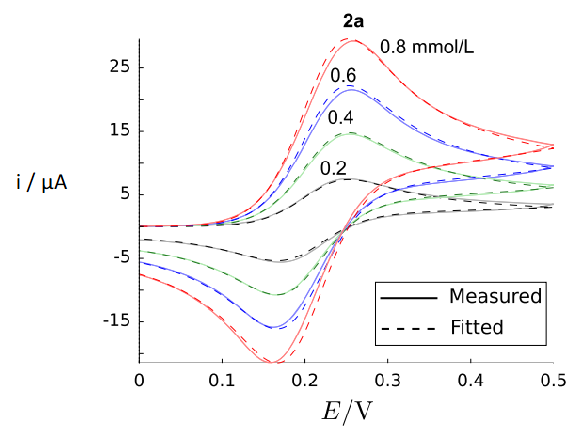
This graph demonstrates the relationship between concentration and peak current in solution voltammetry.
ip ∝ C
(because of Randles-Sevcik equation)
What feature of a voltammogram demonstrates the reversibility (or lack thereof) of redox chemistry?
Similar sized oxidative and reductive peaks suggest complete reversibility.
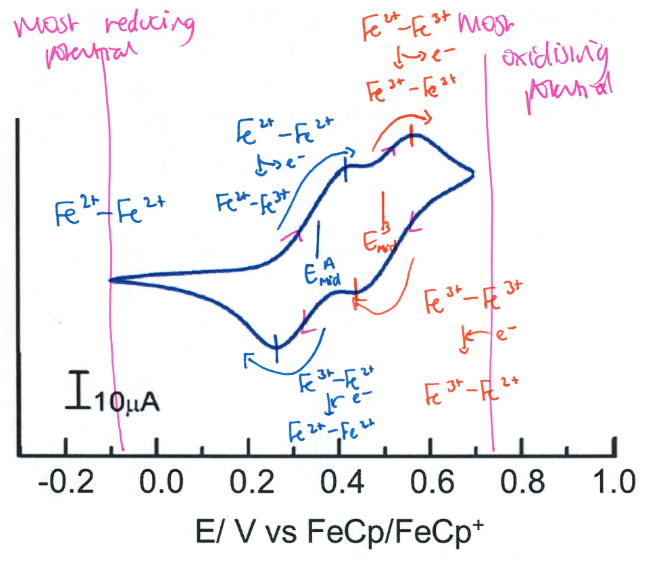
Given that this system is the redox of a 2 x Fe organometallic, label which species dominate in each region:
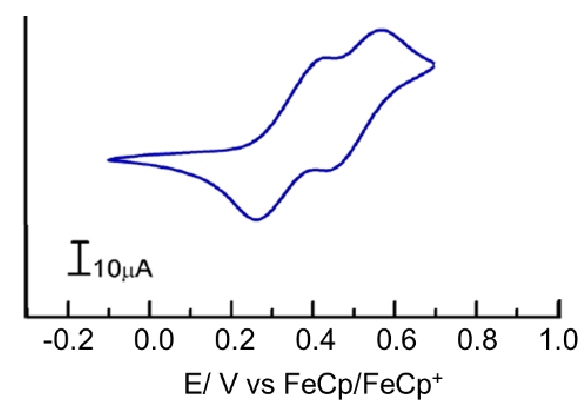
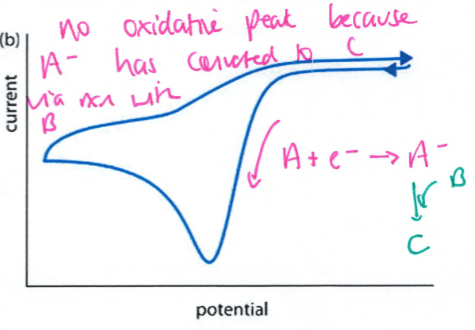
Describe what this voltammogram shows.
This graph has no oxidative peak, showing that no oxidation occurs in this system.
This is therefore an irreversible redox process.
A species is reduced, then reacts and is used up so cannot then be oxidised.
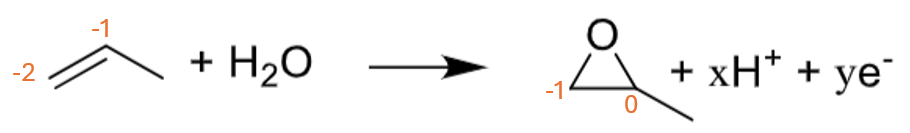
Give the oxidation state for the alkene carbons in propene and 1,2-propylene oxide
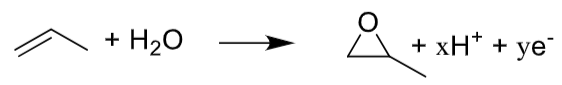
Method of calculating: H = -1, O = +1, C = 0
So:
Why is [TBA][BF4] used in preference to each of NaBF4 and [TBA][Br]?
NaBF4 has insufficient solubility in acetonitrile
[TBA][Br] unsuitable because of possibility of Br- oxidation at high potentials