Soc 110
1/61
There's no tags or description
Looks like no tags are added yet.
Name | Mastery | Learn | Test | Matching | Spaced | Call with Kai |
|---|
No analytics yet
Send a link to your students to track their progress
62 Terms
What is Statistics
science of collecting, organizing, and interpreting data
The Data (numbers/other pieces of information) that describe or summarize something
Parameter vs. Statistic
numerical summary of the population
EX: ex - % of all American adults who approve of president bidens performance as president
Statistics
ex. % of 1000 adult Americans in a poll who approve of president bidens performance as president
Data
information that is collected to gain knowledge about a field of to answer a question of interest
Population
total set of subjects of interest
Sample
Subset of the population on which the study collects data on
Variable
Characteristics that can vary across subjects
Types of variables
Quantitative
Categorical
Discrete
Continuous
Quantitative Variables
Numerical values
EX
income, age, years of education
Categorical Variables
Categories
ex
marital status, province of residence, gender, state
Discrete Variable
Separated values
ex
number of siblings
Continuous Variable
Infinite possible values
ex.
Height,
Levels of Measurement
Nominal
Ordinal
Interval
Ratio
Nominal Level of Measurement
data that consists of names, labels, or categories only. The data are Qualitative and cannot be ranked or ordered
Examples of the Nominal level of Measurement
Race, Gender, religious affiliation, political party affiliation
Ordinal Level of Measurement
Data that can be arranged in some order (such as low to high). generally does not make sense to do computations with data.
Examples of the Ordinal Level of Measurement
Yelp star rating, low/High/Medium, satisfied/not satisfied, likely/not likely/ (scale surveys).
Interval Level of Measurement
data in which intervals/distance between measurements are meaningful, but ratios are not. Data at this level have an arbitrary zero point
Examples of the Interval level of Measurement
Temperature in Celsius/ Fahrenheit, IQ/SAT scores, Time/dates,
Ratio Level of Measurement
data in which both intervals and ratios are meaningful. Data at this level have an arbitrary zero point
Examples of Ratio Level of Measurement
Distance, Height, Age, Temperature in Kelvin, weight, speed, Duration(seconds, minutes, etc.)
What are the Measures of Central Tendency
Mean
Median
Mode
Mean
The Average Value
Found by —> Sum of all values/total number of all values
Requires interval-ratio level data
Sensitive to outliers
Median
Middle Value halfway between the two middle values if the numbers of values are even. If it is odd —> arrange data in ascending order, add two middle numbers - then divide by 2
ordinal+ level data
not strongly influenced by outliers
Mode
Most common value(s)
requires nominal+
What Measures of central tendency can be Nominal
Only Mode
What Measures of central tendency can be Ordinal
Mode, Median, Range
What Measures of Central tendency and variability can be Interval-ratio
Mode, Median, Mean, Range, Standard Deviation
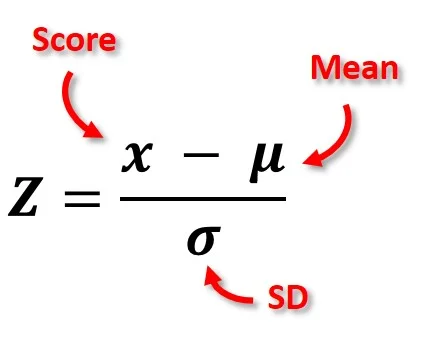
What do Z Scored Measure
measures how many standard deviations a data point is above or below the population mean
Z Score Formula
Finding Z Score Example:
Middle school principle has 100 8th graders taking a national standardized test with a mean of 400 and a standard deviation of 70. Assuming that the scores are normally distributed. What is the likelihood that one of the graders selected at random will score below 375 on the exam?
Z= (x - mean)/ standard deviation[little o/sigma]
Z = (375 - 400)/7
Normal Curve and Z Scores

Percent of Data Set within 1 standard Deviation
68%
Percent of Data Set within 2 standard Deviation
95%
Percent of Data Sent within 3 standard Deviation
99.7%
Three Different Sampling Distributions
Population Distribution
Sampling Distribution
Sample Distribution
Population Distribution
Real distribution representing the characteristics of all members of our population of interest
Descriptive Statistics
Summarize data/ information in a using graphical and statistical representations
helpful to reduce complexity and present data in a comprehensible manner
Inferential Statistics
provide predictions about a population, based on data from a sample of that populationf
Sampling Distributions
Theoretical probability distribution representing the results of all possible samples drawn from the population
used to see how close a sample is to the population mean
Sample Distributions
real distribution describing the characteristics of a sample (Sample subset of the population)
The Larger the sample size?
The smaller the standard error and the closer the sample means would be clustered around the true population parameter
Principle in Central Limit Theorem
What does Central Limit Theorem use normal curves for?
When the distribution of sample means approximates a normal distribution (nromal bell curve) as the sample size gets larger
For random sampling with a large sample size n, the sampling distribution of the sample mean y¯ is approximately a normal distribution.
Central Limit Theorem
For random sampling with a large sample size n, the Sampling distribution of the sample mean y¯ is approximately a normal distribution
Inferential statistics
Two Kinds:
Point Estimate
Confidence Interval
Point Estimate
When sample statistic used to estimate the exact value of the population parameter (mean, proportion, etc.)
one of the inferential statistics estimates
Confidence Interval
uses sample statistics to build an interval around which the parameter is likely to fall
What happens to your range as you become more confident?
It gets larger
because less room for error
What Confidence Interval do we use in class?
95%
1.96
Estimating Population Mean
a parameter of the true average of an entire group, found by claculating sum of all values (N) and dividing by total population size.
sample mean is best estimate if the population mean when we have only a single sample
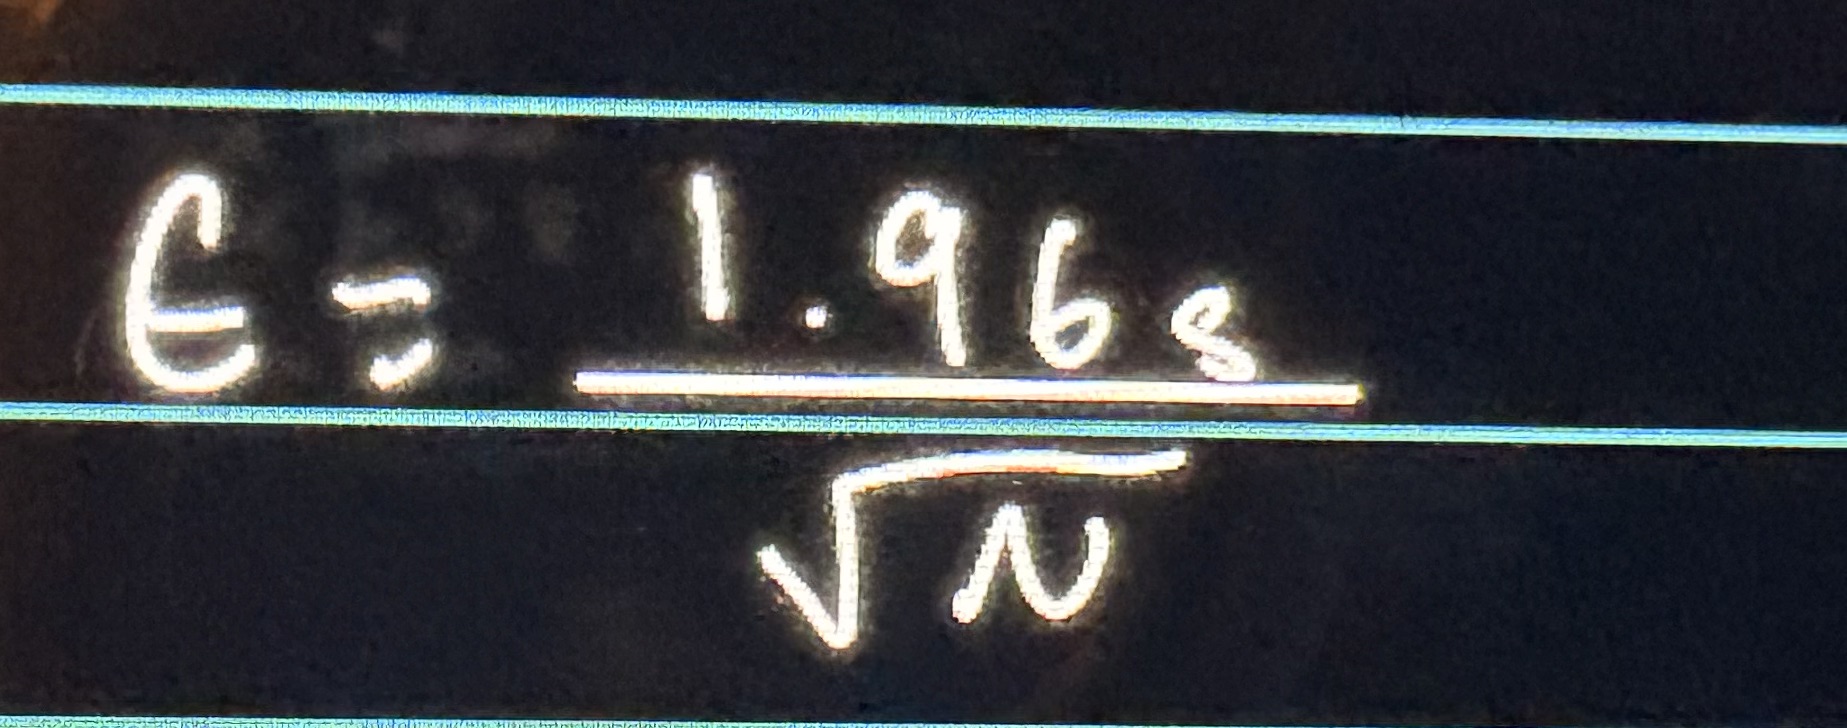
Margin of Error
Statistic expressing maximum expected difference between results and true population value
used to calculate confidence level
Formula for Margin of Error
S - standard Deviation
N - Sample Size
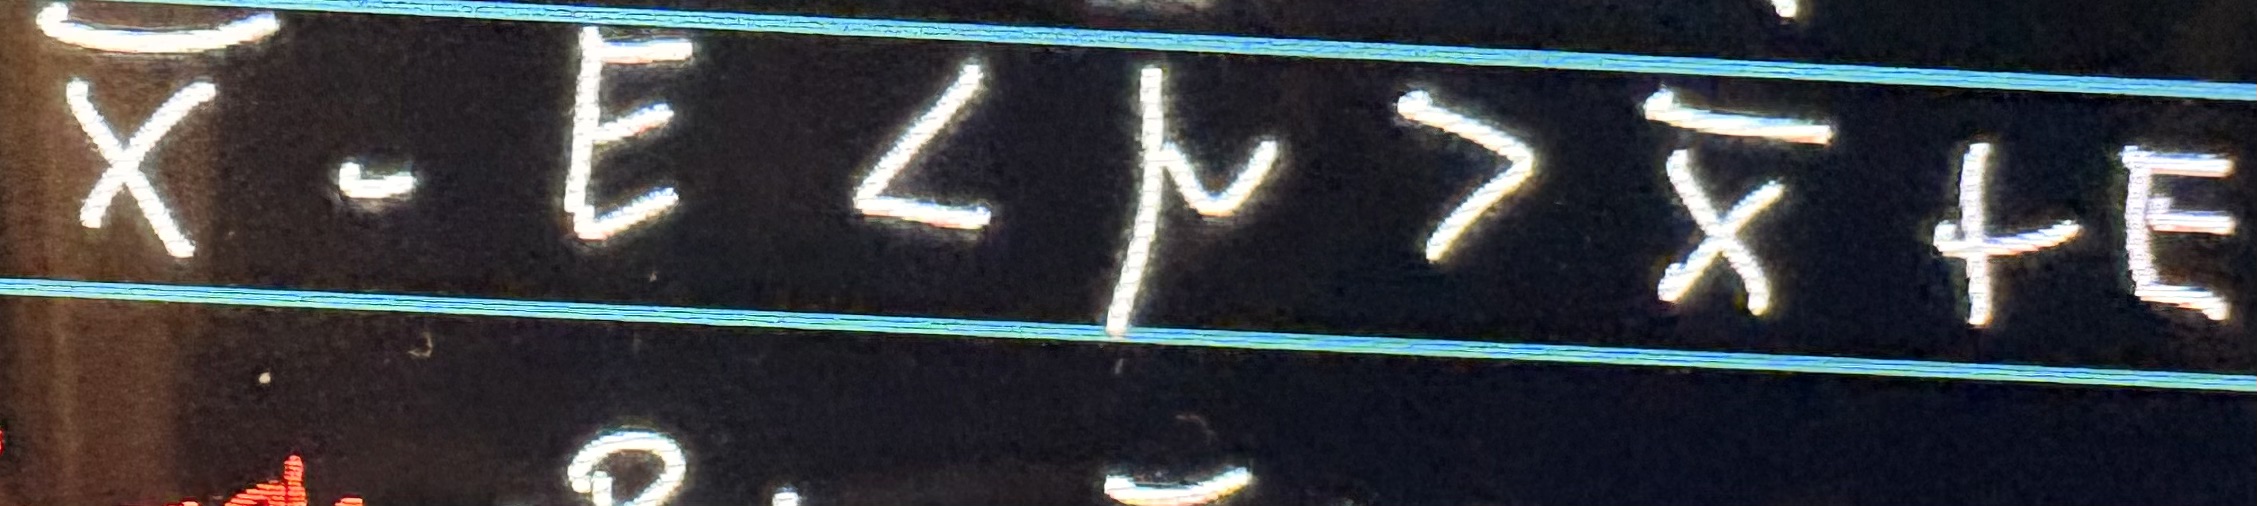
Confidence Level Formula
X(bar) - Sample Mean
E - Margin of Error
Find Margin of Error at 95% and the Confidence Interval
N= 267
Sample Mean of X(bar) = 77.0
SD = 58.6
Margin of Error = 7.03
Confidence Interval = 69.97 to 84.03
What are the Three types of Significance Testing
Once Sample T-test
Two Sample T-test
ANOVA
Once Sample T-test
Compares random sample from a subpopulation against a large population
Two Sample t-test
Compares difference between two sample statistics/two populations
EX - Weekly hours worked for men and for women (Mutually exclusive two samples)
ANOVA
Like a two-sample test, want to know if observed differences in sample means represent:
uses sampling distribution of variation (differences) in mean
EX. levels of support for capital punishment between different age groups ( 20-30, 31-40, 41-50) - different age groups
Sample Significance Testing
Null Hypothesis
H0 always States that there is no significant difference between groups
Alternative Hypothesis
H1 states that the observed difference really exists in the overall population
What are the Testing Requirments
Sample was selected randomly via one of the methods for attaining probability samples
The level of measurement is interval scale
The sampling distribution is normal in shape
Golden standard for testing but can get away without someone
In sampling Significance testing, what happens when p = 0.05?
A p value that is less than or equal to 0.05 is significant. When the p value is significant then we must reject the null hypothesis (H0 )
P-Value
If the H0 is true, this is the probability that we would see this result
Low P-value means?
it is unlikely that H0 is true given the result
equals low probability of being wrong if we reject the null
what goes having a 95% CI mean?