Chapter 3: Advanced MA
1/9
There's no tags or description
Looks like no tags are added yet.
Name | Mastery | Learn | Test | Matching | Spaced | Call with Kai |
|---|
No analytics yet
Send a link to your students to track their progress
10 Terms
The focus will be on two mathematical methods that help managers choose the best option when resources are limited: linear programming and dynamic programming.
Linear programming is a method used when a company wants to optimize something, usually maximize profit or contribution margin, while respecting limitations.
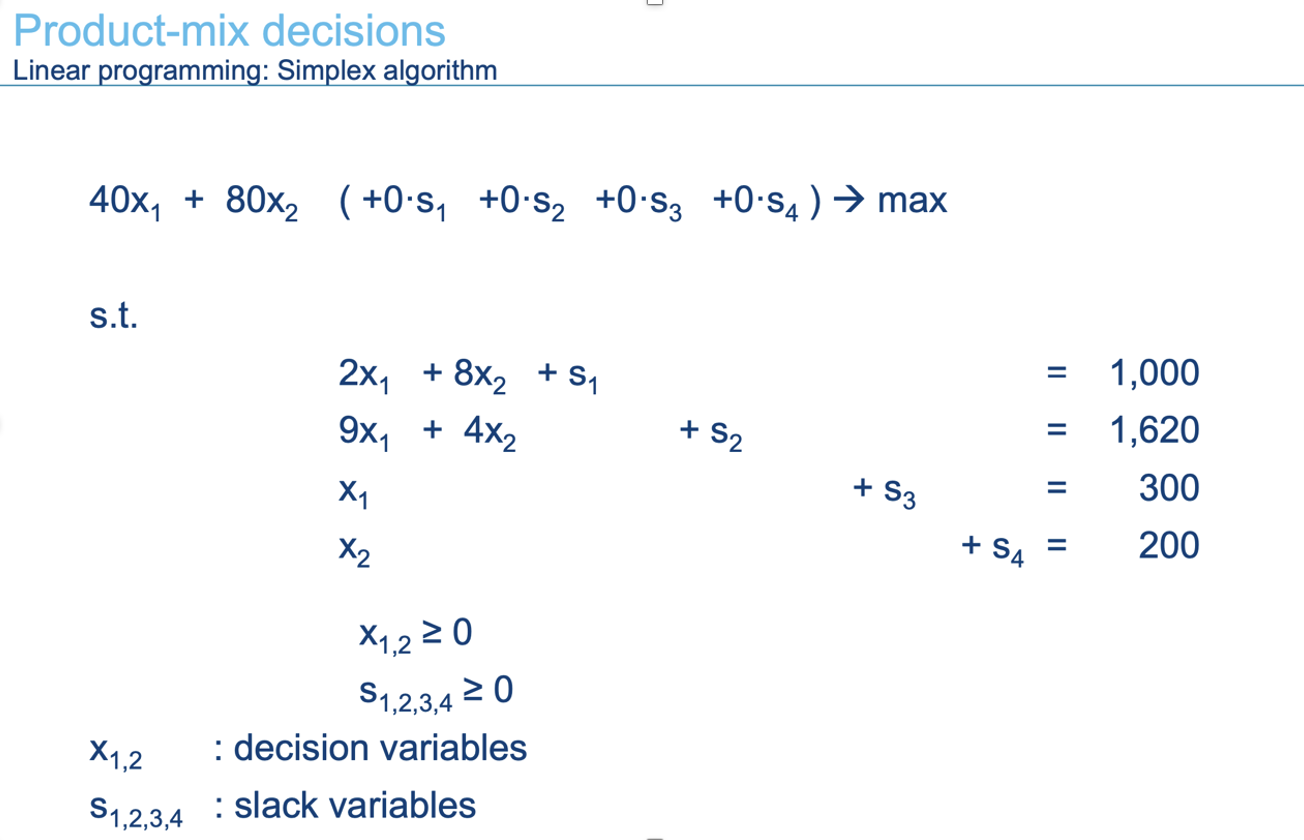
This slide prepares the model for the simplex algorithm.
The simplex algorithm is a calculation method used to solve linear programming problems, especially when there are several constraints. To use the simplex method, the inequalities are changed into equations by adding slack variables. A slack variable measures unused capacity. For example, if resource 1 has 1,000 units available but the company only uses 900, then the slack is 100. That means 100 units of the resource are unused. Here, s1 is the slack for resource 1, s2 is the slack for resource 2, s3 is the slack for the sales limit of product 1, and s4 is the slack for the sales limit of product 2. The slack variables are added with a coefficient of zero in the objective function because unused resources do not directly create contribution margin. Producing product 1 and product 2 creates contribution margin, but simply having unused capacity does not. That is why the objective function remains focused on 40x1 + 80x2.
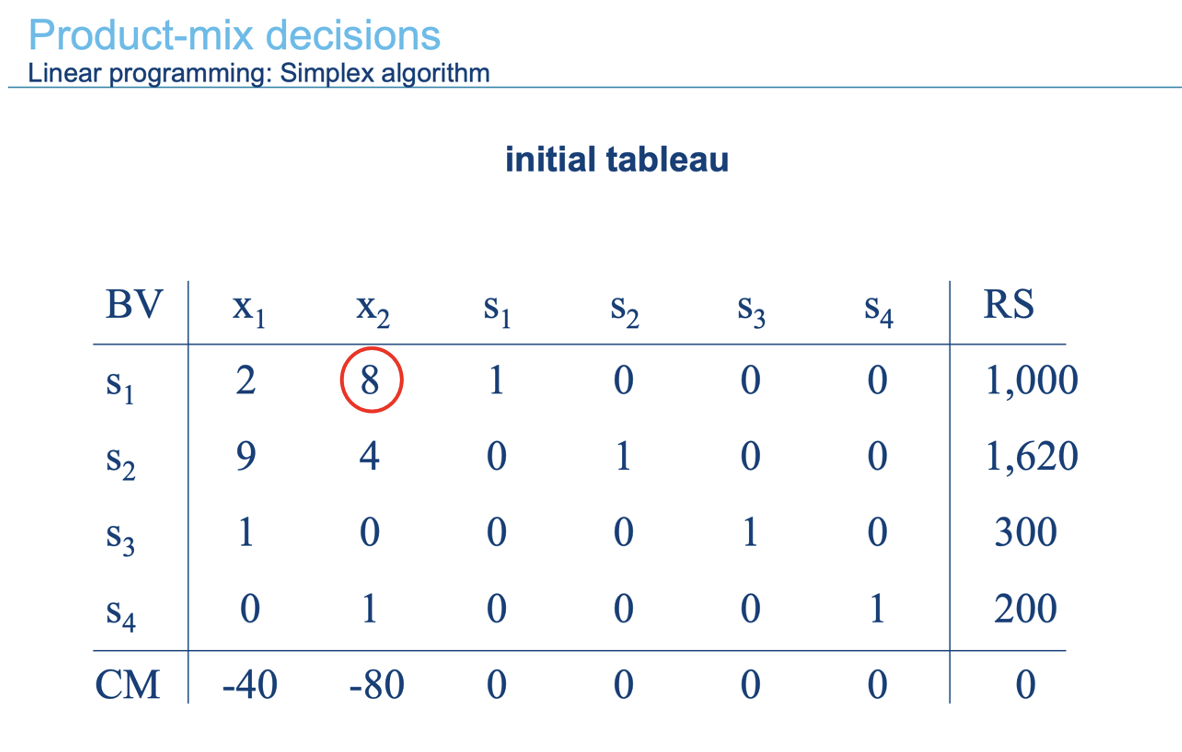
Simplex Tableau
A tableau is a table used to organize the simplex calculations. The column BV means basic variable. At the beginning, the basic variables are the slack variables, because the model starts as if no products are produced yet. If x1 and x2 are both zero, then all the resources and sales capacities are unused. That is why s1 = 1,000, s2 = 1,620, s3 = 300, and s4 = 200. The RS column means right side. It shows the available amount for each constraint. The bottom row, called CM, shows the contribution margin coefficients in the simplex format. The negative values under x1 and x2 show that producing these products can still improve the objective function. Product 2 has -80, which is more negative than -40 for product 1, so product 2 is the more attractive entering variable at this stage. The circled 8 is the pivot element. The pivot elementis the number used to transform the tableau and move toward a better solution. In simple words, the simplex method asks: which product should enter production, and which current slack variable should leave the solution? Here, product 2 enters first, and the pivot calculation starts from that point.

Extra Info
1. Why are -40 and -80 negative? The real objective function is: CM = 40x1 + 80x2 That means:
Each unit of product 1 adds 40 contribution margin.
Each unit of product 2 adds 80 contribution margin.
But in the simplex tableau, they rewrite it like this: CM - 40x1 - 80x2 = 0. So the bottom row shows -40 and -80, not because the products are bad, but because of how the equation is rearranged. Meaning:
-40 under x1 means: if we start producing product 1, CM can improve by 40 per unit.
-80 under x2 means: if we start producing product 2, CM can improve by 80 per unit.
So “more negative” actually means “more attractive” in a maximization problem, because it gives a bigger improvement. Product 2 has -80, which is more negative than -40, so simplex says: “Let product 2 enter production first, because it increases contribution margin more per unit.” So don’t think “negative = bad.” Here, negative means “there is still profit to gain.” Once the bottom row has no negative numbers left, simplex is done.
2. Why is the pivot element 8?
Once simplex chooses x2 as the entering variable, we look at the x2 column:
s1 row: 8
s2 row: 4
s3 row: 0
s4 row: 1
This column tells us how much each constraint is affected if we produce product 2. Now we ask: how many units of product 2 can we produce before we hit a limit? We divide RS by the x2 column number:
For resource 1: 1,000 / 8 = 125
For resource 2: 1,620 / 4 = 405
For product 1 sales limit: ignore, because x2 coefficient is 0
For product 2 sales limit: 200 / 1 = 200
Now choose the smallest positive number: 125 is the smallest. That means resource 1 runs out first if we produce product 2. So resource 1 becomes the limiting constraint. The pivot element is where the entering column and leaving row meet:
Entering column = x2
Leaving row = s1
Intersection = 8
So 8 is the pivot element. Very simply: x2 enters because it gives the highest contribution margin improvement. s1 leaves because resource 1 is the first constraint that gets fully used. The number 8 is the pivot because it sits at the intersection of those two choices.
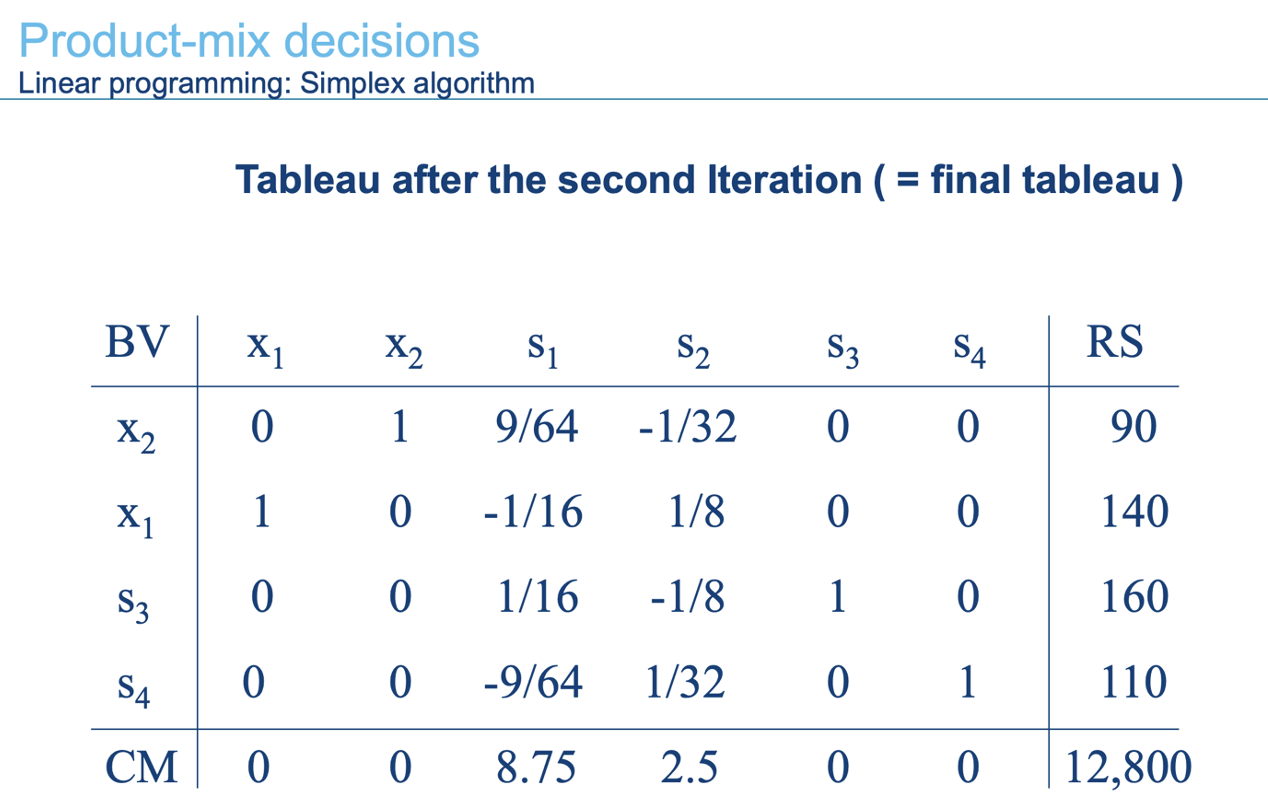
This is the final simplex tableau after the second iteration.
The final tableau tells us the optimal solution directly. The basic variables are now x2, x1, s3, and s4. The right-side values give their amounts. Therefore, x2 = 90 and x1 = 140. This means the company should produce 90 units of product 2 and 140 units of product 1. The contribution margin is shown in the bottom-right corner: 12,800. This is the maximum total contribution margin possible under the given resource and sales restrictions. The tableau is final because the bottom row no longer shows negative improvement values for the decision variables. In the logic of the simplex method, this means that no further change in the product mix can increase the contribution margin.

Solution Method
look into your notes there is extra solution steps
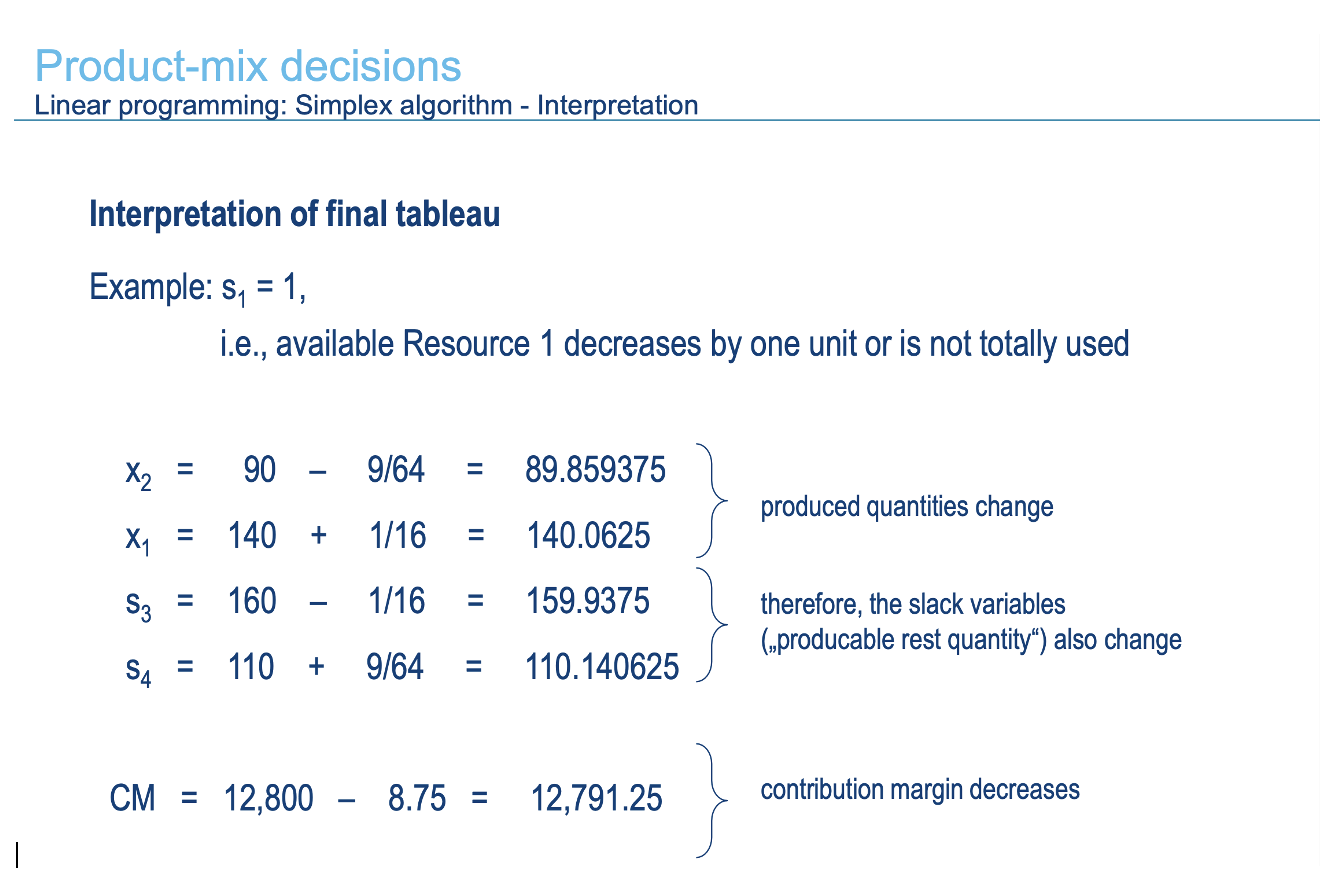
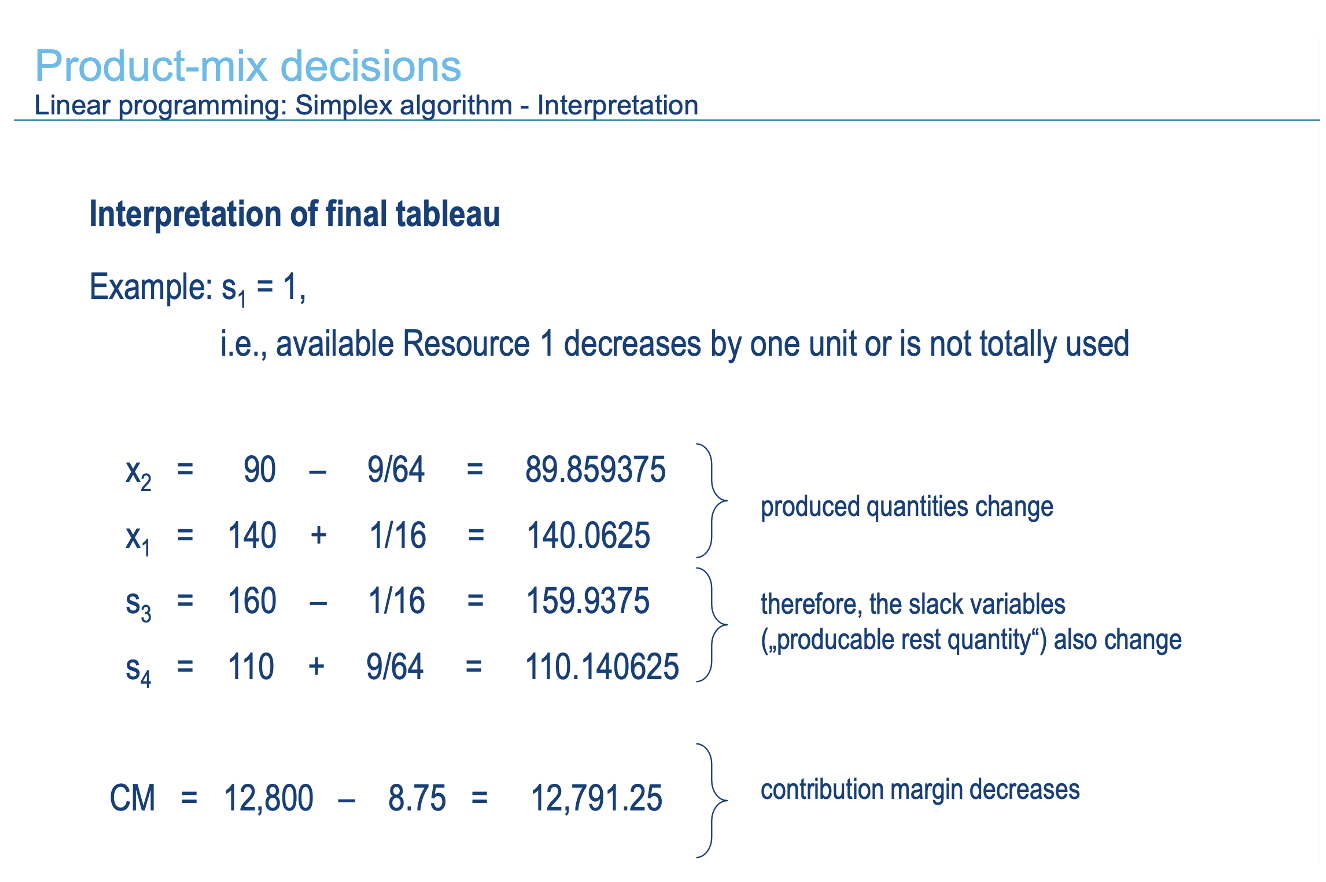
Interpretation of final tableau
x₁, x₂, etc. = production quantities
They show how many units of each product should be produced in the optimal product mix.If x increases
The company should produce more of that product.If x decreases
The company should produce less of that product.s₁, s₂, etc. = slack variables
They show unused capacity/rest quantity of a resource.If s = 0
The resource is fully used, so it is a binding constraint.If s > 0
The resource is not fully used, so there is leftover capacity.CM = contribution margin
It shows the total profit contribution from the optimal product mix.If CM increases
The new situation is better for the company.If CM decreases
The new situation is worse for the company.Shadow price = value of one extra unit of a scarce resource
It shows how much CM would increase if the company gets one more unit of a binding resource.
Shadow Price meaning
tells us how much the contribution margin would change if one more unit of a scarce resource became available
Dynamic programming
While linear programming focused on finding the best product mix under limited resources at one point in time, dynamic programming is used when decisions are spread over several time periods. The important idea is that a decision made today can affect the options available in the future. So the company does not only ask “what is best now?”, but also “how will this choice influence what I can do later?”