Cadiac Output Regulation
1/40
There's no tags or description
Looks like no tags are added yet.
Name | Mastery | Learn | Test | Matching | Spaced | Call with Kai |
|---|
No analytics yet
Send a link to your students to track their progress
41 Terms
cardiac output
total flow or blood out of the left ventricle'
total flow that is available to perfuse all the tissues of the body
why is cardiac output not measured in the aorta?
portion of the total output flows to heart itself for coronary circulation
in order to meet the metabolic demands of the body and maintain arterial pressure, cardiac output must?
be able to increase substantially
What happens to cardiac output with exercise?
can increase 4-5 fold
increase HR (3 fold)
increase SV (1.5 fold)
with exercise, increase in cardiac output enables an increase in overall O2 consumption of?
12 times
why is CO essential to pressure during exercise
total peripheral resistance during exercise decreases (1/3 resting value)
increase in co is essential to maintain mean arterial pressure
MAP = CO x TPR
systolic and diastolic changes during exercise
systolic BP increase with linear fashion to workload
diastolic BP stays same
How would systolic BP drop during exercise? What does this indicate?
MAP = CO x TPR
if CO does not increase and TPR decreases = BP down → indication to stop exercise
either CO dropped (HR or SV not increasing)
or peripheral resistance increased to a greater degree
factors controlling cardiac output
cardiac factors: characteristics of the cardiac tissues
heart rate
myocardial contractility
coupling factors: constitute a functional coupling between heart and blood vessels
preload
afterload
Graphic techniques have been developed to analyze the interactions between the cardiac and vascular components of the circulatory system. The graphic analysis involves two simultaneous functional relationships between?
cardiac out put and central venous pressure
(the pressure in the right atrium and thoracic venae cavae)
2 indicants of preload
central venous pressure
EDV
central venous pressure
pressure in the right atrium and thoracic venae cavea
central volume mobilization
blood returning to the right side of the heart and ability to mobilize that blood
better indicant of preload because more blood returning to right side of heart = increased right atrial pressure
EDV as preload indicant
coming from left side of the heart
however, more blood returning to right side of heart = increased right atrial pressure
MSNA effects on right atrial pressure
increased MSNA = increased right atrial pressure
MSNA helps to facilitate preload
cardiac function curve
expression of Frank-Starling relationship
dependence of cardiac output on preload
(ie on central venous, or right atrial pressure)
*hearts are isolated from rest of circulatory system
characteristic of the heart itself
vascular function curve
defines the dependence of the central venous pressure on CO
depends only on certain vascular system characteristics - peripheral resistance, arterial and venous compliance, and blood volume
entirely independent of the characteristics of the heart
can be evaluated even if heart was replaced by mechanical pump
cardiac output is the output of the? What actually determines cardiac output?
output of the left ventricle
preload of the right ventricle determines cardiac output
left ventricle pumps whatever volume comes to it
so filling pressure on right side determines output of left
filling pressure = central venous pressure (right atrial pressure)
in the intact circulation, the preload is considered to be?
the central venous pressure
= mean arterial pressure
= right ventricular pressure when tricuspid valve is open

Describe the cardiac function curve
at a given preload/right atrial pressure, there will be a given stroke volume
straight line indicates maximum pressure the ventricle can produce at a given volume
represents ESVPR - end systolic volume pressure relationship = contractility = dp/dt

draw the corresponding graph

draw the corresponding graph
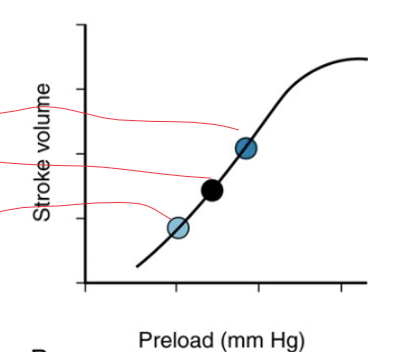
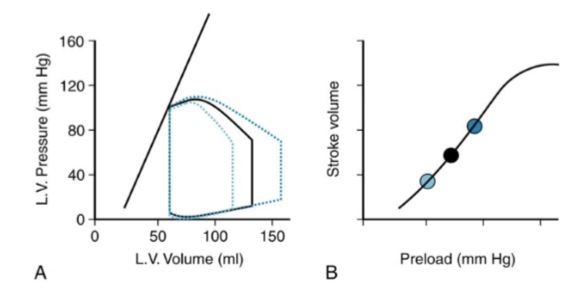
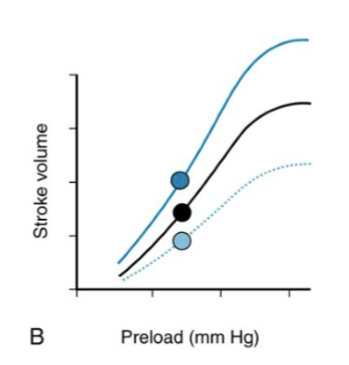
When contractility is held constant, describe the relationship between preload and stroke volume
higher preload = higher SV = higher EDV
lower preload = lower SV = lower EDV
contractility no change = ESPVR no change
ESV does not change when preload changes

draw the corresponding graph

draw the corresponding graph
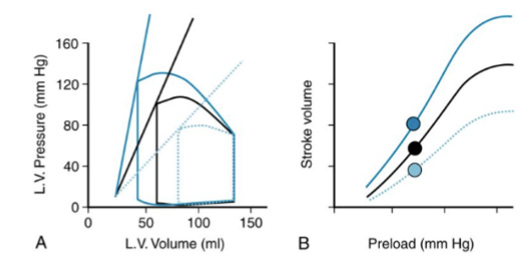
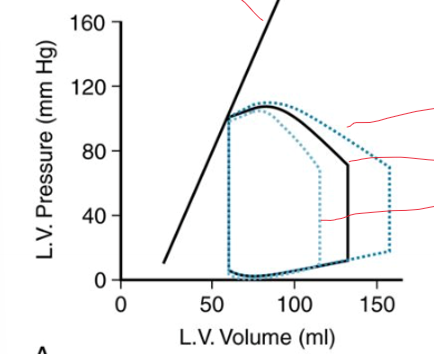
Describe the relationships happening on graph
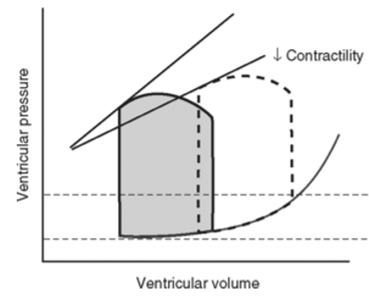
linear line is different = different contractility = raise peak pressure that can be developed at a given left ventricular volume
increased contractility
upward ESPVR and left (increased slope)
increased SV
decreased ESV
decreased contractility
= downward ESPVR and right (decreased slope)
decrease SV
EDV is the same because preload is constant
How will a change in contractility affect the cardiac function curve
completely new cardiac function curve
still reflects Frank-Starling relationship
relationship between pressure and contractility
cannot be separated
increased contractility = increased pressure
cannot have increased contractility without increased pressure and vice versa

draw the corresponding graph

draw the corresponding graph
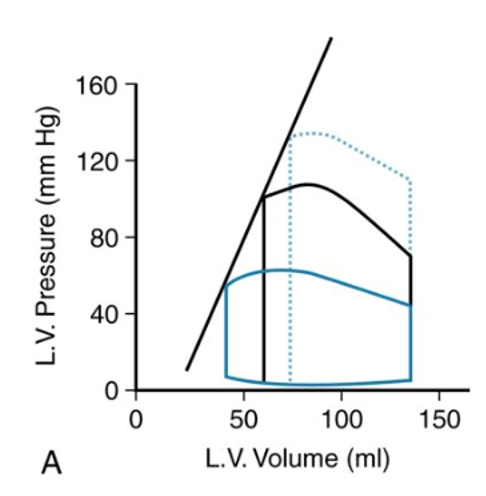
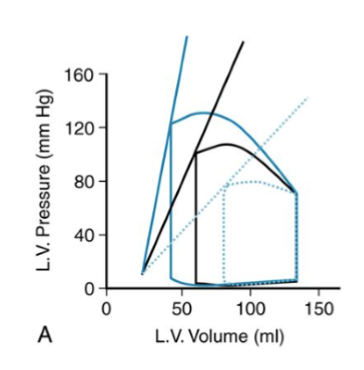
afterload
load experienced by the left ventricle after the aortic valve opens (ending the isovolumic contraction phase)
how do increases in afterload affect the left ventricular PV loop
higher pressure throughout the ejection phase
why does increasing afterload increase pressure?
when diastolic arterial blood pressure is elevated, the isovolumic contraction must then develop a higher pressure in the left ventricle before the aortic valve can be forced open
how does increased afterload affect ESVPR, SV when contractility is constant
ESVPR same
SV decreased
because heart is not able to achieve a lower ESV
it does not have an increase ability to squeeze down against the elevated pressure
How does a decrease in afterload affect SV and ESV
increased SV
lower ESV because heart is able to squeeze down more
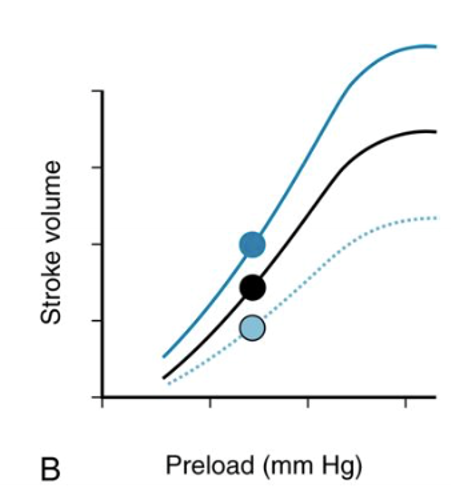
how does the change in afterload affect the function curve
completely new function curve
still displays the length-dependence of cardiac contraction
If preload held constant, but SV differs from conditions
SV gets its own cardiac function curve
systolic failure
HFrEF - heart failure with reduced ejection fraction
diastolic failure
HEpEF - heart failure with preserved ejection fraction
systolic failure
decreased ESPVR slope = decreased contractility
stroke volume maintained by increased preload
increased EDV and ESV
heart gets thick = concentric hypertrophy
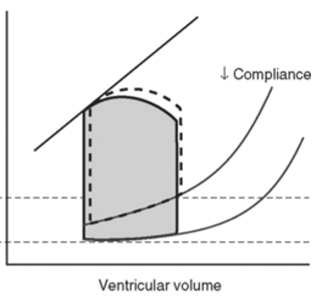
diastolic failure
same ESVPR = same contractility
passive diastolic pressure volume curve is shifted upward and to the left = increased chamber stiffness = reduced compliance
SV same
EDP increased
heart gets thin = eccentric hypertrophy
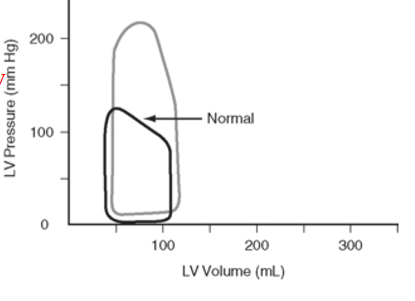
aortic stenosis
Aortic valve not opening all the way
Have to generate more pressure
LVSP is higher