Investments - Financial Statement Analysis
1/22
There's no tags or description
Looks like no tags are added yet.
Name | Mastery | Learn | Test | Matching | Spaced | Call with Kai |
|---|
No analytics yet
Send a link to your students to track their progress
23 Terms
Financial Statements
Primary information that firms publish about themselves
Users of financial statements
Investors
Government
Regulators
Employees
Managers
Courts
All companies listed for public trading in the US must provide
Balance Sheet
Income Statements
Cash Flows Statement
Statement of Shareholders’ Equity
File annual 10-K report with the SEC
File quarterly 10-Q report with the SEC
All these documents are available at the SEC EDGAR database
The use of Financial Statements in Valuation
Multiple analysis
Ratios used in Valuation
P/E, P/B, P/Sales,…
Method of comparables
Basis for fundamental analysis based on
dividends
free cash flows
earnings
Cash Conservation Equation (FCF = d +F) (C - I = d + f)
The cash generated by the business after reinvesting in itself (free cash flow) must equal the net cash paid out to its owners and lenders. Enforces discipline and reality. Highlights sustainability of payouts. Valuation and investment analysis. Detects aggressive accounting or manipulation.
Dividends
If C - I - i > d, then the firm will buy bonds of other firms or its own debt.
If C - I - i < d, then the firm with borrow (issue more bonds) or reduce lending (Treasurer’s Rule)
Ratio Analysis
Payout ratios
Profitability
DuPont Analysis
Financial Leverage
Analysis of credit risk
DuPont Analysis
ROE = Profit margin * Asset turnover * Equity multiplier
Profit Margin
Easy to manipulate. If too high, a competition will arise
Asset Turnover
Difficult to manipulate
Equity Multiplier
A measure of leverage
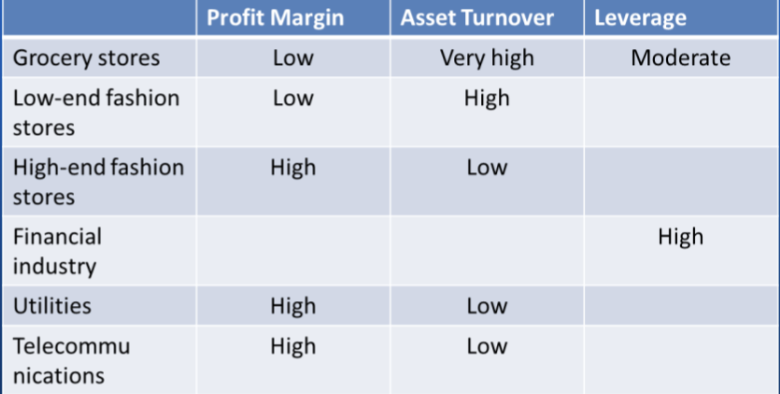
Dupont Analysis for Selected Industries
Financial Leverage
Represents the degree to which a company uses debt to fund its operations, relative to the equity invested by shareholders.
Higher FLEV → more reliance on borrowed money (higher potential returns but also higher risk)
Lower (or negative) FLEV → more constructive financing (or even net lending if the company holds more financial assets than obligations)
Typical FLEV is about 40%
Strong variations in FLEV
Financial Leverage and ROE
Financial Leverage increases ROE only if the operating spread if positive, i.e., RNOA > NOA
If spread is positive, favorable financial leverage or favorable gearing
If spread is negative, unfavorable financial leverage or unfavorable gearing
ROA
ROA mixes operating and financing activities
Poor measure of operating profitability
Median around 7.1% for US non financial firms from 1963 to 2007
RNOA
Appropriately distinguishes operating and financing items
Interest bearing financial assets do not influence the return on operations
Median around 10.5% for US non financial firms from 1963 to 2007
Basic versus diluted earnings per share
Basic EPS is simply earnings available to common shareholders (after preferred dividends) divided by the number of shares outstanding.
Diluted EPS: instead of number of shares outstanding, it uses shares outstanding plus shares that would be outstanding if conversion of stock options and warrants should take place.
Basic EPS should be used for equity valuation.
Analysis of Quality of Financial Statements
The current financial statements are of poor quality if they are not a good indicator of future earnings:
If earnings contain one-time, unusual items
Underestimating bad debt, warranties, deferred revenue or depreciation increases current earnings but lowers future earnings
Earnings Management
Earnings management is a manipulation of earnings:
Manipulated up: borrowing income from the future
Manipulated down: banking income for the future (“taking a big bath”)
How to Detect Accounting Manipulations
Examine possible income shifting
Examine the sales to detect possible manipulation in sales
Examine the OI to detect possible manipulations
Looking for red flags
Manipulation of operating expenses always changes both profit margin and asset turnover but in opposite direction → investigate changes in asset turnover
Be aware of firms that use different accounting methods than is usual in their industy
Analysis of Credit Risk
Liquidity ratios: address short term debt
Solvency ratios: addresses long term debt
Credit Scoring Models
Altman Z-score: indication of the likelihood of a firm not going bankrupt.
Altman Z-Score
Z > 2.99: “safe” zone - low bankruptcy risk
1.81 < Z < 2.99: “Gray” zone - moderate risk, worth monitoring
Z < 1.81: “Distress” Zone - high bankruptcy risk