Stats Final Exam
1/51
There's no tags or description
Looks like no tags are added yet.
Name | Mastery | Learn | Test | Matching | Spaced | Call with Kai |
|---|
No analytics yet
Send a link to your students to track their progress
52 Terms
hypothesis
a testable statement, derived from theory, that indicates a cause and effect between two concepts; must be a testable causal relationships
Cross tabs
a method used to analyze the relationship between two or more categorical variables by displaying their joint frequency distribution in a table format, allowing for the examination of different between groups
research hypothesis
a specific prediction about the expected outcome of a study, typically involving the relationship between variables and tested using statistical methods; can be non-directional
null hypothesis
a statement asserting that there is no significant effect or relationship between the variables being studied, serving as the default position that researchers aim to test against in hypothesis testing.
chi-square statistics
a statistical method used to determine if there is a significant association between categorical variables by comparing observed frequency counts to expected counts.
95% confidence interval
critical value at 0.05 means…
observed values
the actual data points collected during an experiment or study that are compared against expected values in statistical analyses.
expected values
the predicted frequency counts in statistical analyses that are used as a baseline to evaluate observed values.
degres of freedom
the number of independent values or quantities which can be assigned to a statistical distribution, typically calculated as the sample size minus one for a single sample (n-1 or n-2)
x2 value must be at least as large of its critical value to reject the null
how to know if value is significant from a chi-square test
cannot describe the direction or the size of the relationship (small relationship with large sample size will be significant)
limitations of cross-tabs
bivariation correlation coefficient or Pearson’s correlation coefficient
r, measures the strength and direction of the relationship
covariation
the extent to which the values of two variables move toegether
covariance
a measure of how much two random variables change together, indicating the direction of their linear relationship.
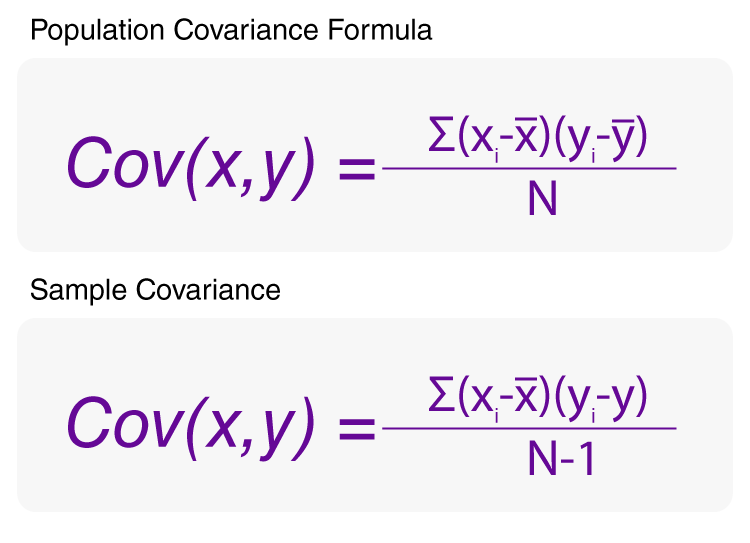
covariance formula
positive covariance
as X increases (decreases), Y tends to increases (decrease)
negative covariance
as X increases (decreases), Y tends to decrease (increase), indicating an inverse relationship.
1
the correlation coefficient of a perfect positive correlation
-1
the correlation coefficient of a perfect negative correlation
0
the correlation coefficient when there is no relationship
False
True/False: Correlation is causal, not linear
difference of means
A statistical test that compares the average values of two groups to determine if they are significantly different from each other.
operational defintion
a set of instructions that describe how to measure the value of your concept in the empirical world
validity and reliability
operational definitions must have
validity
extent to which your instrument measures the concept of interest
reliability
the consistency of a measure across time, items, and observers.
systematic error
tendency to assign values that are too high or low (bias)
random error
equal likelihood of assigning too high and too low values
causal explanation
policy implications require…
causal inference
unknown causal relationship between two or more variables
descriptive inference
unknown fact about a single variable
theory that expects X to affect Y
evidence of correlation between X and Y
valid causal inference requires
correlation
the values of two variables tend to move togetherp
prediction
knowing the value of X helps us predict the future value of Y
causation
a change in the value of one concept tends to produce change in the value of another concept
deterministic causal relation
cause (X) is always present when outcome (Y) occurs
probabilistic causal relation
cause (X) usually present when outcome (Y) occurs; outcome occurs with some likelihood when the cause is presentbut not guaranteed.
theory
causal explanations
causal relationship
how and why change in the value of one concept influences the values of another concept
co-variation: do values of X co-vary with the values of Y?
credible casual mechanism: is it possible for X to cause Y?
endogeneity/reverse causation: could Y cause X?
spurious correlation: does a third variable, Z, influence both the values of X and Y
threats to causal inference
descriptive data
data that summarizes characteristics or features of a population or phenomenon without inferring causality.
mean
the sum of all scores divided by the number of scores
deviation
difference between an observed value and the mean
mode
the most common score; most frequent value (i.e. category) of a variable in a dataset
median
the middle score (or the mean of the two middle scores); when data are arranged from lowest to highest, median is the middle value
variance
the sum of the squared errors divided by the number of data points, minus one; tells us typically how much a data point differs from the mean (layman’s terms: how much the values in a group differ from the average and from each other)
standard deviation
the square root of the sample variance; (layman’s terms: how far, on average, the values are from the average value)
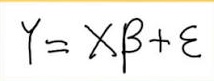
regression equation
coefficient estimates (slopes)
the values that represent the relationship between the independent and dependent variables in a regression model, indicating how much the dependent variable is expected to increase or decrease as the independent variable increases by one unit.
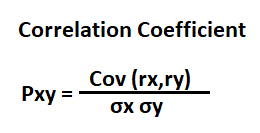
correlation coefficient formula
coefficient/standard error of the coefficient
formula for t-stats (from the coefficient correlation)
probability distribution
describes how likely different outcomes are