RFP 2025-2026
1/42
There's no tags or description
Looks like no tags are added yet.
Name | Mastery | Learn | Test | Matching | Spaced | Call with Kai |
|---|
No analytics yet
Send a link to your students to track their progress
43 Terms
Sell Discipline
15% drawdown = revaluation
25% drawdown = internal stop-loss
Sell if thesis changes, overvaluation, or significant overweight
Energy Outlook (Still overweight)
We still hold Energy and Utilities because they provide stability, income, and diversification, and we recognize long-term AI-driven electricity demand. However, we chose not to overweight to the same level as tech/industrials because the earnings catalyst is slower to materialize: utilities face regulatory and grid constraints, interconnection queues, while traditional energy stocks still trade primarily on oil prices. Policy uncertainty around renewables and long development timelines for fossil fuels and nuclear
We see clearer, more immediate AI-linked earnings growth in tech and industrials
Don’t want to be too reliant on sectors driven by AI for good returns. Diversification and risk-adjusted returns are key
What model did we use to compute expected portfolio return?
CAPM for all equities to get expected return using Damodaran’s ERP
Sector avg β assignment to determine each stock’s risk
Fixed-income SEC yield for bond ETFs
Weight × Expected Return for each holding
Sum all contributions → Total Expected Return = 7.77%
Why is the total expected return about 7.77%?
Because the portfolio is:
Equity-heavy (~63% in U.S. stocks)
With high-beta tech positions → strong CAPM returns (~9–10%)
Moderated by FI (~27% at ~4.77%)
Balanced by international equities (~10% at ~8.3%)
Weighted together → ≈ 7.77%
How do you describe the expected return calculation in 1–2 sentences?
We used a forward-looking expected return model. Equities use CAPM with sector betas, a 4% risk-free rate, and a 4.33% ERP. Fixed income uses a 4.77% SEC yield. Weighting each holding by its portfolio weight gives us a total expected return of about 7.77%
Fama–French 3-Factor Model — What are the factors and what do they mean?
Factors:
Market Risk Premium: Overall market return per CAPM using avg stock returns for the year
Size (SMB – Small Minus Big):
Positive → small stocks outperform big.
Negative → big stocks outperform small.
Value (HML – High Minus Low):
Positive → value stocks (high B/M) outperform growth.
Negative → growth stocks outperform value.
How the screener uses them:
Analyzes a company’s returns on these factors to see what drives its performance.
Positive SMB exposure: company behaves like a small-cap.
Positive HML exposure: company behaves like a value stock.
Our view on the Federal Reserve's dilemma
The FED may be unable to fully control the economy, being torn between tariff-driven inflation and a frozen job market.
How do you justify having high exposure to Technology despite the bearish outlook?
The AI-driven productivity boom is a structural tailwind independent of cyclical conditions, providing long-term secular growth backed by strong earnings (not including China). This is only the early stages of AI. Lots of contracts and capex commitments that will be played out.
What factor provides valuation support for both Technology and Industrials?
The expectation of global monetary easing and upcoming rate cuts, as they are rate-sensitive sectors.
What is the primary strategic reason for our international allocation, given the bearish international outlook?
Long-term diversification, attractive relative value, and to hedge against the slower, bearish risks we identified in the U.S. market.
What global policy expectation supports both IEFA and IEMG?
The expectation of global monetary easing (rate cuts), which will lower borrowing costs, boost investment, and support valuations.
How do you justify IEMG (Emerging Markets) given China's weakness?
By using the 'India Counterweight.' India is one of the fastest-growing economies (6.6%) and its domestic strength offsets China's weakness. China and other asian countries (Taiwan, Korea) are leaders in some tech components = boost
What is the valuation argument for IEMG (Emerging Markets)?
Emerging Markets are trading at a significant valuation discount compared to the more expensive, U.S. market.
Why are your projected returns below the benchmark if you aim to outperform it?
Our projections are intentionally conservative to avoid overpromising in a slower economy
The 7.7% is a base-case, reflecting slower growth and a slightly defensive positioning.
Tech: 10.07%, Industrials: 8.6%
We target risk-adjusted outperformance, not just higher nominal returns.
By managing downside risk and focusing on undervalued, high-conviction securities, we can outperform even if absolute returns appear slightly lower.
By taking less risk and protecting the portfolio during bad markets, our returns may be more stable so the strategy can outperform over time, even if the number looks slightly lower in a strong, risk-on market.
You generated a 20%+ return in 2025, driven by technology, defense, and industrials. How much of this return was due to: a) Asset/Sector Allocation versus b) Specific Security Selection?
Most of our 20%+ return was driven by proactive sector allocation, reflecting the success of our top-down investment approach.
Tech = 50% of gains, Industrials = 25% of gains
Within those sectors, security selection—hand-picking high-conviction names—provided additional alpha and amplified our results.
You note the consumer is under "intense pressure" and a "soft landing" is difficult. If the economy tips into a sharp recession, how would your 55% value / 45% growth mix perform? What is the single, most critical indicator that would force you to move to a more defensive asset allocation?
55% allocation to value stocks acts as a defensive anchor, because value stocks generally trade at lower multiples and have more resilient cash flows than growth stocks during downturns.
Growth would see some multiple compression, but higher-quality names still hold up.
Single most important trigger for a shift = a sustained unemployment rate above 5% with persistent inflation making it difficult for Fed to cut rates
Rotate into:
Fixed income: 5–10 yr Treasuries; short/intermediate investment-grade bonds
Equity sectors: Select healthcare and staples. Regulated utilities.
International: Defensive developed markets
You are "bullish" on Technology and allocate 45% to growth. However, your overall equity portfolio leans Value (55%). Why did you not tilt your portfolio more aggressively toward the growth side?
55% value/45% growth allocation is a deliberate, defensive choice based on macroeconomic caution.
Current market volatility—driven by shifting rates and consumer strain—makes a pure growth tilt highly susceptible to corrections.
The strategy captures structural upside from AI and semiconductors through a dedicated 45% growth allocation.
The 55% value allocation, focused on stable non-cyclical names and industrials, provides resilience and capital preservation.
![<ul><li><p class="my-2 [&+p]:mt-4 [&_strong:has(+br)]:inline-block [&_strong:has(+br)]:pb-2">55% value/45% growth allocation is a deliberate, defensive choice based on macroeconomic caution.</p></li><li><p class="my-2 [&+p]:mt-4 [&_strong:has(+br)]:inline-block [&_strong:has(+br)]:pb-2">Current market volatility—driven by shifting rates and consumer strain—makes a pure growth tilt highly susceptible to corrections.</p></li><li><p class="my-2 [&+p]:mt-4 [&_strong:has(+br)]:inline-block [&_strong:has(+br)]:pb-2">The strategy captures structural upside from AI and semiconductors through a dedicated 45% growth allocation.</p></li><li><p class="my-2 [&+p]:mt-4 [&_strong:has(+br)]:inline-block [&_strong:has(+br)]:pb-2">The 55% value allocation, focused on stable non-cyclical names and industrials, provides resilience and capital preservation.</p></li></ul><p></p>](https://knowt-user-attachments.s3.amazonaws.com/8d9c9614-b54c-497f-b2b5-12bc38e64da3.png)
Healthcare Outlook
We have an Underweight stance on Healthcare. Our caution is driven by declining sector-wide earnings growth, tariffs, expiring patents, and elevated political uncertainty around drug pricing (downward pricing), which introduces unquantifiable risk.
We chose to manage this risk by using the Vanguard Healthcare ETF (VHT) to provide us some defensive exposure while avoiding the stock-specific risk that currently exists
Why are we not invested more into consumer staples?
While consumer staples are typically defensive, recent sector underperformance and high valuations in discretionary stocks support our decision to underweight consumer staples. We have high conviction in our active management strategy to allocate capital in sectors with better growth resilience and valuation characteristics. Additionally, our fixed income and international exposures provide the necessary defensive hedge. This approach aligns with our goal of achieving outperformance in a challenging economic environment
In what precise combination of economic regimes would your current 60/30/10 asset allocation and its underlying sector bets perform most poorly against the benchmark?
If the economy experiences: 1) Rates staying higher for longer due to persistent tariff-driven inflation, causing our duration holdings to lose value and other sectors benefiting from potential cuts to decline.
More expensive borrowing for tech and other sectors cutting into profits.
Real Estate Outlook
Underweight direct Real Estate because the market is fundamentally frozen. Low affordability—driven by elevated rates and a severe supply shortage—means demand is weak and homeowners are refusing to sell their low-rate mortgages. We expect very slow improvement. We manage this necessary exposure passively, with a small holding in the SCHH REIT ETF to capture broad market beta.
Technology Outlook and why no bubble
Mag 7 stocks are fundamentally sound, generating outsized free cash flow, and engaging in buybacks and dividends
Strong balance sheets and funding with their own FCF
Demand is outpacing supply unlike dot-com era
Generative AI is expected to create trillions in economic value justifying the massive capex (GS)
AI still in early stages and advancing quickly
Real infrastructure is being built
Thoughts on AI circularity spending
See this primarily as strategic interdependence. Key players like Nvidia are fundamental suppliers to everyone. The huge capital being spent by firms like Google and others is backed by real, measurable demand for compute power and enterprises, driven by genuinely increasing user adoption of AI applications. We believe the underlying demand justifies the investment
Conditional contracts (NVDA will invest 100B in phases tied to milestones)
The circular investing is to construct real infrastructure - revenue generating assets
Customer-financing (help you build x so you can buy more x from us)
Outlook on Financials
Face pressure on Net Interest Income (NII) due to a slowing economy and potential interest rate cuts
Can diversify into fee-based income (IB, WM) and rising M&A activity
Can capitalize on adopting AI and digital payment solutions
Current admin benefits by loosening of rules/deregulation
Scotty Screener Factors
Value
P/E, P/BV, EV/EBITDA
Quality
D/E
ROE
EBIT Margin
Growth
2YR Rev Growth
2YR NI Growth
2 YR UFCF Growth
Compare these factors to industry avg
If the demand for AI slows due to a recession, how quickly does this interdependence become a vicious cycle where capex, infrastructure demand, and software growth all collapse simultaneously?
Adoption will slow but not collapse. AI is a necessity for productivity at this stage
Capex is locked in. Multi-year commitments/contracts that will be built out regardless
A full collapse requires a loss of faith in AI’s value but this is only the beginning of a long term adoption. Will turn to cost-reduction and more efficiency instead.
Why the 60/30/10 split?
60% U.S. equity reflects our conviction that structural drivers like AI investment and industrial spending will continue supporting U.S. markets.
We added 10% international exposure to reduce home-bias and improve diversification with lower-correlation markets.
30% fixed income provides stability and benefits from the current easing cycle, giving us both income and downside protection.
If the Fed cuts more slowly than expected, what part of your portfolio suffers most?
Most affected areas would be our interest-rate-sensitive assets
- Intermediate-duration fixed income and higher-duration active funds
- large-cap growth names: NVDA, MSFT, AVGO, GOOG would also face some valuation compression since their multiples are more sensitive to discount rates
However, our barbell structure, international, and value-tilted sectors like financials and energy help offset much of that risk
How tech is making money from AI
LLMs get rich from:
✔ selling intelligence ✔ selling access to intelligence ✔ selling tools that let enterprises use that intelligence (contracts w/ enterprises and implementations)
Hyperscalers get rich from:
✔ renting the compute that makes the intelligence possible ✔ selling every layer around it (storage, networking, databases, AI tooling)
NVIDIA gets rich from:
✔ enabling all of it with the only GPUs capable of this scale
How do you justify OpenAI’s $1T commitments with only 13B revenue
Because most of the spending is Microsoft’s Azure capex, not OpenAI’s opex. Azure gets long-life GPU/data-center assets that generate recurring cloud revenue as OpenAI run training on Azure. Frontier AI is infrastructure-like with winner-take-most scale advantages, so the spend builds a durable competitive moat and future cash flows from enterprise + government AI adoption.
Energy Sector Outlook
Oil prices volatile with inc. risks due to oversupply. Geopolitical impacts.
Nuclear energy and renewables gaining traction to meet energy demand
Natural gas poised to grow driven by data center demand
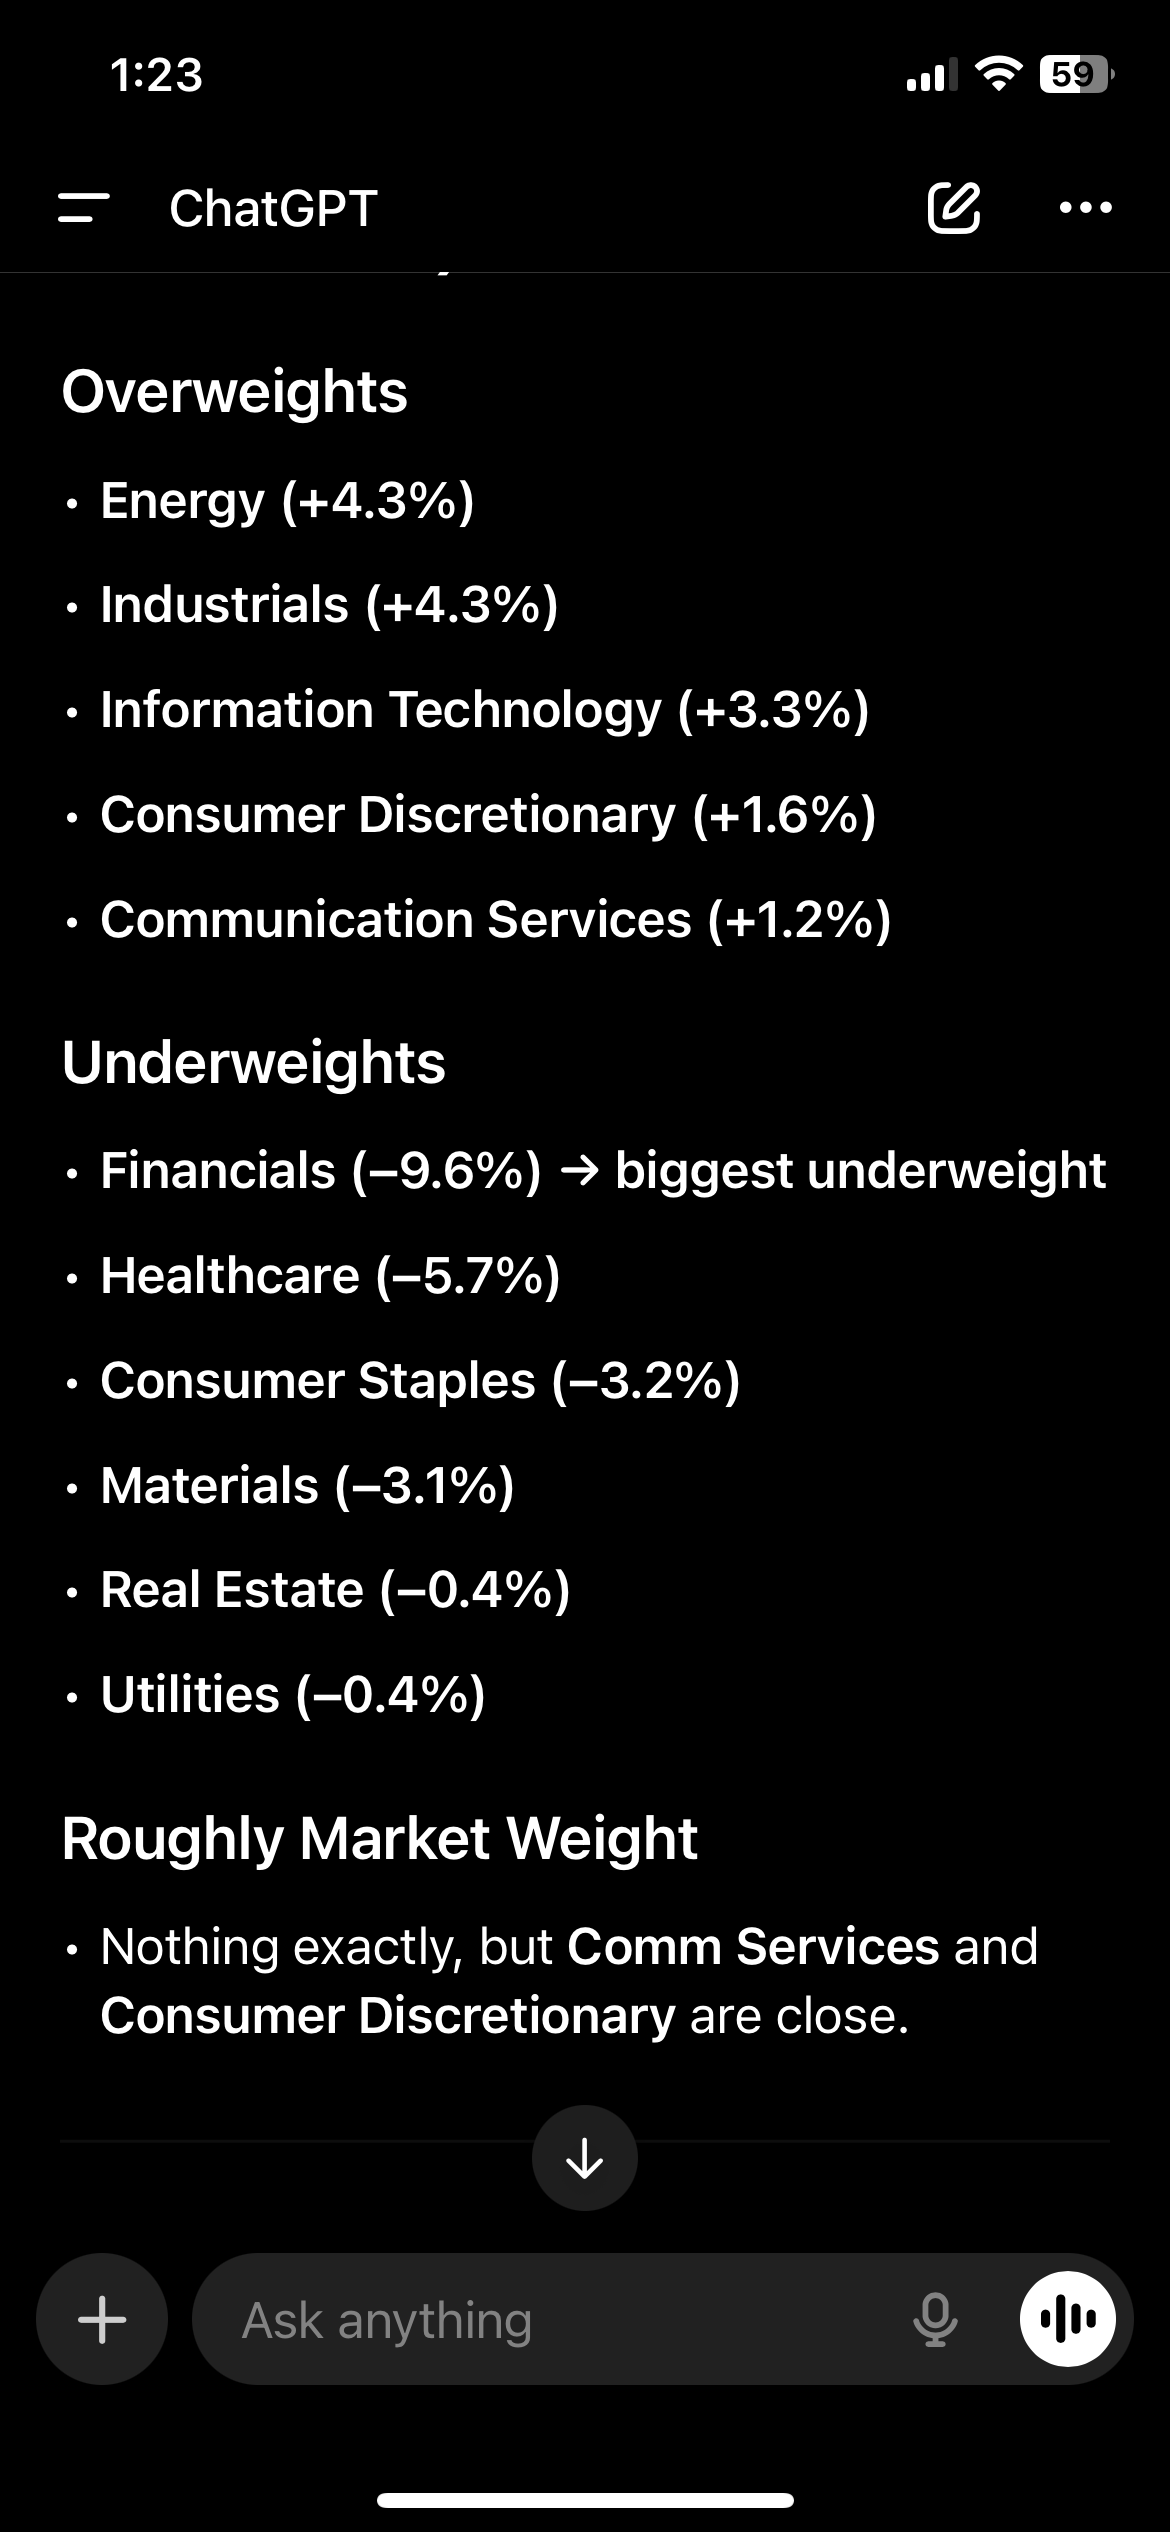
Sector Weightings vs. Benchmark and why
Our portfolio tilts toward Information Technology, Industrials, and Energy because that’s where we see the most attractive risk-adjusted opportunities. Tech and Industrials capture long-term structural growth—AI, automation, reshoring—while Energy provides inflation protection and stable cash flows.
We’re underweight Financials and Healthcare because valuations look less compelling, and we prefer not to take on the cyclicality and regulatory risk currently embedded in those sectors. Our goal is to differ from the benchmark only where we believe we’re being compensated for the risk
What is J.P. Morgan’s overall view on AI in the 2026 Outlook?
AI is a general-purpose technology driving a multi-year global supercycle.
We are still early, with demand for compute far ahead of supply.
AI is now a major driver of capital expenditure, productivity expectations, and long-term economic growth.
How big is the AI + data-centre investment cycle?
JPM estimates $5–7 trillion of global spending over 5 years.
Hyperscaler capex is projected to reach hundreds of billions per year.
Power, land, and grid capacity are the main bottlenecks, not demand.
The build-out is global and touches chips, compute, data-centres, power equipment, and energy infrastructure.
How does JPM think AI affects the economy?
Data-centre investment alone may lift U.S. GDP 10–20 bps per year.
AI adoption is early but accelerating; only ~10% of firms fully deploy it.
AI likely provides a positive long-term boost to productivity (TFP).
Costs of training and running models are falling, speeding adoption.
How does today’s AI infrastructure cycle differ from the dot-com bubble?
Unlike dot-com overbuilt fiber and weak monetization, today every GPU is immediately used, and AI monetization (consumer apps, enterprise workflows, robotics, autonomous driving) is already growing.
Justification for 0% allocation in materials
Why
Very cyclical and tied to slowing economic growth.
We evaluated it, but risk/reward isn’t attractive right now.
Why That’s Not Contradictory With Industrials
Our Industrials overweight is in secular drivers (data centers, power equipment), not broad cyclicals.
Materials depends on commodity demand, Industrials exposure depends on AI-driven capex.
Industrials = structural growth; Materials = cyclical weakness
Why AZO
Consistent same store sales growth
High ROIC
Performs well during recessions
Share repurchase plan executed flawlessly
“Growth” stock cuz store expansion
How NVDA, MU, AVGO differ in AI
NVIDIA makes the AI brains.
Micron provides the high-speed memory that lets those brains function.
Broadcom builds the networking and custom chips that tie everything together into an AI supercomputer.
Why do we use 10-year treasury instead of 3-month T-bill for risk free rate
CAPM measures the long-term required return on equity. Even if our price target is 1–2 years out, a stock is a long-duration asset with cash flows that extend decades into the future. Consistent with Damodaran’s calculations and methods.
Why energy and tech aren’t directly impacted by the same risks
Energy/Utility headwinds also impact tech.
AI buildout ultimately depends on the same constrained grid.
But:
Earnings impact is direct for Energy/Utilities and indirect and more flexible for Tech.
AI-driven revenue for Tech exists today
Tech can improve efficiency, shift to other alternative power sources (BESS, VPP)
Utilities are bound by regional monopolies and regulatory
Why HESM Has Underperformed
Lower drilling by Chevron → reduced future volume growth, trimmed guidance, delayed projects, and weaker energy sentiment.
Communications Sector Outlook
Bullish because even in downturns, connectivity remains essential, demand is stable, and long-term trends like 5G and AI-driven network capacity needs for datacenters continue to strengthen the sector. Advertising will hold strong.
GOOG & META to hold strong given strong balance sheet
Both major players in AI
Historically they can gain advertising share in downturns as smaller players decline