Key Science Skills
 Call Kai
 Learn
Learn Practice Test
 Spaced Repetition
 Match
Match Flashcards
 Knowt Play
1/95

There's no tags or description
Looks like no tags are added yet.
Name | Mastery | Learn | Test | Matching | Spaced | Call with Kai | Chat |
|---|
No analytics yet
Send a link to your students to track their progress
96 Terms
research question structure
"What is the effect of [IV] on the [DV] in [Population]?"
Aim structure
"To investigate the effect of [IV] on [DV] in [Population]."
Hypothesis structure and example
"It is hypothesised that [Population] who [IV - Group 1] will [Direction] in [DV] compared to [Population] who [IV - Group 2/Control]."
IPAD
Independent variable and dependent variables
Population
and
Direction
It was hypothesised that Australian females aged 12–16 who experienced partial sleep
deprivation would be more likely to also experience low mood than those who did not
experience partial sleep deprivation.
Independent variable
The variable that is manipulated, changed, or controlled by the researcher.
It is assumed to have a direct effect on the dependent variable.
Dependent Variable
The variable that the researcher measures.
It is observed to see how it changes in response to the IV.
Placebo
an inactive substance or treatment
placebo effect
when participants respond to an inactive substance/treatment as a result of their expectations + beliefs
controlled variables
variables other than the IV that a researcher holds constant in an investigation, to ensure that changes in the DV are solely due to changes in the IV
Controlled Experiment
A type of investigation used to test a causal relationship between an IV and DV in a controlled environment
Strengths:
Allows researchers to conclude that the IV directly caused the change in the DV
Limitations:
conducted in highly controlled setting → doesn't reflect "real life."
may cause participants to act unnaturally
Between-Subjects Design
Different participants are randomly allocated to either the control or experimental group
Strength: No order effects
Limitations:
Requires more participants
participant differences can affect results
Within-Subjects Design
Each participant is in both the control and experimental groups.
Strength: Eliminates participant-related variables (everyone acts as their own control); requires fewer people.
Limitation: Prone to order effects (boredom or practice).
Mixed Design
Combines elements of both within and between-subjects designs (e.g., testing two different groups over time).
Strength: Allows researchers to see both differences between groups and changes over time.
Limitation: Can be complex and costly to implement.
Case Study
An in-depth investigation of an individual, group, or event.
Strength: Provides rich, highly detailed data; useful for rare phenomena
Limitation: Results cannot be generalised to the wider population
Correlational Study
Observes the relationship between two variables without manipulating them
Strength:
Can be used when experiments are unethical
identifies trends and relationships.
Limitation:
Correlation does not equal causation
Fieldwork
Gathering primary data in a natural setting
Strength: High ecological validity (behaviour is natural).
Limitation:
Difficult to control extraneous variables
can be time-consuming.
Literature Review
Collating and analysing secondary data from existing research.
Strength: Provides background for new research
Limitation: can be time-consuming to find relevant sources.
Modelling & Simulation
Creating physical or conceptual representations to predict reality.
Strength: Allows for testing of theoretical scenarios safely.
Limitation: can never fully capture the complexity of the real-world
Product, Process, or System Development
Designing something to meet a human need
e.g. a new mental health app
Strength: Directly applies psychological theory to solve real-world problems.
Limitations:
doesn’t necessarily test a broad psychological theory
doesn’t establish cause-and-effect.
Population vs. Sample
Population: The entire group of interest from which the sample is drawn (e.g., all VCE students).
Sample: A smaller subset or group that is actually chosen from the population to participate in the study.
What makes a sample Representative versus Biased?
Representative: accurately reflects the relevant characteristics of the population
e.g. same ratio of ages/genders
Biased: does not accurately represent the population
e.g. only testing girls when the population is all students
Convenience Sampling
Selecting participants based on their availability and readiness to participate
Strengths:
Quick
easy
Inexpensive to perform.
Limitations:
Likely to produce a biased sample
results cannot be easily generalised
Random Sampling
Every member of the population has an equal chance of being selected
Strength: Reduces bias- more likely to be representative than convenience sampling.
Limitation:
Can be time-consuming
May accidentally miss small sub-groups by chance.
Stratified Sampling
Definition: Dividing the population into distinct sub-groups (strata) based on shared characteristics, then selecting a sample from each stratum in the same proportion as they exist in the population.
Strength: The most representative method; ensures all sub-groups are accurately represented.
Limitation: Very time-consuming and expensive to identify and calculate sub-groups.
Differentiate between Sampling and Allocation.
Sampling: The process of choosing people from the population to be in the study. (Population →Sample).
Allocation: The process of assigning the chosen participants into groups within the experiment (e.g., Experimental group vs. Control group)
Random Allocation
when `each person has an equal chance of being in the experimental or control group
Experimental Group
Exposed to the Independent Variable (the "treatment" or "intervention").
Control Group
Not exposed to the IV; provides a baseline to compare the experimental results against
Identification Example: In a study on caffeine and memory:
Experimental: Group drinking 2 cups of coffee (IV).
Control: Group drinking plain water (No IV).
Extraneous Variable
Any variable other than the IV that may cause an unwanted effect on the DV.
They should be controlled or monitored.
Confounding Variable
A variable other than the IV that has directly and systematically affected the DV.
can only be identified at the end of an experiment
Participant Variables
Personal characteristics of the participants (e.g., age, intelligence, prior experience, mood).
Example: In a memory test, one participant naturally has a better memory than another.
Situational Variables
Factors in the environment that can affect the results
(e.g., background noise, temperature, time of day).
Systematic Errors
Errors that differ from the true value by a consistent/predictable amount (e.g., a scale always being 100g light).
Affects: Accuracy
Random Errors
Unsystematic errors that occur due to chance and vary unpredictably
e.g. a participant being momentarily distracted
Affects precision
How can extraneous variables be reduced, prevented, or accounted for?
Random Allocation
Single-Blind Procedure
Double-Blind Procedure
Uncertainty
The lack of exact knowledge of the "true" value of the quantity being measured.
All data has some uncertainty due to errors.
Outliers
Data points that differ significantly
can distort the mean and increase uncertainty.
Repeatability
the closeness of results when the same researcher repeats the experiment under the same conditions.
Reproducibility
the closeness of results when different researchers conduct the experiment using different equipment or settings to test the same hypothesis.
Internal Validity
Does the study actually measure what it claims to measure? - was the change in the DV only caused by the IV
External Validity
Can the results be generalised to the wider population or other settings?
Robust
having valid and reliable data despite small changes in the conditions or errors.
Improvements to reduce uncertainty in data and avoid errors
Increase Sample Size
Standardise Procedures
Refine Measurement Tools
Informed consent
Participants should be informed of the nature, purpose and risks involved with a study prior to giving their consent to participate
Under 18- must be provided by legal guardian
usually provided in writing.
Beneficence
The consideration of the benefits or gains from research in relation to the risks (MAXIMISE benefits and MINIMISE risks/harm)
Non-maleficence (also known as the no-harm principle)
the idea that any potential harm should be avoided and minimised as much as possible
Integrity
the commitment to search for knowledge, and then honestly report information and findings.
Justice
The distribution of fair access to the benefits of research to everyone,
ensuring that there is no burden on one group,
and ensuring that any opposing claims are considered.
Respect
the belief that everyone has value in regards to their welfare and beliefs,
and has a right to make their own decisions.
Withdrawal rights
Participants have the right to:
withdraw from a study at any time
elect to have their results withdrawn from a study.
Voluntary participation
Participants must not be coerced or forced into participating, and must do so freely.
There must not be adverse consequences for choosing not to participate.
Confidentiality
Participants names or identifying details must not be revealed.
*Deception
When the true nature or purpose of a study is not revealed to participants, it must be because doing so would undermine the results
If deception is used, debriefing MUST occur to explain the true nature/purpose of the study, and why the deception was necessary.
Debriefing
participants should be told of the results of a study after its completion
participants may be offered counselling
participants are allowed to have their results removed
Primary data
Data that is sourced first-hand.
Secondary data
Data that is sourced through someone else’s research.
Primary data strengths
specific + detailed
Inform future research
current
Primary data weaknesses
greater cost involved
greater sample size restrictions
Secondary data strengths
Cheap, easy to obtain
Large amounts available
Secondary data weaknesses
Might not be up to date
May not be specific to research
Quantitative data
Data that are numerical and categorical.
Quantitative data strengths
Easy to compare values between participants or groups
Quantitative data weaknesses
Some psychological data can be difficult to quantify.
Qualitative data
Data that are descriptive.
Qualitative data strengths
Can be a rich source of data on people’s thoughts, feelings and observations on behaviour
Qualitative data weaknesses
can be difficult to compare.
Subjective data
Data that relies on assumptions or personal experience.
Subjective data strengths
offer nuanced, qualitative understanding
Subjective data weaknesses
high variability, cognitive biases
Objective data
Data that can be directly observed or measured.
Objective data strengths
enhances the consistency and validity of research
Objective data weaknesses
can lack depth and nuance
failure to capture the subjective human experience
Mean
The ‘average’ score
Add all scores together and divide by the number of pieces of data.
Mean usefulness
Large amounts of data, even distribution of data around the centre
Mean disadvantages
when data values are widely distributed, the data set is likely to be influenced by outliers.
Median
The ‘middle’ score: Place all scores in order and find the centre
Median usefulness
When there are outliers= less likely to be influenced
When data is not evenly distributed around the centre
Median disadvantages
May not be representative in datasets with large gaps or uneven distributions.
Mode
The most ‘frequent’ score:
Tally the number of times each score appears.
Mode usefulness
Identifying patterns in categorical/numerical data
identifying the most common and frequently occurring value.
Mode disadvantages
may not exist, may be multiple
standard deviation
The variability of a set of values within a group, indicating how narrowly or broadly they deviate from the mean
High standard deviation→ greater the range of values
Low standard deviation → scores are clustered around the mean
how to label data tables
IV goes in the first/left hand column
DV goes in the second/right hand column
Why?
because the IV is what you’re changing or categorising, and the DV is what you’re measuring as a result
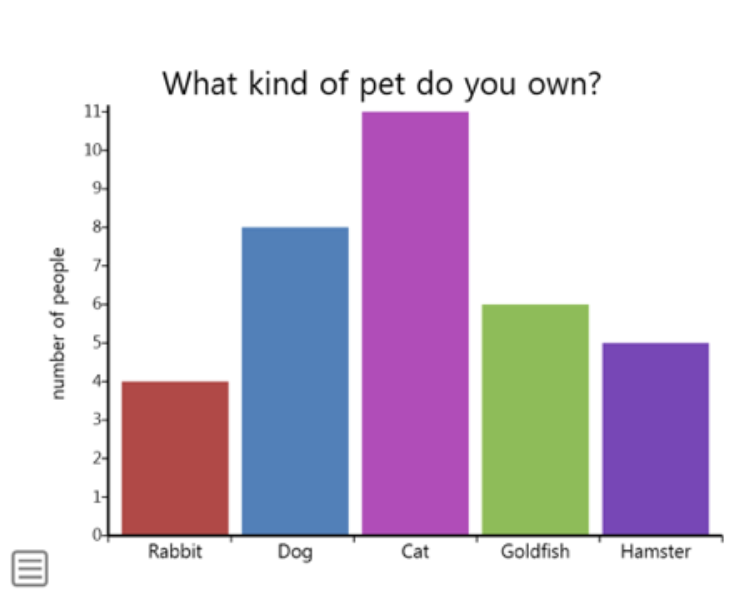
Bar charts
a good way to show comparisons between groups.
They require:
Title
Labelled axes
Accuracy
IV= x axis
DV= y axis
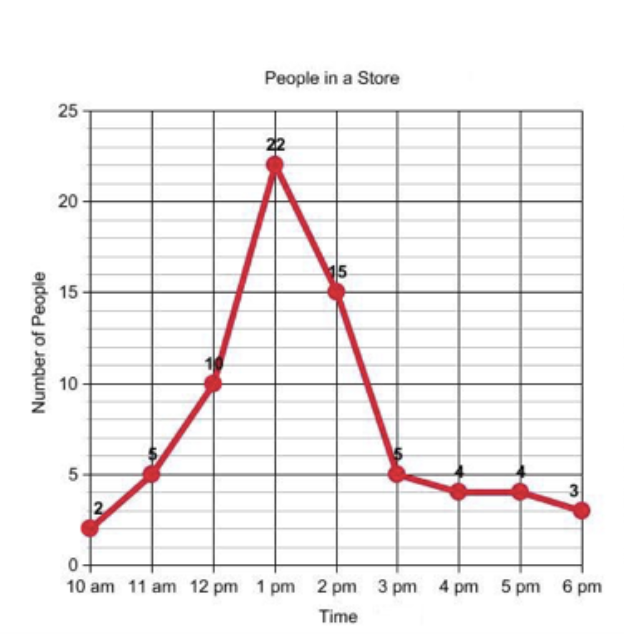
Line graph
a good way to show trends over time.
They require:
Title
Labelled axes
Accuracy
IV= x axis (time)
DV= y axis
Percentage change

Operationalised IV
Specific details of the IV
include a comparison statement to describe all conditions being compared.
Counterbalancing
A procedure used to control for order effects in within-participants designs
Single blind procedure
When participants are unaware if they are taking the placebo or active medication
Double blind procedure
When both the participants and the experimenter are unaware of which participants are receiving the placebo treatment
Conclusion
Include:
whether the hypothesis was supported or rejected
results
what the study suggests(relationship b/w variables)
whether further evidence is required
Reliability
the extent to which a study produces consistent results.
replicating studies tests reliability
Anecdote
a story based on personal experience
Classification
the arrangement of phenomena, objects, or events into manageable sets
Identification
a process of recognition of phenomena as belonging to particular sets or possibly being part of a new or unique set
Classification and identification strengths & limitations
Strengths
Provides common language to communicate about scientific phenomena.
Helps to simplify, explain and describe complex phenomena.
Limitations
Can over-simplify reality.
Labels can be inaccurate + create bias.
True value
the value, or range of values, that would be found if the quantity could be measured
perfectly