Effects Sizes & Precision
1/15
There's no tags or description
Looks like no tags are added yet.
Name | Mastery | Learn | Test | Matching | Spaced | Call with Kai |
|---|
No analytics yet
Send a link to your students to track their progress
16 Terms
Estimation
The process of using sample data to find an approximate value of the population parameter that we don’t know.
To make estimates about how theories work
Based on accuracy (truth) and precision (detail).
More precision does not always mean more accuracy. Very precise estimates can sometimes be less accurate if they are unrealistically specific.
Example:
If a student usually scores between 80–85% on tests:
Predicting they will score “around 82%” may be a good estimate.
Predicting they will score “82.347%” is more precise, but probably less accurate because it is unrealistically exact.
Theoretical Construct
An abstract idea or concept that cannot be directly observed or measured, but is used to explain and understand behaviour
Parameter
Population parameter are theoretical constructs and apply to all possible individuals in a population.
μ, σ
Sample is a subset of population individuals, the people we observe or ones that actually come into the lab
x̄, s
We use these measurements to make an estimate of our population
Non-Responders Bias
Some people don't want to take part, even when it is randomly chosen
The people who don't answer could have other views/new data, without knowing their answers it may lead to bias
Example: A stress survey is emailed to students, but highly stressed students are too overwhelmed to reply. The results may underestimate stress levels. (underrepresent)
Self-Selection
Survey topic can encourage some responders and prevent others
People choose for themselves whether to participate, causing certain types of people to be overrepresented
Example: A survey asks people if they enjoy school, but mostly students who like school choose to answer. (overrepresent)
Convenience Sample
Samples that you can get easily
Problem: sample might be biased, it may not represent the whole population (northern climate squirrel vs southern)
Random Sample
Equally likely to be selected
Reduces bias, but a truly random sample is hard to achieve
Sampling Error
The difference between a population parameter and sample statistic.
It happens because only some people from the population are chosen for the sample.
Example: If the average height of all students in a school is 170 cm, but a random sample of 20 students has an average height of 168 cm, the 2 cm difference is the sampling error.
If the sample does not represent the population well, the conclusions may be inaccurate.
Measurement Precision
Measurement instrument/tool is a critical element in the ability to make inferences about the population
Measurements should be detailed enough for the study and avoid unnecessary error
Non-Sampling Errors
Measurement Error | Calculation Error | Error of Misinterpretation |
|
|
|
Point Estimate
A single value used to estimate a population parameter.
sample mean
sample median
sample standard deviation
correlation coefficient
Unbiasedness
The average value equals the population value
The mean is unbiased estimator because it is equally likely to overestimate or underestimate the population mean μ
Standard deviation is more biased because it’s more likely to underestimate the σ.
Efficiency
How much an estimator is spread out across samples (less variance/smaller spread = more efficient).
In a skewed distribution, the median may be a better estimator than the mean because it's less sensitive to outliers
The one (any point estimate) with the smaller variance is more efficient
Interval Estimate
The size of the interval depends on how confident we want to be
Narrow range = greater precision than those with wider range
We find the upper and lower boundaries of an interval that might contain the population parameter
How confident/certain we are depends on the percentile of the distribution we choose
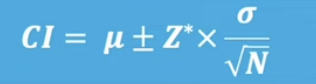
We often calculate 95% confidence interval (CI)
It means we are 95% sure that the mean is within the calculated interval
If interval is too wide, it becomes uninformative
Two ways to estimate the population parameter
Calculated using a formula
Conditions for CI to be accurate:
Sample is truly a random sample
Sample is normally distributed
Scores are independent (no relationship between scores)
You CAN be 95% confident that the interval contains the parameter (not CERTAIN)
Bootstrap Resampling
Repeatedly sampling from an existing sample.
Start with a sample from the population
Then resample with replacement many times
Each resample is used to calculate a statistic (e.g., mean)
This creates a distribution of sample means (DOSM)
Use this distribution to build confidence intervals (CI)
Effect Size
Effect size is a measure of how strong or large a relationship or difference is between variables.
Tells us if the treatment is effective
How one group differs from another
Relationship between two variables