m&m ch 12 quiz
1/32
There's no tags or description
Looks like no tags are added yet.
Name | Mastery | Learn | Test | Matching | Spaced | Call with Kai |
|---|
No analytics yet
Send a link to your students to track their progress
33 Terms
Product Features
tangible and intangible qualities that a company builds into its products
Value Package
a product is marketed as a bundle of value-adding attributes, including a reasonable cost
Consumer
person who purchases products for personal use
Industrial Buyer
a company or other organization that buys products for use in producing other products (goods or services)
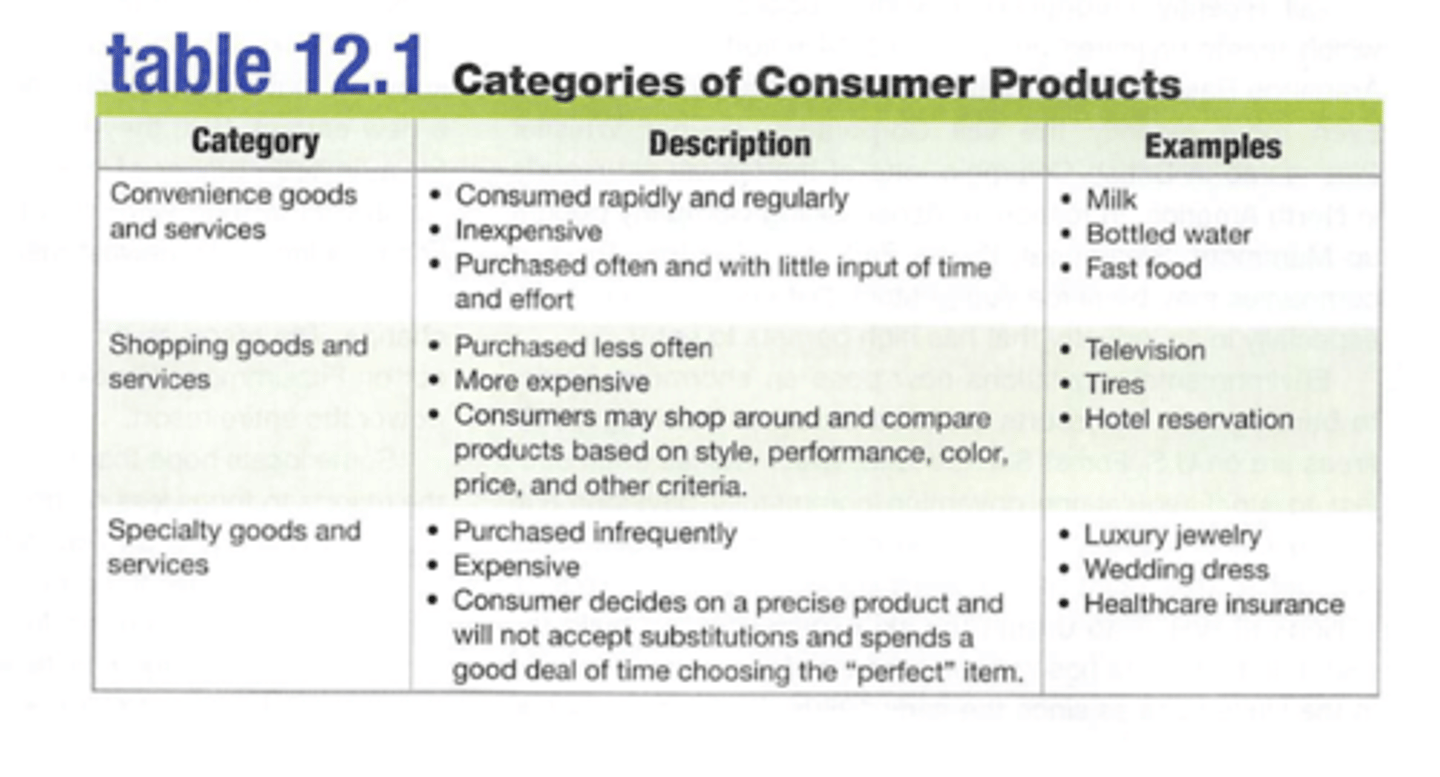
Convenience Goods and Services
inexpensive physical goods and services that are consumed rapidly and regularly
Shopping Goods and Services
moderately expensive, infrequently purchased physical goods or services
Specialty Goods and Services
expensive, rarely purchased physical goods and services
Table 12.1 Consumer Products
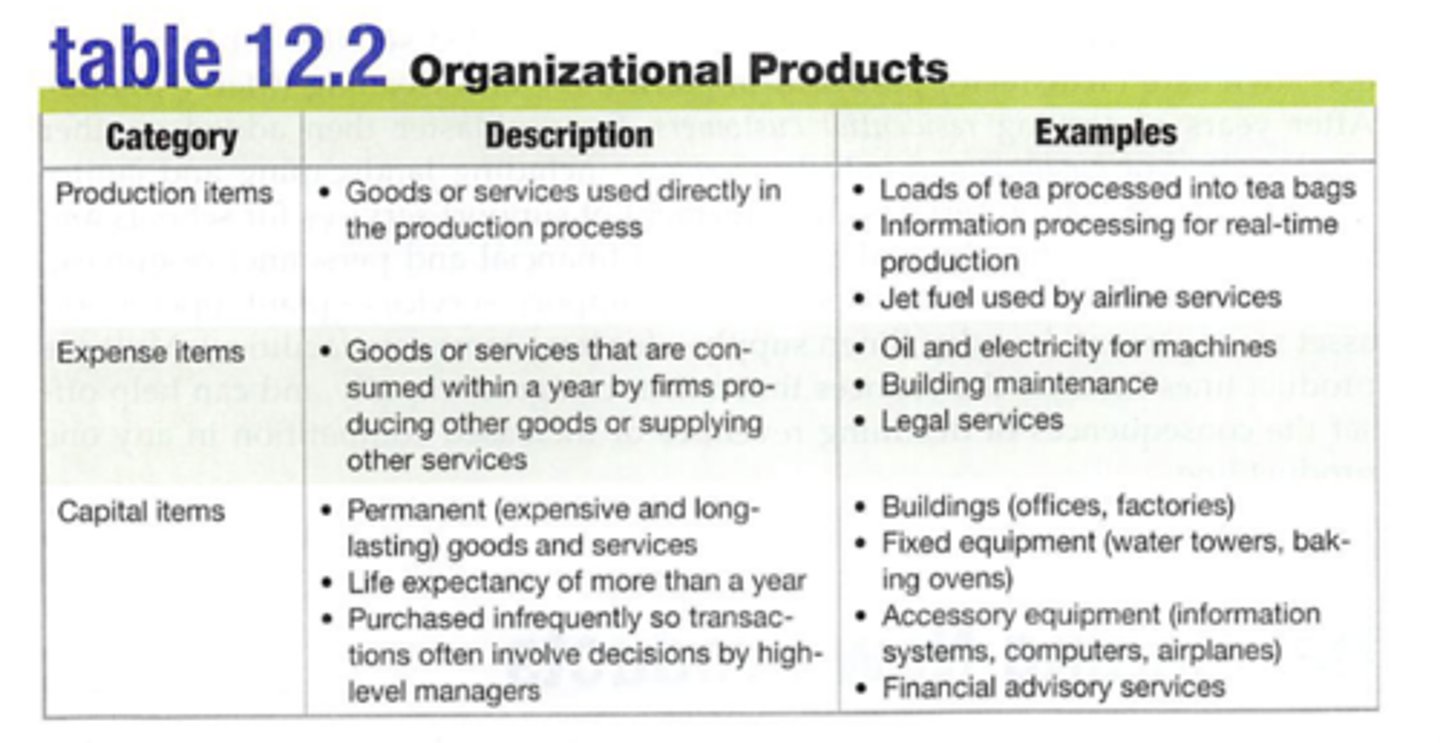
Classifying Organizational Products
- Production items
- Expense items
- Capital items
Production items
goods or services that are used in the conversion (production) process to make other products
Expense Items
industrial products purchased and consumed within a year by firms producing other products
Capital Items
expensive, long-lasting, infrequently purchased industrial products, such as a building, or industrial services, such as a long-term agreement for data warehousing services
Table 12.2 Organizational Product
The Product Mix
-The product mix
-product line
Product Mix
groups of products that a firm makes available for sale
Product Line
a group of products that are closely related because they function in a similar manner, or are sold to the same customer groups who will use them in similar ways
Portfolio Analysis
- Management's evaluation of the products and businesses that make up the company
- Direct resources toward more profitable businesses and phase down or drop its weaker ones
Boston Consulting Group Matrix (BCG)
Method of analyzing the product portfolio of a business in terms of market share and market growth
- Analyze performance and current position of existing portfolios
- Planning action to be taken with existing products
- Planning introduction of new products
Market share
the percentage of sales in the total market sold by one business
Market growth
The percentage change in the total size of a market (volume or value) over a period of time.
Invest
grow the product
Milk
use the cash flow to invest in other products
Build
selectively invest
Divest
exit, sell or replace product
Product Positioning
how a new brand will relate to other brands in the market in the minds of consumers
Product Position Map/Perception Map
a graph that analyses consumer perceptions of each of a group of competing products in respect of two product characteristics
Uses for Product Position/Perception Map
The product position/perception map may be used to analyze
- Potential gaps in the market
- 'Niche' potential for products
- Opportunities for repositioning
Differences in the Process for Services
Differences in the development of Services
1) Service Idea
2) Screening
3) Concept testing
4) Business analysis
5) Services process design
6) Product testing and test marketing
7) Commercialization
(only 1 and 5 are different)
1. Service Idea
Defining the service value package, identifying tangible and intangible features, and stating service specifications
5. Service process design
1. Process selection
2. Worker requirements
3. Facility requirements
Process Selection
identifying each step of the service, including sequence and timing
Worker Requirements
stating employee behaviors, skills, capabilities, and interactions with customers during service performance
Facility Requirements
Designate all equipment that supports delivery at the service