6: OCT of the optic nerve head
1/41
There's no tags or description
Looks like no tags are added yet.
Name | Mastery | Learn | Test | Matching | Spaced | Call with Kai |
|---|
No analytics yet
Send a link to your students to track their progress
42 Terms
what is the optic nerve head ONH
the point of exit for retnal ganglion cell axons leaving the eye ( forming the optic nerve as they pass through the onh)
most anterior portion of optic nerve
ganglion cells spread out whole retina and project axons in bundles across retina and they all head for onh
entr and exit point for major retinal arteries and veins
ong anatomy
avrage of around 1.8mm diaeter
margin on outisde followed by NRR . margin represents a break in the retina, all layers stop and no photoreceptors = blind spot
NRR is the nerve fibre ganglion cells coming into the onh from the retina
cup is simply the gap in between the nerve fibre bundles as they splay out
larger deper cups- will see the lamina cribose ( the holes)
why do we examine the onh
shows sings of sight threatening eye diseases eg glaucoma, optic neuritis, anterior ischaemic optic neuropathy and optic atrophy
swelling of the onh can indicate life threatnening condition eg raised intracranial pressure, cerebrospinal inflammation, tumpurs and malignant hypertension
some things to look for/ record
margins- are they distinct or not
cup to disc ratio
NRR intact all the way around?
NRR perfusion- does it look pale
prescence of RNFL defects in surrounding area
haemorrhages
prescence of peripapillary atrophy PPA
how can we image the onh and surround?
funsus photography- images for colour and haemorrhages
confocal scanning laser opthalmoscopy HRT
scanning laser polarimetry GDx
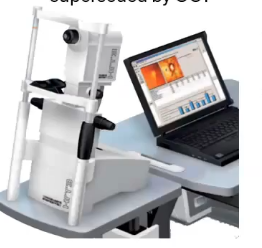
optical coherence tomography OCT
confocal scanning laser opthalmoscopy HRT
older method to image and quantify onh and peripapillary RNFL
measured height of the retina at many points
mesured surface topography
would define where the disc was and a reference plane within it and anything below it would be cu anything above would be the rim
scanning laser polarimetry GDx
measured birefringence of RNFL- estimated thickness of nerve fibre layer
lower resolution
no longer commercially available
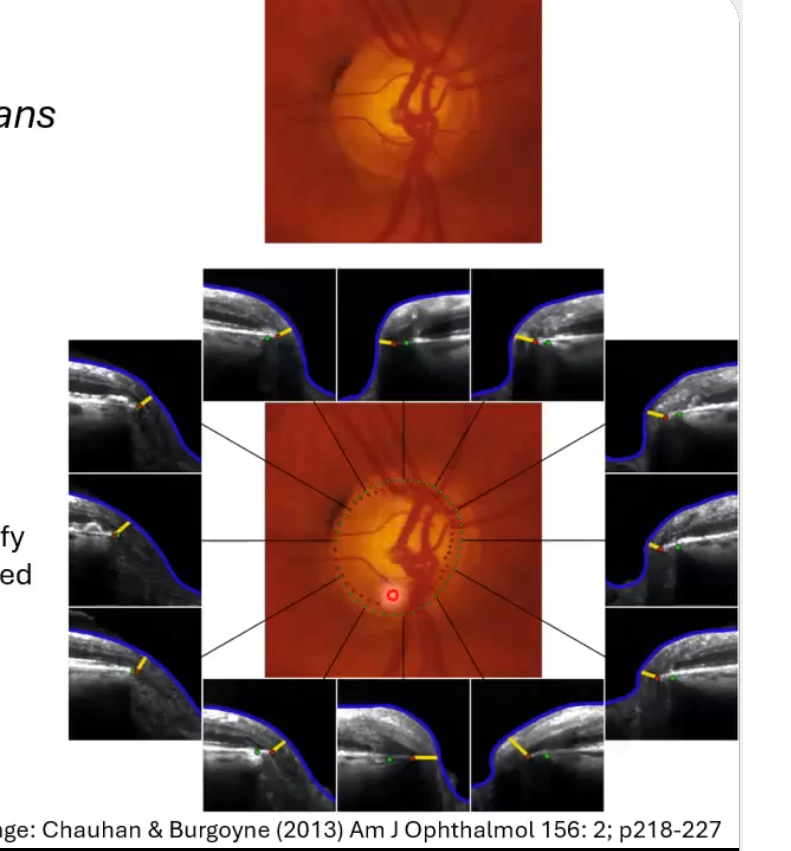
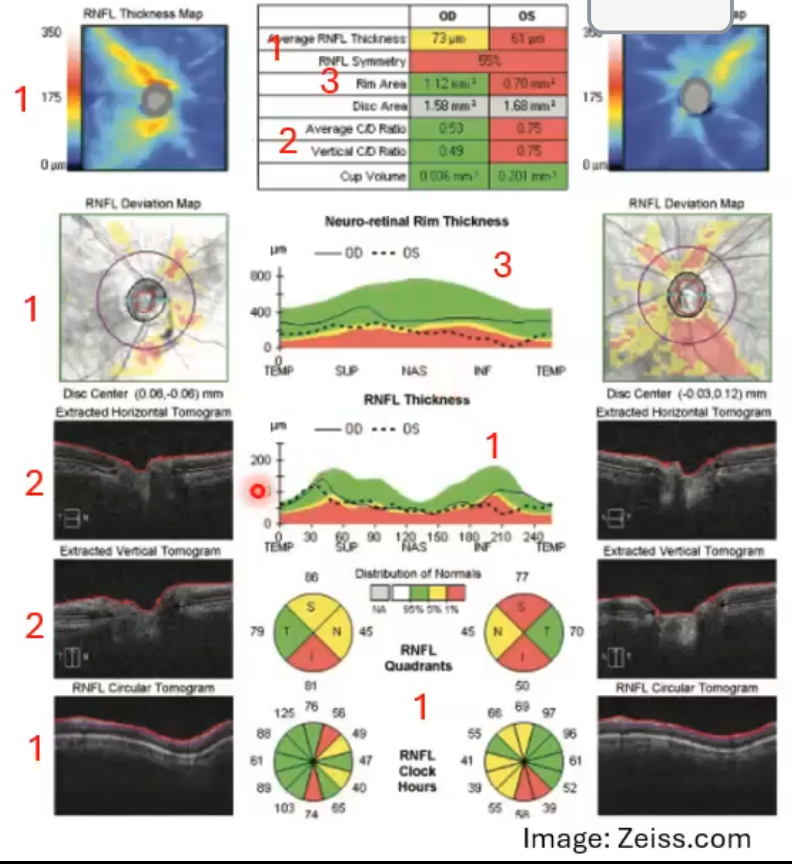
OCT scans of the ONH (1): optic disc cube
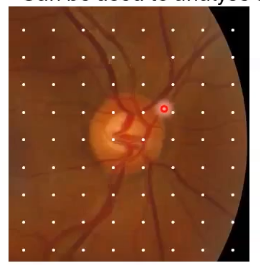
A scans taken, using a raster scan approach capturing the disc and peripapillary area
building up like a 3 cube
typically around 200 × 200, 6mm x 6mm on the retina
can be used to analyse disc topography and surrounding RNFL thickness
measurements of rim/disc area, C/D ratio, cup volume
horizontal and vertical scan through onh centre
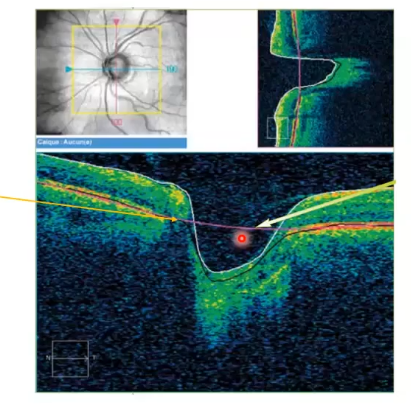
(1) /; otpic disc cube; onh topography analysis
defines a point, anythign deeper is cup anything above is rim
for analysis the cup is anything below the reference line
reference line is set 150 micrometeres above the adjacent retinal pigment epithelium- this is completely arbitary, not a reason why it is placed at that point
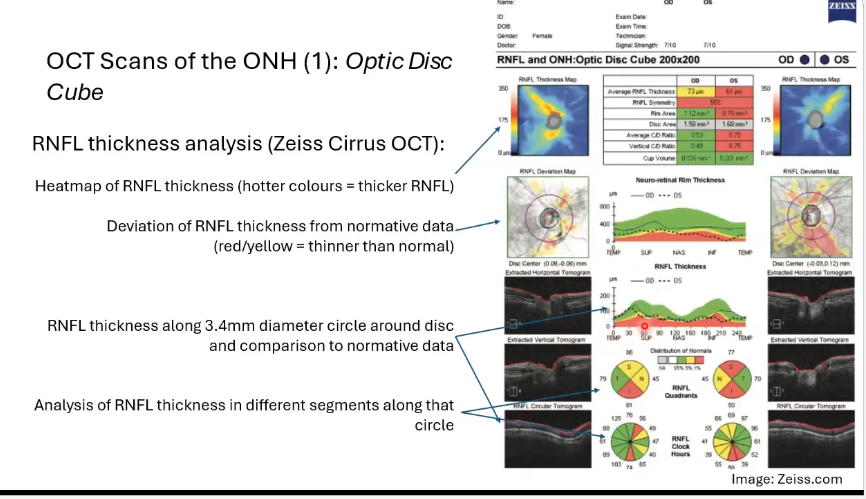
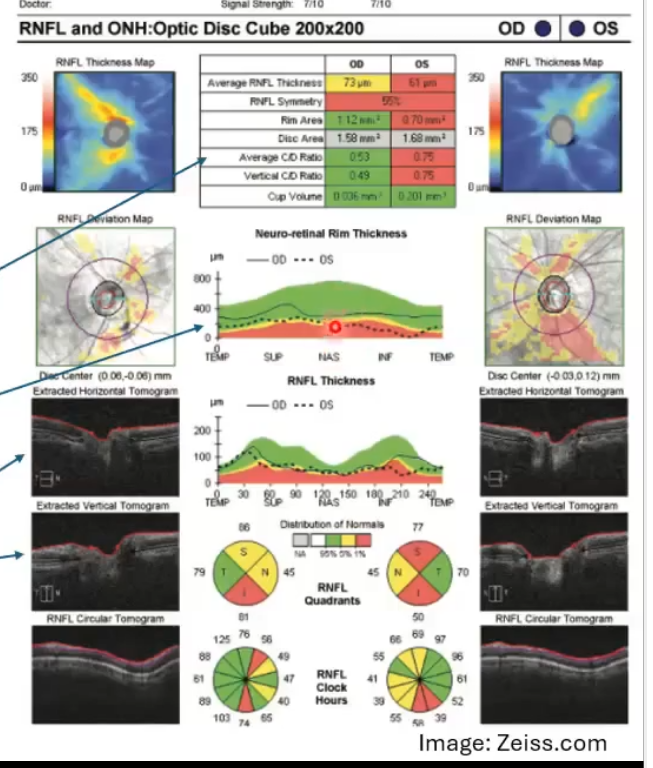
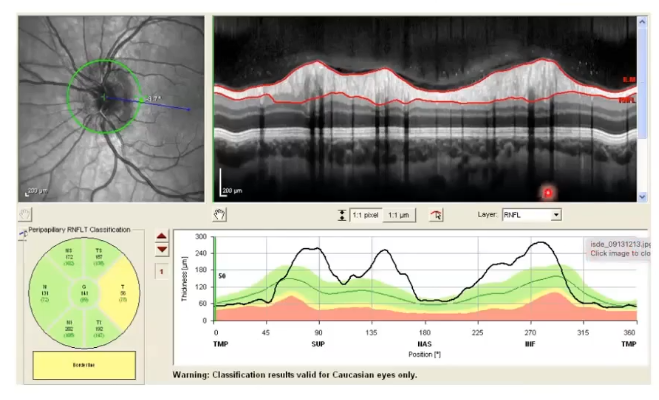
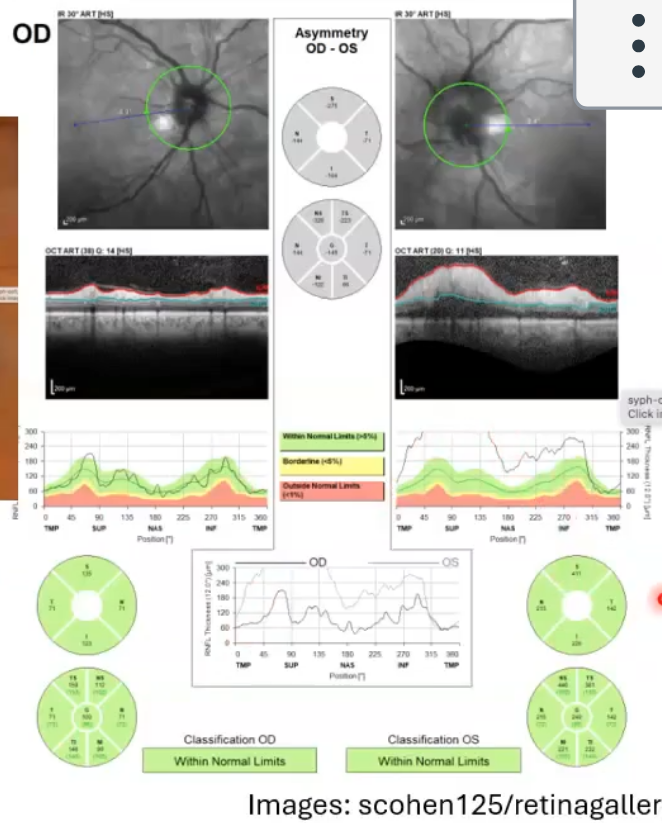
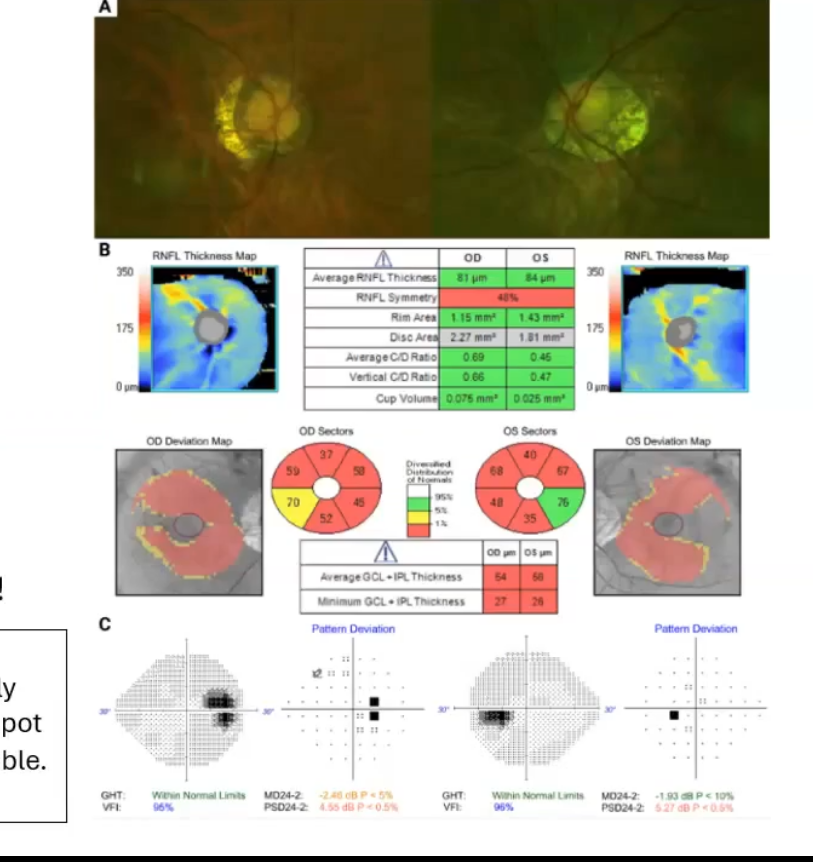
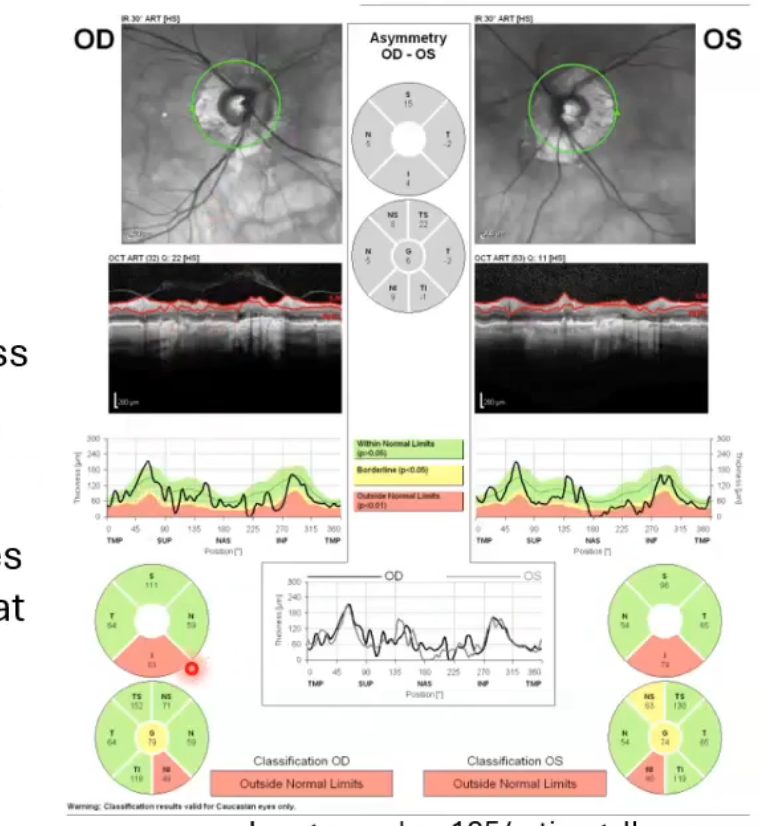
RNFL thickness analysis of the optic disc cube
heat map of the rnfl thickness . hotter colours indicate thicker rnfl
deviation of the rnfl thickness form normative data: red/yellow = thinner than normal
rnfl thickness along 3.4mm diameter circle around disc and comparison to normative data
analyisi of rnfl thickness in different segments along that circle
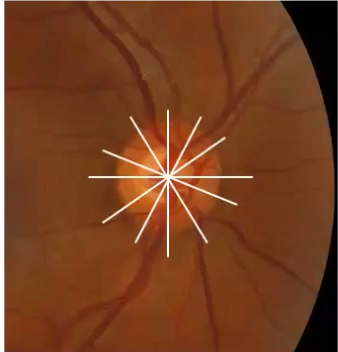
oct scans of the onh (2): BMO scans
6 radial B scans through the onh
b scan along each of the white lines
identify bruchs membrane opening as edge of onh
used for identifying minimum rim width around disc
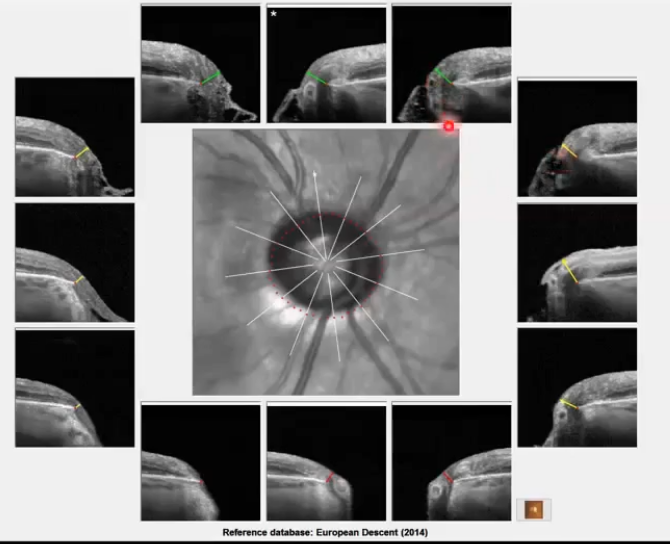
BMO scans for assessing nrr
bright line with red dot at end of it whih is the end of bruchs membrane
so everything inside that is part of the onh
has ideniftied minimum distance between red dot ( bruch membrane ending) and top of the nerve fibre layer
sometimes the subjective disc margin ( green dots) does not correspond to the actual opening in bruchs membrane (red dots); not in the same place as the red dots. mismatch
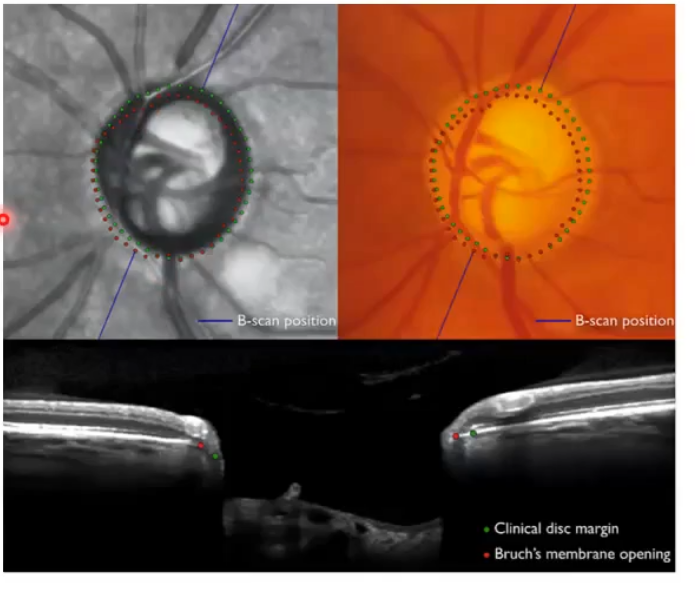
so what does the mismatch mean then for analysis?
can therefore sometimes identify areas of thinner rim than subjectively assessed
useful in glaucoma
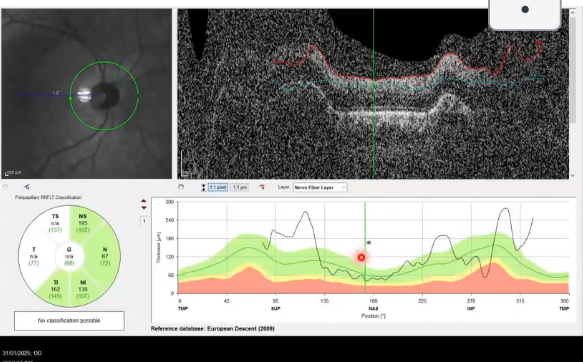
OCT scans of the ONH (3): cpRNFL scans
circumpapillary retinal nerve fibre layer thickness
measured along 3.4-3.5 mm diameter circle centred onh
can be extracted from cube scan
or caputred directly
most used and most useful scna of the disc for glaucoma
why is cpRNFL scans useful
all retinal ganglion cells from retina send their axons to form bundles that course through the rnfl and exit the eye at the onh, therefore virtually all pass through this circle
thinning of the rnfl indicatses loss of retinal ganglion cells= glaucoma
white circles in pic slightly away from the disc to maximise thickness of rnfl= greatest measurement range and minimise effects of variation in disc size/shape
bottom image shows localised loss of nerve fibres ( dark areas)
thickness comparison of cpRNFL
thickness compared to normative databse along its length and in sectors
inner limiting membrane and rnfl are the two easiest layers to segment
enables accurate measurements of thickness
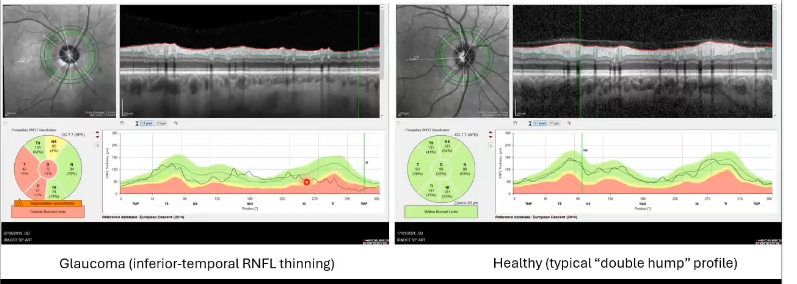
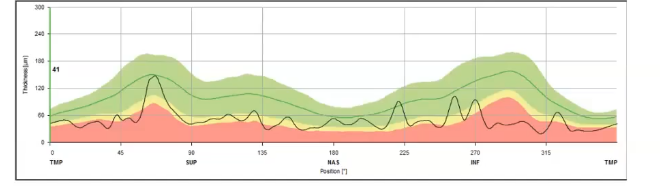
right picture shows healthy eye. thicker nerve fibre layer in inferior temporal and superior temporal area
left; inferior temporal shows it is thinner as it drops off in graph.
what do the colours mean on comparisons to normative data
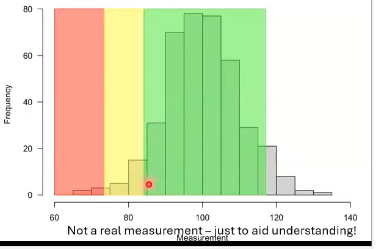
measurements are compared to those taken from a large number of healthy volunteers; called normative database
green= within normal limits= greater than 5th percentile of normative data
yellow= borderline, between the 1st abd 5th percentile
red= outside normal limits below 1st percentile of normative data
what does measurments falling out the normal limits mean
means that it is smaller than that measurement for 99% of healthy eyes in normative database
indication that disease may be present
doesnt mean that disease is present
similarily, a measurement in green means that at least 5% of the healthy yes in database had a smaller measurement, doesnt mean disease is not present
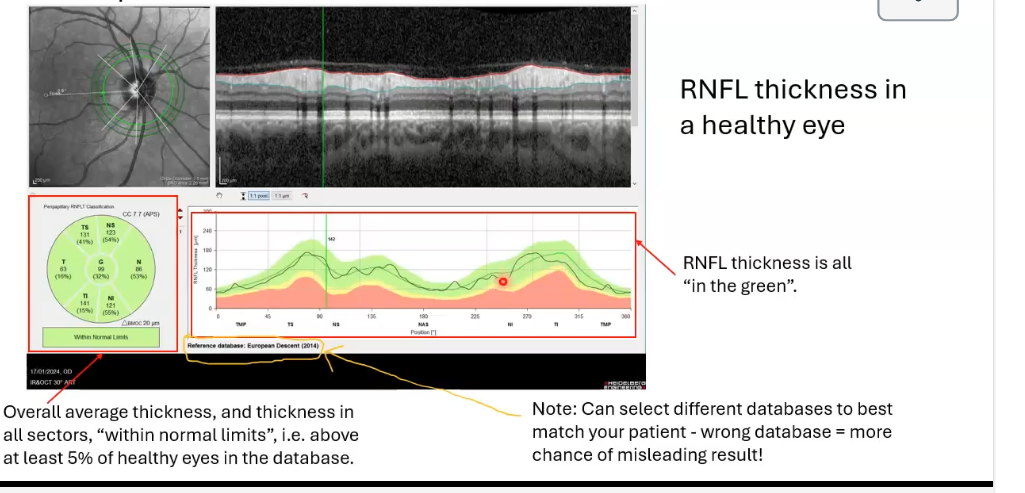
rnfl thickness of healthy eye
above at least 5% of healthy eyes in the database
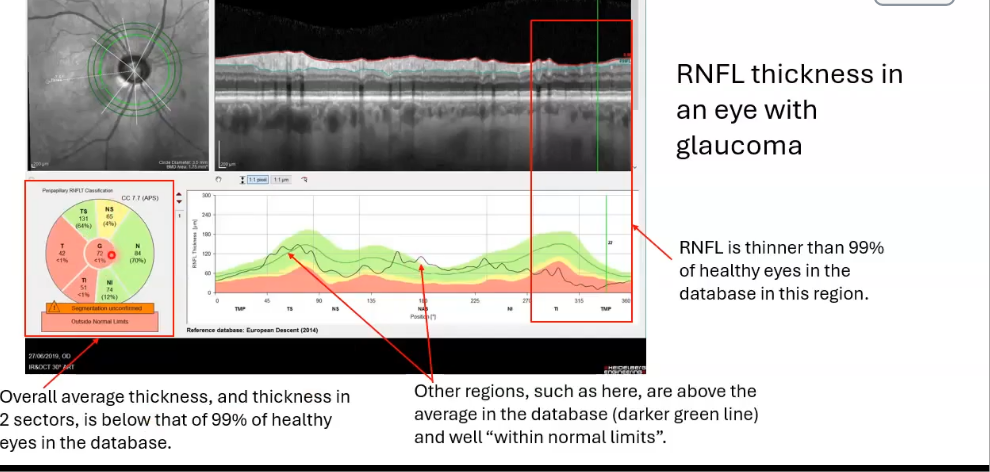
rnfl thickness in an eye with glaucoma
nerve fibre layer thickness falls into the red, so its thinner than 99% of those with normal
would do VFT if red seen
key ONH/RNFL features of glaucoma
reduced rnfl thickness , often localised in early cases
increased c/d ratio ± cup volume
reduced NRR thickness and area
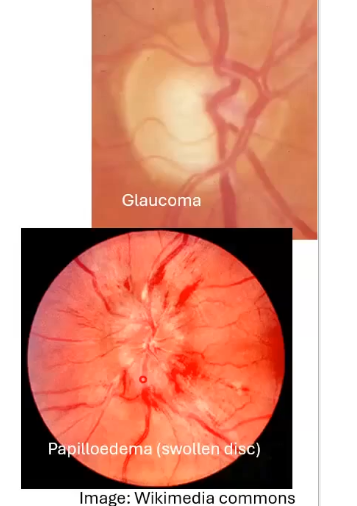
papilloedema
onh swelling
margins not distinct
on oct shows very thick as above normal limits
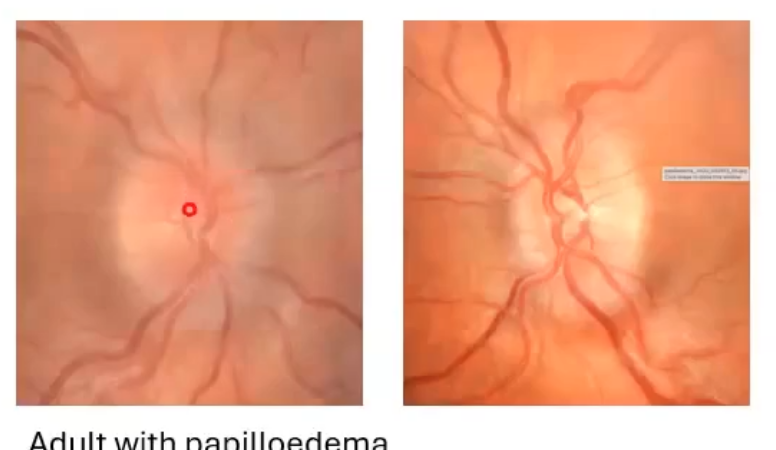
more papilloedema
margins slghtly blurred
onh profile raised and smooth on B scan
rnfl thickness above normal limits

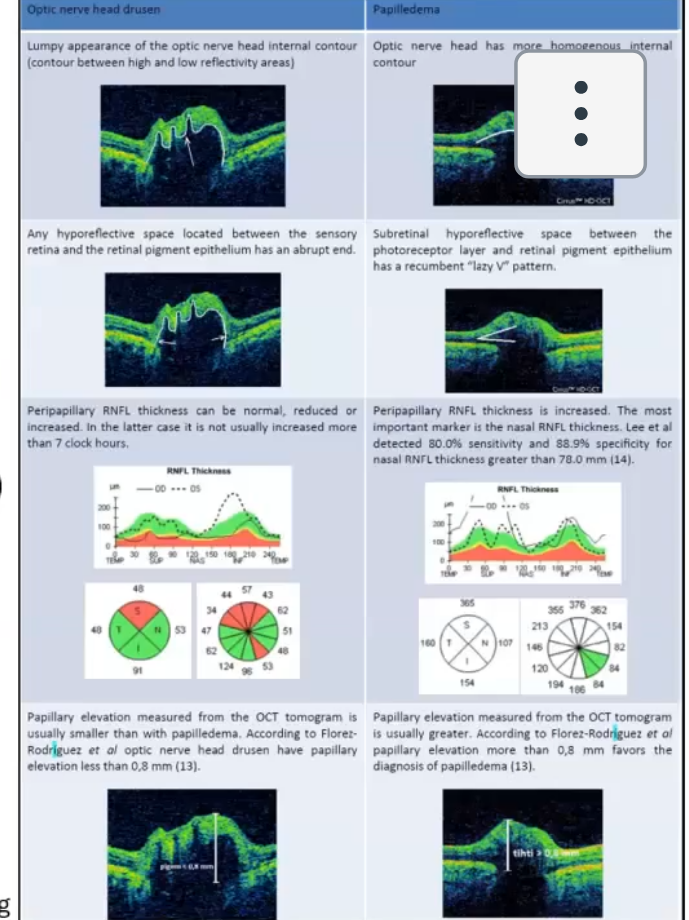
papilloedema vs optic disc drusen
drusen is lumpy calcium/proteins deposits in onh
canmake onh margins appear indistiny and mimic papilloedema
hard to distinguish even with oct if rnfl thickness is increased
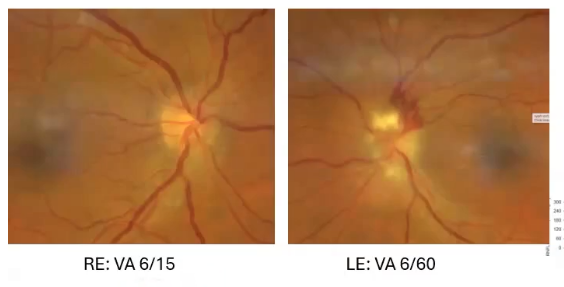
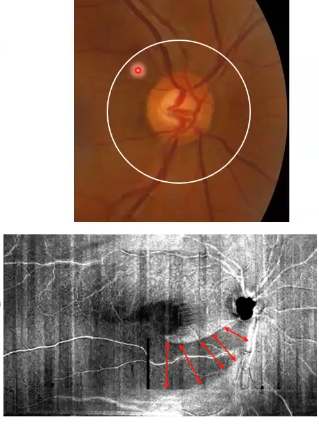
other athologies: optic neuritis
inflammation of the optic nerve
swelling and haemorrhage of the left onh
lernfl thickness above normal limits
re rnfl thickness within normal limits
optic neuritis: same ox just 17 days later
in left eye, swleling has reduced, some back into the green
right eye starting to swell up
bordered red was 17 days prior , bottom after
high myopia
often large and/or tilted discs
typically etxensive peripapillary atrophy
difficult to assess tilted discs for cupping/NRR health
may have rnfl and visual field defects that look like glaucoma
the px in picture shows high myopia, extensizzve PPA, thin rnfl and an enlarged blind spot
normative da tabases and high myopia
normative databases often exclude high myopes ( more than -5.00 or -600
due to larger eyes/ stretching of ocular structures , tissue profiles may differ from normative database in myopic px
rnfl
thinning of rnfl is seen in glaucoma
rnfls thickness measurements are accurate because the boundaries are easy to segment
rnfl follows a double hump profile in healthy eyes
different normative databases can be chosen to best match the px
swelling of onh results in thickening of rnfl measureable by oct
normative database statements
within normal limists DOES NOT mean that measurement is healthy
outside normal limits does not mean measurements is below average; means its below the 1st percentile
it is possible to have measurements that are above normal limits
what can go wrong
using incorrect normative database or no normative database for px
no databases for under 18 px , and availability for different ethnicities variable
is the px well represented in database, eg excludes over -5.00 myopes
if they have unsual discs
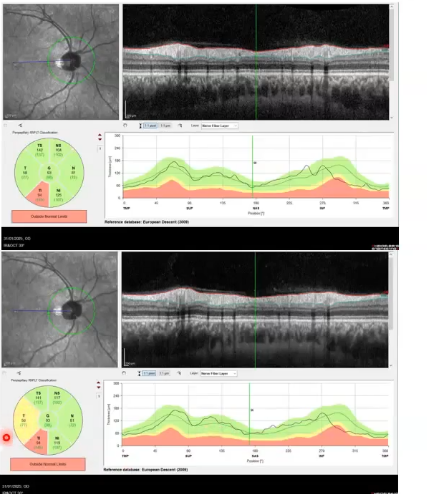
scan capturue issues
scan misalignment
segmentation errors
blood vessels affecting rnfl thickness
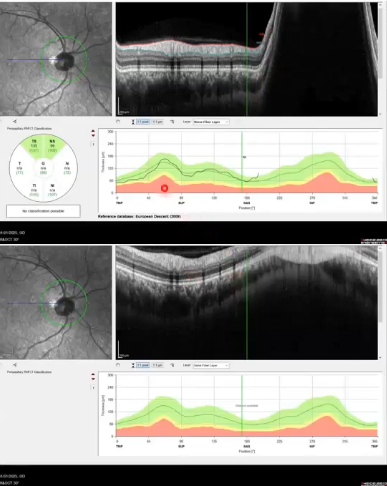
unusual disc
px with glaucoma
extensive ppa - can be a sign in glaucoma
ppa is also present in healthy eyes as retinal layes not in tact where the ppa is
oct struggles to measure the rnfl thickness inferiorly where scan circle crosses ppa
results in an artefactual inferior defect in both eyes, not possible to monitor change in that region
scan capture issues
misalignment of instrument results in dark/ noisy, griany and distorted image
software has attempted to analyse but still failed
scan capture issues: same eye, 30 secs apart
lower image slightly out of focus as blood vessels not as crisp as the top image
rnfl thickness measurements affected
effect uneven around profile
scan capture issues
same eye same session
incorrect device positioning
oct is out of range
results in sections cut off that cant be analysed
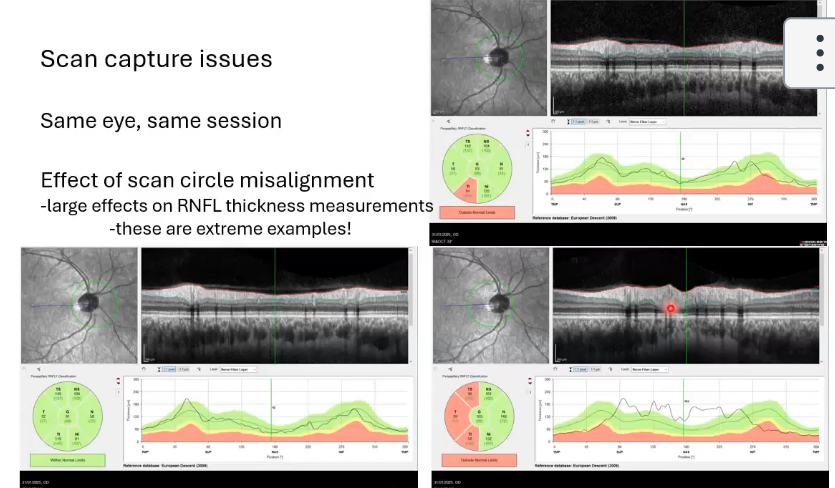
scan capture issues; same eye same session
effect of the scan circle misalignment
large effects on the rnfl thickness measurements
circle too far over to right, left
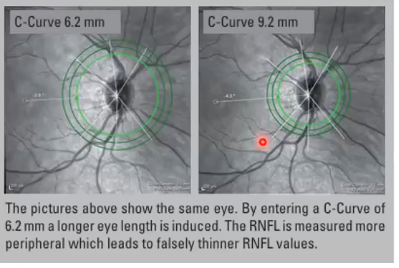
scan capture issue: improper correction for corneal curvature
C - curve = mean of vertical and horizontal corneal radius
device positions can circle according to assumptions about the eye size and optics
incorrect C curve means scan will be too small or too large , leading to misleading measurements
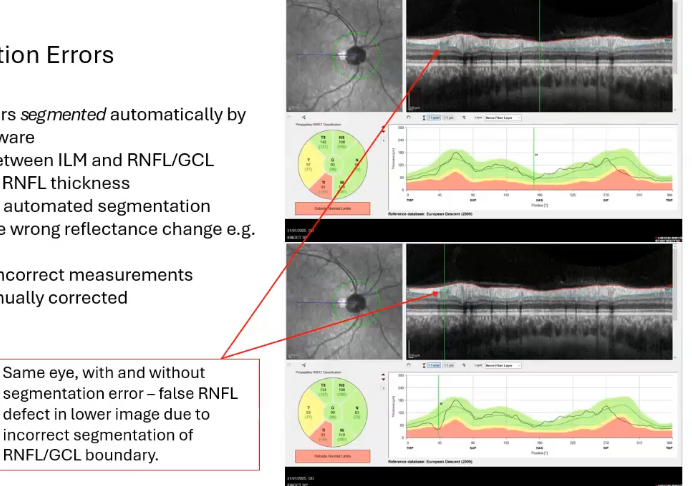
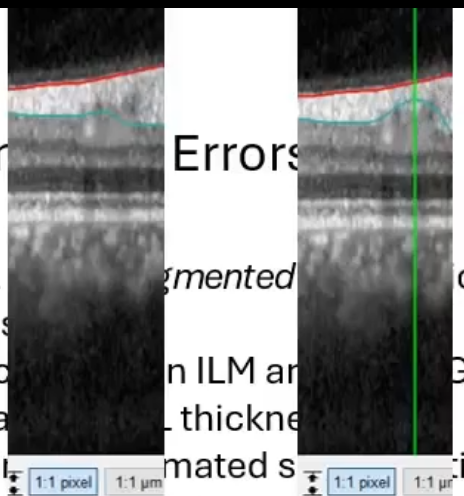
segmentation errors
retinal layers segmented automatically by device software
distance between ILM an RNFL/GCL boundary = RNFL thickness
sometimes automated segmentation chooses the wrong reflectance change eg a shadow
results in incorrect measurements but can be manually corrected by drawing on where you wnat it
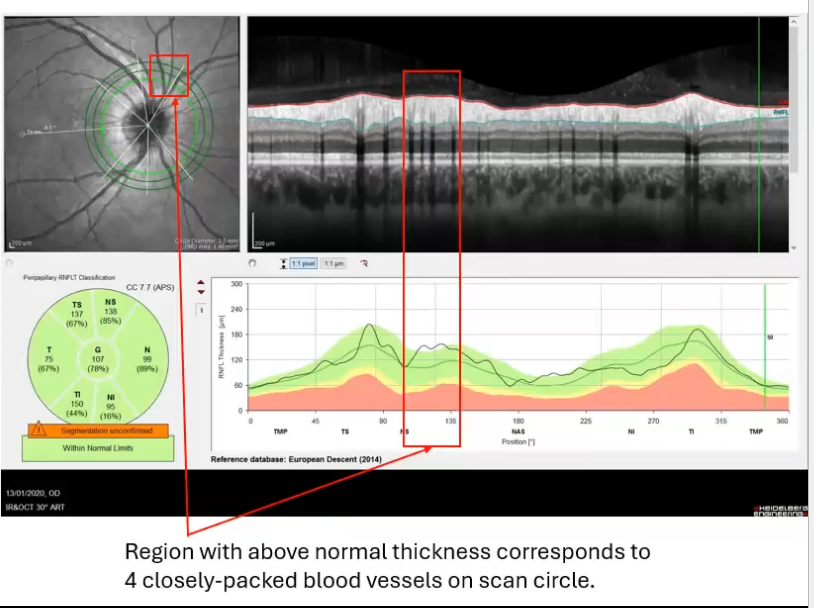
effects of blood vessels
large prominent blood vessels cause a shadow in oct image
may cause segmentation error as shadows reduce the reflected light reaching deeper layers so deeper layers appear darker
software struggled todetect the correct layer boundary
also rnfl is thicker when blood vessels are there both due to the thickness of the vessel itself and vessels tending to be in areas of thick rnfl
isolated peaks in rnfls thickness can result
effect of blood vessels
severe rnfl loss due to advanced glaucoma
generalised thinning of rnfl
most or all retinal nerve fibres lost
some residual thickness remains due to remaining supportive tissue
isolated peaks remain- caused by blood vessels
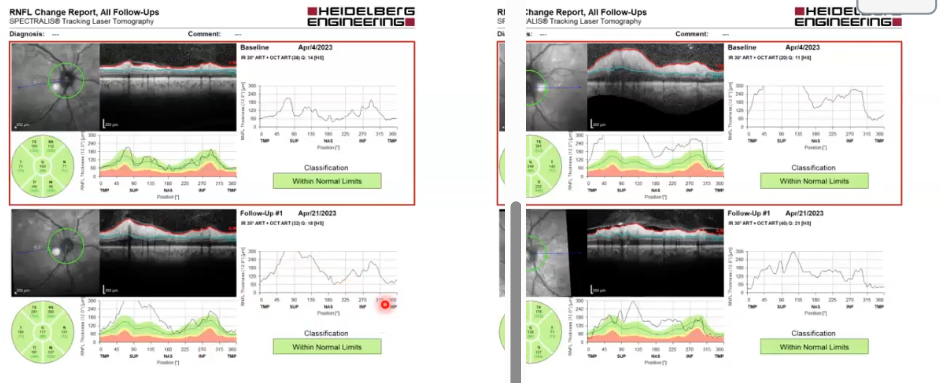
monitoring change
major advantage of imaging in general, particularily quantitatve measurements in those from oct
image at baseline eg start of treatment or just when a new px is seen first
compare images at future visits to baseline
powerful method for early detection especially in glaucoma
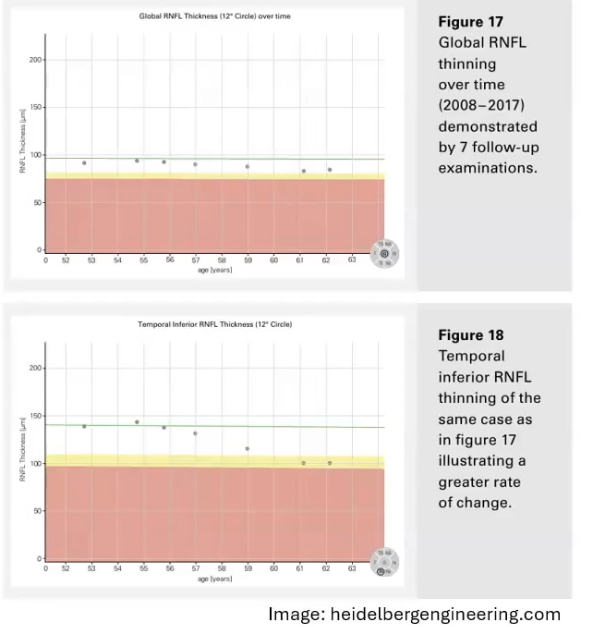
monitoring change on oct
can compare the numbers on the oct printout to previous
scan must be correctly positioned ie in the same place as last time
most oct devices have a built in software for monitoring change overtime