EXST 2201 Stats Exam 2
1/314
There's no tags or description
Looks like no tags are added yet.
Name | Mastery | Learn | Test | Matching | Spaced | Call with Kai |
|---|
No analytics yet
Send a link to your students to track their progress
315 Terms
What type of information do we really wish the science of statistics would give us so that we could make a good decision about an important matter?
Choose from the following options.
Information about probability.
Information about descriptive statistics.
Information about the population.
Information about the sample.
Information about the population.
Why does a column of population data values contain more information about the population than a column of sample data values?
Choose from the following options.
A column of population data values has more data values than a column of sample data values.
Because populations are defined by the researcher, so they inherently have more information.
Because the population is the totality of the individuals of interest.
Because the population data values are used to get the sample data values.
A column of population data values has more data values than a column of sample data values.
What are statistical methods of inference used for?
Choose from the following options.
To get information about population data values.
To go from a known situation to an unknown situation.
To infer information about descriptive statistics.
To infer an appropriate statistical result.
To get information about population data values.
Which one of the following choices does NOT indicate why knowing the value of the population mean is so important in the science of statistics?
Choose from the following options.
Because it reduces a column of data values down to the one most representative value.
Because the population mean was one of the first statistical methods developed.
Because one value describing a population is much easier to work with than many values.
Because it is a critical parameter of the normal distribution.
Because the population mean was one of the first statistical methods developed.
In regard to normally distributed data values themselves, what is the importance of knowing the value of the population mean in the science of statistics?
Choose from the following options.
Most of the data values are clustered close to the value of the mean.
The mean summarizes the location information of the data values.
The mean gives the mathematical first moment of the data values.
The mean is required to find probability with the normal distribution.
Most of the data values are clustered close to the value of the mean.
In the common, real-world practice of statistics, is it ever possible to know the true value of the population mean?
Choose from the following options.
No, because the science of statistics deals with probabilistic data.
No, because we cannot do calculations on an infinite number of data values.
No, because populations are usually hypothetical and their information cannot be known.
All these other choices.
All these other choices.
Why is the sample average important in the science of statistics?
Choose from the following options.
It used the same mathematical calculation as the population mean.
It best estimates the value of the population mean from the sample data values.
It is the middle of the sample data values.
It is easy to use being one value summarized from the data values.
It best estimates the value of the population mean from the sample data values.
Please match each type of statistical method below with the name of the appropriate statistical method.
A. Hypothesis Testing
B. Confidence Intervals
Estimate the population mean. -
Test for the population mean. -
Estimate the population mean. - Confidence Intervals
Test for the population mean. - Hypothesis Testing
What is the end result of the confidence interval method?
Choose from the following options.
A conclusion to a statistical test about a population mean.
A resulting value for the population mean.
An interval estimate of the population mean.
A level of confidence in the value of the population mean.
An interval estimate of the population mean.
What is the end result of the hypothesis test method?
Choose from the following options.
A conclusion to a statistical test about a population mean.
A resulting value for the population mean.
An interval estimate of the population mean.
A level of confidence in the value of the population mean.
A conclusion to a statistical test about a population mean.
Please match each step in the General Method for Solving Problems in Statistics below with its purpose.
Step A:
Step 1:
Step 2:
Step 3:
A. Infer population information.
B. Analyze sample information.
C. Abstract problem information.
D. Theorize probability information.
Step A: - Abstract problem information.
Step 1: - Theorize probability information.
Step 2: - Analyze sample information.
Step 3: - Infer population information.
Choose the two parts of Step A: Abstract below?
Choose from the following options. (can select multiple)
Get descriptive statistics.
Find the critical value.
Write the two hypotheses.
Calculate the test statistic.
Get descriptive statistics.
Write the two hypotheses.
Choose the two tools used in Step 1: Theorize below?
Choose from the following options.
The Schematic z-Curve.
The Equation for sample average.
The z-Table.
The Probability Calculator.
The Schematic z-Curve.
The z-Table.
What is the primary task in Step 2: Analyze?
Choose from the following options.
Choose the appropriate equation.
Pick the appropriate Schematic Curve.
Analyze the problem for what it is asking.
Start the process of statistical inference.
Choose the appropriate equation.
What is the end result of Step 3: Infer?
Choose from the following options.
Statistical information about the value of a population mean.
The true value of the population mean.
A sample average estimating the value of a population mean.
A concise description of the column of sample data values.
Statistical information about the value of a population mean.
Why does having more sample data values mean getting more information about the population data values?
Choose from the following options.
Because calculation error is less with more data values.
Because statistical methods are designed for an infinite number of data values.
Because each data value brings a bit more information about the population data values.
Because mathematical calculations are more efficient with more data values.
Because each data value brings a bit more information about the population data values.
What type of statistics are used to learn about sample data values?
Choose from the following options.
Descriptive statistics, because they describe the methods used on a column of sample data values.
Inferential statistics, because they use the information in a column of sample data values.
Descriptive statistics, because they describe the data values in a column of sample data values.
Inferential statistics, because sample data values come from population data values.
Descriptive statistics, because they describe the data values in a column of sample data values.
Please select the choice that is NOT a purpose of the Process of Abstraction?
Choose from the following options.
Summarize the question text into a reasonable size.
Convert real world information into statistical information.
Determine the proper equation to be used.
Choose the appropriate statistical method for the situation.
Summarize the question text into a reasonable size.
Abstract the situation below by matching the statistical symbols with their appropriate values?
A veterinarian wanted to know if the average weight of puppies born in her clinic was than 0.5 pounds. She weighed 25 puppies and found a sample average weight of 0.55 pounds.
μ
σ,s
n
x̅
A. 0.5
B. 25
C. n/a
D. 0.55
μ (Population Mean): 0.5
σ, s (Standard Deviation): n/a
n (Sample Size): 25
x̄ (Sample Mean): 0.55
Abstract the situation below by matching the statistical symbols with their appropriate values?
An engineer was responsible for 5 machines making ball bearings 1.2 cm in diameter, with standard deviation of 0.01 cm. He suspected that one of the machines was making ball bearings too small, so he measured 37 ball bearings from this machine and found an average diameter of 1.15 cm.
μ
σ
n
x̅
s
A. 0.01
B. 37
C. n/a
D. 1.2
E. 1.15
μ (Population Mean): 1.2
σ (Population Standard Deviation): 0.01
n (Sample Size): 37
x̄ (Sample Mean): 1.15
s (Sample Standard Deviation): n/a
Abstract the situation below by matching the statistical symbols with their appropriate values?
Zillow lists the average home price in our area as $215,816 with a standard deviation of $21,500. To find out if this was still true, a real estate professional collected the data for 58 recently sold homes and found an average of $235,000 with a standard deviation of $23,500.
μ
σ
n
x̅
s
A. 215,816
B. 58
C. 21,500
D. 23,500
E. 235,000
μ (Population Mean): 215,816
σ (Population Standard Deviation): 21,500
n (Sample Size): 58
x̄ (Sample Mean): 235,000
s (Sample Standard Deviation): 23,500
Abstract the situation below by matching the statistical symbols with their appropriate values?
A brand new researcher was studying mosquitos in Louisiana. He collected 3,412 mosquitos and found an average weight of 1.7 grams with a standard deviation of 0.7 grams. Now he would like to do a statistical analysis to find out what the data values tell him.
μ,σ
n
x̅
s
A. 1.7
B. 0.7
C. 3,412
D. n/a
μ, σ (Population Mean/Standard Deviation): n/a
n (Sample Size): 3,412
x̄ (Sample Mean): 1.7
s (Sample Standard Deviation): 0.7
The statement, ‘On average, Americans spend around 4.5 hours per day on their phones.’ has what interpretation in the process of abstraction?
Choose from the following options.
That the Americans studied spend 4.5 hours.
That it is a generic statement giving information.
That some Americans spend 4.5 hours.
That all Americans spend 4.5 hours.
That all Americans spend 4.5 hours.
What is the correct symbol for the significance level of a statistical study?
Choose from the following options.
Significance Level (SL).
Beta (β).
Alpha (α).
Chi-Square (χ^2).
Alpha (α).
Abstract the situation below by matching the statistical symbols with their appropriate values?
Ford trucks get an average of 23 miles per gallon (mpg), with a standard deviation of 3.7 mpg.
μ
σ
n,x̅,s
A. 23
B. n/a
C. 3.7
μ : (23)
σ : (3.7)
n, x̅, s : (n/a)
Abstract the situation below by matching the statistical symbols with their appropriate values?
It is known that inshore fishermen catch 14 fish per trip in the nearby waters. A visiting fisherman recently made several trips in the nearby waters and caught an average of only 12 fish.
μ
n,σ,s
x̅
A. 14
B. n/a
C. 12
μ : 14
n, σ, s : n/a
x̄ : 12
Abstract the situation below by matching the statistical symbols with their appropriate values?
A college student measured how long per day she studied for 14 days. She calculated an average of 5.3 hours per day and a standard deviation of 1.2 hours per day. Past studies have shown that college students study 4.1 hours each day with a standard deviation of 0.7 hours each day.
Hit Spacebar to access and hit Enter to open.
Answer has been selected.
μ
σ
n
x̅
s
A. 4.1
B. 0.7
C. 14
D. 1.2
E. 5.3
μ : 4.1
σ : 0.7
n : 14
x̅ : 5.3
s : 1.2
Abstract the situation below by matching the statistical symbols with their appropriate values?
At a local university, education researchers wanted to find out how students taught in on-campus math courses compared to students taught in a local Mathnasium franchise.
Group 1: Thirty (30) students were randomly selected and assigned to an on-campus course
Group 2: Twenty-five (25) students were randomly selected and assigned to Mathnasium courses.
At the end of the semester, each student took a standardized exam in mathematics. The scores had a normal shape. The students in Group 1, the on-campus course, had an average score of 78 with a standard deviation of 10. The students in Group 2, the Mathnasium course, had an average score of 83 with a standard deviation of 13.
μ,σ
n1
n2
¯x1
¯x2
s1
s
A. 78%
B. 25
C. 13%
D. 30
E. n/a
F. 10%
G. 83%
μ, σ : n/a
n1 : 30
n2 : 25
x̄1 : 78%
x̄2 : 83%
s1 : 10%
s2 : 13%
Abstract the situation below by matching the statistical symbols with their appropriate values?
A college undergraduate student in psychology was interested in the cognitive effects of high school students watching movies on a cell phone. To plan his study, he scanned the current literature to learn what was known at this time. He found that high school students watched movies for an average of 17 hours, with a standard deviation of 10.5 hours.
μ
σ
n,¯x,s
A. 17
B. 10.5
C. n/a
μ : 17
σ : 10.5
n, x̄, s : n/a
What two tools are used to go between the blanks on the Algebraic side of the Schematic Curve for Sample Averages?
Choose from the following options. (can choose multiple).
The z-Table.
The x-Table.
This z-Equation: z = x − μ/σ.
This z-Equation: z = (x̅ − μ) / (σ/√n.)
The z-Table.
This z-Equation: z = (x̅ - μ) / (σ / √n)
For the Method to Use the Schematic Curve, match each step below with it function?
Step 1.
Step 2.
Step 3.
Step 4.
A. Load the problem.
B. Calibrate the x-Axis.
C. Draw the schematic.
D. Solve for the answer.
Step 1. : Draw the schematic.
Step 2. : Calibrate the x-Axis.
Step 3. : Load the problem.
Step 4. : Solve for the answer.
What actions occur in the Analyze step of the General Method to Solve Problems in Statistics?
Choose from the following options.
The calculations for the method are chosen and performed.
Inferring a population value from a sample value.
Converting real world information into statistical information.
Finding the appropriate t-value for the situation.
The calculations for the method are chosen and performed.
What actions occur in the Infer step of the General Method to Solve Problems in Statistics?
Choose from the following options
Simplifying the problem into statistical information.
Determining a population value from a sample values.
Solving the chosen equation.
Finding the appropriate z-score for the situation.
Determining a population value from a sample values.
Select the appropriate end result for the following two steps of the General Method for Solving Problems in Statistics.
Hit Spacebar to access and hit Enter to open.
Answer has been selected.
Abstract.
Theorize.
Analyze.
Infer.
A. n/a.
B. n/a.
C. A z-score from probability.
D. A z-score from the sample.
Abstract : n/a
Theorize : A z-score from probability
Analyze : A z-score from the sample
Infer : n/a
Start of Lesson 5.1
There are two types of estimators of the population mean, the point estimator and the interval estimator. Please match each of the following estimators with their appropriate statistical method.
Point
Interval.
A. Sample Average
B. Confidence Interval
Point: Sample Average
Interval: Confidence Interval
Two common statistical estimators of the population mean are the sample average and the confidence interval. Which one of these statistics is more useful to give information about the value of a population mean?
Choose from the following options.
Both, as they both estimate the same value (the population mean).
Sample average, as it is the best guessed value for the mean.
Confidence interval, as it shows how far the mean might be from the average.
Confidence interval, as it is wider and has a greater chance of being correct.
Confidence interval, as it shows how far the mean might be from the average.
Why is the confidence interval method the best method to get an interval estimate of the population mean?
Choose from the following options.
It has a higher level of confidence than other interval estimators.
It uses the most information from the distribution of the data values.
It gives a wider estimate than the sample average.
All of the other answers.
It uses the most information from the distribution of the data values.
What is a major weakness in the method of a confidence interval?
Choose from the following options.
A confidence interval does not give a degree of reasonableness for any value to be the population mean.
A confidence interval can give more than one interval for the population mean.
Values outside of the confidence interval are not likely values for the population mean.
Confidence intervals can be changed just by changing the level of confidence.
A confidence interval does not give a degree of reasonableness for any value to be the population mean.
The logic of a confidence interval comes from reversing the logic of the sampling distribution of the sample average. Thus, the schematic curve for a confidence interval is centered over which statistic for location?
Choose from the following options.
Population mode (Mode).
Sample median (M).
Sample average (¯x).
Population mean (μ).
Sample average (¯x).
What is the name of the spread in a confidence interval?
Choose from the following options.
The margin of error.
The coefficient of variation.
The standard deviation.
The standard error.
The margin of error.
Select two choices below that make up the two parts of a margin of error in a confidence interval?
Choose from the following options. (multiple select)
The level of predictiveness in the confidence interval method.
The level of confidence in the confidence interval method.
The standard deviation of the data values.
The standard error of the sample average.
The level of confidence in the confidence interval method.
The standard error of the sample average.
Please match each of the following changes in the calculation of the margin of error with their effect on the width of a confidence interval. Note which answer goes with which input change (n,CL).
Increase sample size.
Decrease sample size.
Increase level of confidence.
Decrease level of confidence.
A. Narrower (CL).
B. Narrower (n).
C. Wider (CL).
D. Wider (n).
Increase sample size: Narrower (n).
Decrease sample size: Wider (n).
Increase level of confidence: Wider (CL).
Decrease level of confidence: Narrower (CL).
The schematic curve for a confidence interval divides the curve into several regions. Which region will always contain the population mean?
Choose from the following options.
Middle region.
Confidence region.
Significance region.
Mean region.
Confidence region.
The size of the confidence region is given by the size of the confidence level. What is a simple meaning of the confidence level?
Choose from the following options.
How many times out of 100 the method will give a correct answer.
How confident to be that the confidence interval contains the value of the population mean.
How many times out of 100 the method will give an incorrect answer.
How many times out of 100 the method was calculated correctly.
How many times out of 100 the method will give a correct answer.
What points on the real number line separate the confidence region from the significance regions?
Choose from the following options.
The confidence values.
The critical values.
The schematic values.
The significance values.
The critical values.
What is the size of the significance region?
Choose from the following options.
Significance level (SL).
Alpha (α).
Confidence level (CL).
Beta (β).
Alpha (α).
Is it guaranteed that confidence interval method will give an interval containing the population mean every time?
Choose from the following options.
No, probabilistic data almost never gives a correct answer.
No, the method will give an incorrect interval alpha (α) percent of the time.
Yes, every confidence interval contains the population mean.
No, the correctness of the method is limited by the quality of the data input.
No, the method will give an incorrect interval alpha (α) percent of the time.
Please match each of the following statistics with how often they give the true value of the population mean.
Sample average.
Confidence interval.
Sample standard deviation.
A.
B.
C.
CL percent of the time.
Sample average. : Almost never.
Confidence interval. : CL percent of the time.
Sample standard deviation. : Always never.
Confidence intervals can be thought to be composed of two parts, a middle value and a spread value. Please match each of the following parts of a confidence interval with their appropriate statistics.
Middle.
Spread.
A. The value of the sample average.
B. The value of the margin of error.
Middle: The value of the sample average.
Spread: The value of the margin of error.
In a confidence interval, what information does the confidence level give?
Choose from the following options.
The proportion of times the population mean is correct.
The proportion of times the calculations are correct.
The proportion of times the confidence interval should be trusted.
The proportion of times the confidence interval includes the population mean.
The proportion of times the confidence interval includes the population mean.
In the science of statistics, why is the method of confidence intervals needed to get information about the population mean?
Choose from the following options.
As a single value was not considered valid enough for the population mean.
As intervals were known to be valuable in mathematics so the same concept was applied in statistics.
As the population mean cannot be determined exactly from probabilistic sample data values.
As the population mean cannot be known exactly in this course.
As the population mean cannot be determined exactly from probabilistic sample data values.
The statistical logic for a confidence interval is based on reversing already known logic for another statistic. What is this other logic?
Choose from the following options.
The logic for the sampling distribution of the sample average.
The logic for the distribution of the data.
The logic for the level of confidence.
The logic for the distribution of the population mean.
The logic for the sampling distribution of the sample average.
Is the interval shown below properly denotated for a confidence interval?
(115,97)
Choose from the following options.
No, as the value of the sample average must be in the middle of the interval.
No, values in the parentheses must go from lowest to highest.
Yes, as this interval has a middle part and a spread part.
Yes, this is a proper denotation for a confidence interval.
No, values in the parentheses must go from lowest to highest.
Looking in a schematic curve from the point of view of probability, what type of situation is a confidence interval?
Choose from the following options.
A right (or left) tail area.
A right (or left) body area.
A side area.
A middle body area.
A middle body area.
The curve in a schematic curve can be centered over different values to give different information about the data values. Please match each value below with what information is given about the data values.
The population mean.
The sample average.
A. A range of likely values for the sample average.
B. A range of likely values for the population mean.
The population mean: A range of likely values for the sample average.
The sample average: A range of likely values for the population mean.
The lower and upper confidence limits for a confidence interval can be seen in a schematic curve. The two confidence limits are just the x-values of a middle body area in a schematic curve.
Choose from the following options.
Never true.
None of the other answers.
Sometimes true.
True.
True.
What is the main strength of a confidence interval?
Choose from the following options.
It is easy to calculate and to interpret its meaning.
Gives a level of confidence for the value of the population mean.
Gives a range of likely values for the population mean.
Gives a range of unlikely values for the population mean.
Gives a range of likely values for the population mean.
What is the major weakness of a confidence interval?
Choose from the following options.
Every value inside the interval is equally likely to be the population mean.
Confidence intervals do not explicitly give the middle and the spread values.
Some confidence intervals are too wide to be useful.
Some confidence intervals give practically impossible values.
Every value inside the interval is equally likely to be the population mean.
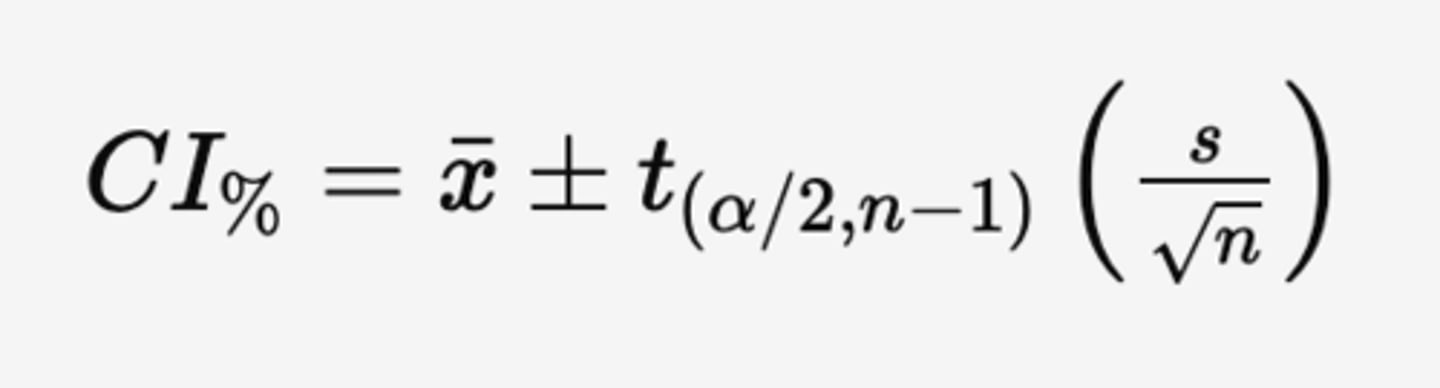
What is the correct equation for a confidence interval with t-values?
CI% = ¯x ± t(α/2,n−1) (s/n)
CI% = μ ± t(α/2,n−1) (s/√n)
CI% = ¯x ± t(α/2,n−1) (s/√n)
CI% = ¯x ± t(α/2,n−1) (√s/n)
CI% = ¯x ± t(α/2,n−1) (s/√n)
Consider the size of the significance region, what is its appropriate symbol and how is it calculated?
Choose from the following options.
α = 1−CL.
σ = CL−α.
α = 1+CL.
β = CL−1.
α = 1−CL.
Will every confidence interval contain the value of the population mean?
Choose from the following options.
No, as the population mean is either inside or outside the confidence interval.
No, but it will most of the time.
Yes, unless the calculations are done incorrectly.
No, only the confidence level proportion of the time.
No, only the confidence level proportion of the time.
What is the critical value for a 95% confidence interval with 22 data values and the sample standard deviation?
Choose from the following options.
Critical value = 2.074.
Critical value = 1.721.
Critical value = 2.080.
Critical value = 1.960.
Critical value = 2.080.
What is the critical value for a 90% confidence interval with 31 data values and the sample standard deviation?
Choose from the following options.
Critical value = 1.310.
Critical value = 1.697.
Critical value = 1.696.
Critical value = 1.640.
Critical value = 1.697.
What is the critical value for a 99% confidence interval with 10 data values and the sample standard deviation?
Choose from the following options.
Critical value = 2.821.
Critical value = 3.169.
Critical value = 2.764.
Critical value = 3.250.
Critical value = 3.250.
In the confidence interval equation shown below, what part of the equation is the margin of error?
CI%=¯x±t(α/2,n−1)(s√n)
Choose from the following options.
ME = (s/√n)
ME = ¯x ± (s/√n)
ME = t(α/2,n−1) (s/√n)
ME = t(α/2,n−1)
ME = t(α/2,n−1) (s/√n)
If the degrees of freedom gives the number of units of information, what does the margin of error give?
Choose from the following options.
The level of confidence in the confidence interval.
Half the size of the significance region.
Half the width of a confidence interval.
The entire width of a confidence interval.
Note
Half the width of a confidence interval.
When the confidence level is increased, how does the width of the confidence interval change?
Choose from the following options.
Widens, as the middle body area gets larger.
Narrows, as there is more information in the confidence interval.
Widens, as the tail areas get larger.
Narrows, as there is more confidence in the method.
Widens, as the middle body area gets larger.
When the number of data values is increased, how does the width of the confidence interval change?
Choose from the following options.
Narrows, as the standard error of the sample average gets smaller.
Narrows, as the degrees of freedom get larger.
Widens, as the calculations increase in size.
Widens, as more data values mean more information.
Narrows, as the standard error of the sample average gets smaller.
Start of lesson 5.3
Two pieces of information must be known to use the t-distribution to find the probability of an event. What are those two pieces of information?
Choose from the following options.
Sample average / Number of data values.
Sample standard deviation / Degrees of freedom.
Population standard deviation / Number of data values.
Sample standard deviation / Sample average.
Two pieces of information must be known to use the t-distribution to find the probability of an event. What are those two pieces of information?
Sample standard deviation / Degrees of freedom.
3 multiple choice options
What is the value of the sample average / value of the margin of error in the confidence interval shown below?
(96, 118)
Values = 107 / 11.
3 multiple choice options
Is the following a true statement? ‘A confidence interval is used to infer the value of the sample average’.
No, as it is used to find the value of the population mean.
3 multiple choice options
Is the following a true statement? ‘The population mean must be known to calculate a confidence interval’.
No, as finding the value of the population mean is the goal.
3 multiple choice options
What is the meaning of the values inside a properly made confidence interval?
Any of these values could be a likely value for the population mean.
3 multiple choice options
A local college instructor gave a statistics exam to his class of 31 students and calculated a 95% confidence interval of (77.1, 82.9) for the scores. A competing college knew that their students scored an average of 85 on this same test. How well did the local college do in comparison to the competing college?
Not well, as 85 is higher than the upper confidence limit.
3 multiple choice options
31 students in a local statistics class took an exam where the average score was 80, and the standard deviation score was 10. Students in a competing statistics class took the same exam and had an average score of 85. Did the competing students score higher than the population mean of the local students? Make a 95% confidence interval to find out.
Yes, as CI = (76.3, 83.7).
3 multiple choice options
The ages of 21 people in an elder care home had an average age of 85 years and a standard deviation age of 8 years. Could the population mean age of people in an elder care home be 87 years? Make a 90% confidence interval to find out.
Yes, as 87 is inside of CI = (81.989, 88.011)
3 multiple choice options
In 2015 on the National Assessment of Educational Progress (NAEP) science scale, the following results were obtained.
- Score for 15 underage students: average = 125, standard deviation = 5.81.
- Score for 15 over age students: average = 136, standard deviation = 3.87.
Both data shapes were normal. Please make two 98% confidence intervals to find out if it is reasonable that these two groups of students have the same population mean score.
No, as the two confidence intervals, (121.1, 128.9) and (133.4, 138.6) do not overlap.
3 multiple choice options
An auto mechanic wants to estimate the cost of repairing a car after a 25 mph collision. He looked up 24 collisions and found that the average repair cost was $11,000 with a standard deviation cost of $2,500. Please find the middle value / spread value of a 98% confidence interval for the population mean repair cost?
Values = $11,000 / $1,276.
3 multiple choice options
Last year a sample of 35 women who were victims of purse snatching had an average age of 34.25 years, with a standard deviation age of 10 years. One researcher wondered if the population mean age of all victims of purse snatching could be less than 30 years. Make a 96% confidence interval to find out?
No, as the confidence interval for age = (30.64, 37.86).
3 multiple choice options
The height of 14 students in a college statistics course was measured and found to have an average height of 68 inches, and a standard deviation height of 2 inches. What is the 90% confidence interval for the mean height of all students at the college?
CI = (67.0, 68.9).
3 multiple choice options
The height of 27 students in a college statistics course was measured and found to have a 90% confidence interval height of (65.9, 69.9). Is it possible that the mean height of all the students at this college 5 feet 6 inches (66 inches) or higher?
Yes, as 66 inches is inside the confidence interval.
3 multiple choice options
The confidence interval shown below was calculated from a sample average of 100 and a margin of error of 15. Is 100 a more likely value for the population mean than 90?
(85, 115)
No, as all values inside the confidence interval are equally likely.
3 multiple choice options
A fishery graduate student wanted to know the population mean length of perch in a local lake. She caught 10 perch, measured their length, and found an average length of 3.6 inches, and a standard error of the sample average length of 0.994 inches. What is the 95% confidence interval for the population mean length of the perch in this lake?
CI = (1.35, 5.85)
3 multiple choice options
A fishery graduate student wanted to know the population mean length of perch in a local lake. She caught all the perch she could and claimed that this was all the perch in the lake. Since she claimed that she had caught the population, she chose to use the z-distribution to calculate a confidence interval for the value of the population mean. What do you think of her choice of distribution?
All of these other answers.
38 eggs were randomly chosen from a grocery store and individually weighed. The average weight was 97.8 grams with a standard deviation weight of 4.2 grams. What is the standard error of the sample average / margin of error for a 90% confidence interval for weight?
Grams = 0.6813 / 1.1494
A researcher was interested in the proportion of the population that was left-handed. He collected 61 random samples of 100 people each and found that an average of 16 people were left-handed, with a standard deviation of 4 people. What is the 95% confidence interval for the population mean number of left-handed people in a sample of 100 people?
CI = (14.97, 17.02).
3 multiple choice options
Click two of the following choices as the reasons why the method of hypothesis testing is needed.
(multiple select)
- To learn the reasonableness that the null value is the value of the population mean.
- To answer if the null value is less than, or greater than, the population mean.
In the statistical method of hypothesis testing, what is the meaning of the word reasonableness?
How reasonable is the null value the value of the population mean.
In the alternative hypothesis of a hypothesis test, what is the meaning of the words 'less than', or 'greater than'?
Could the value of the population mean be less than, or greater than, the value in the null hypothesis.
In the statistical method of hypothesis testing, choose two of the choices below as the assumptions required to perform a hypothesis test.
(multiple select)
- The individuals were randomly selected.
- The sample average is normally distributed.
For the General Method to solve problems in statistics, please match each step with the type of information that step works with.
A: Abstract. : Relevant info from problem.
1: Theorize. : Probability info from theory.
2: Analyze. : Sample info from problem.
3: Infer. : Population info as a result.
In the statistical method of hypothesis testing, which of the choices below is NOT a descriptive statistic.
Statistic = 𝑡0.
In the statistical method of hypothesis testing, what belief about the population mean does the null hypothesis (H0) express?
The currently believed value of the population mean.
In the statistical method of hypothesis testing, what belief about the population mean does the alternative hypothesis (H1) express?
What information does the alternative hypothesis express?
The researcher's believed value of the population mean.
In the statistical method of hypothesis testing, please match each region below with the appropriate area under a schematic normal curve.
Acceptance Region. : A middle body area.
Less than Rejection Region. : A left-tail area.
Greater than Rejection Region. : A right-tail area.
Not-Equal-To Rejection Region. : A two-tail area.
In the statistical method of hypothesis testing, for the value that separates the schematic curve into the acceptance region and the rejection region(s), what is its name / where does it come from?
The critical value / From the z,t-Table.
In the statistical method of hypothesis testing, where does the value of the test statistic come from?
From the t-equation (𝑡0=𝑥¯−𝜇/𝑠/√n).