AP Free Response Questions
1/3
There's no tags or description
Looks like no tags are added yet.
Name | Mastery | Learn | Test | Matching | Spaced | Call with Kai |
|---|
No analytics yet
Send a link to your students to track their progress
4 Terms
A. Explain the Green Revolution.
B. Describe examples of the farming techniques introduced during the Green Revolution.
C. Explain the consequences of using those farming techniques.
A.
-increasing food production by using modern farming techniques
-happened between 1940s and 1960s, introducing new high-yield crops like wheat and rice
-helped reduce hunger and prevent famines for many countries, but chemicals were overused and caused environmental problems for soil and water
B.
-farming techniques that were used were fertilizers, pesticides, and irrigation systems
C.
-less healthy soil over time, pollution from fertilizers and pesticides, and water shortages from irrigation
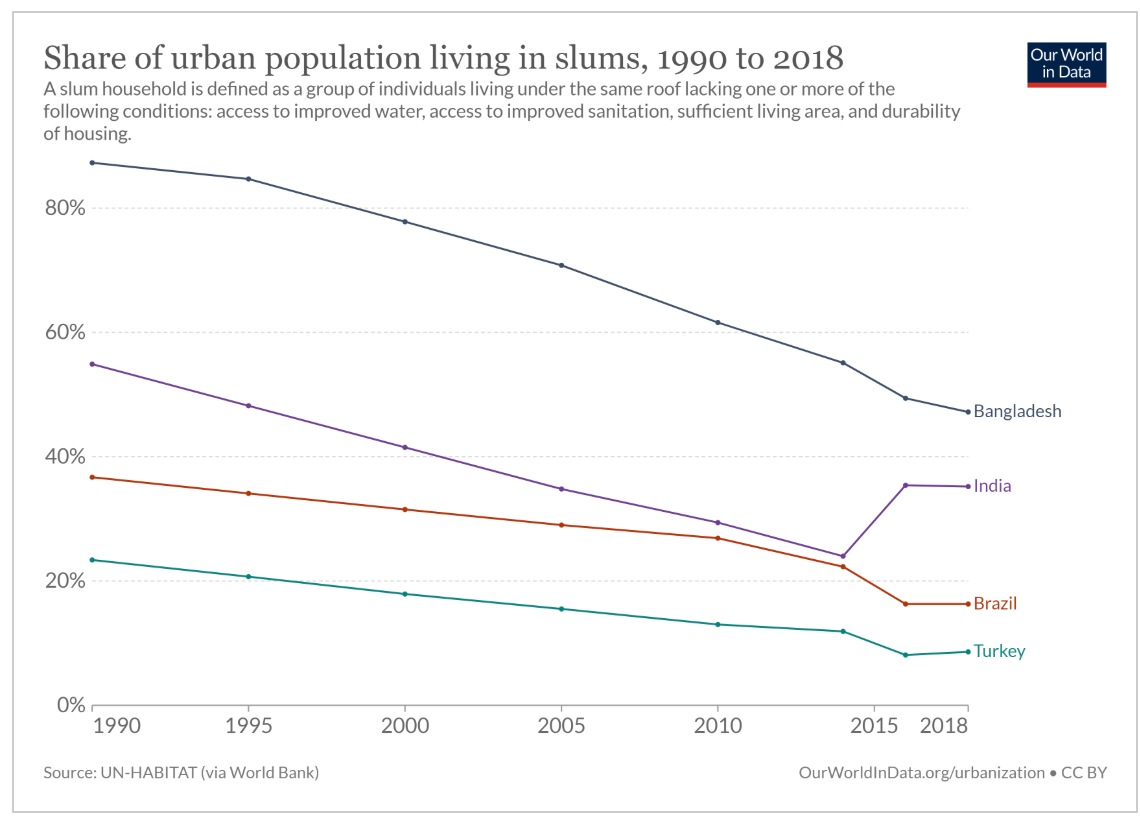
1. Identify the information provided on this chart.
2. Describe the changes that occurred in each of these cities based on the information on this chart.
3. Explain how the information on this chart relates to the sustainability and infrastructure of cities.
4. Describe some of the challenges these cities might face based on the information given.
5. Describe some possible changes that might have taken place in these cities in order for the number of people living in slums to have decreased during this time period as shown on this chart.
1.
-chart shows percentage of urban population living in slums in Bangladesh, India, Brazil, and Turkey from 1990-2018
-compares how share of people living in slums conditions changed over time in these countries
2.
-Bangladesh, percentage dropped from 87 percent to 55 percent, meaning living conditions improved
- India, percentage went down from 55 percent to 24 percent by 2014, but went up again after 2014
- Brazil, percentage slowly decreased from 37 percent to 16 percent, meaning there is steady improvement
- Turkey, percentage decreased from 23 percent to 8 percent and had the lowest slum population by 2018
3.
-lower slum populations mean cities have better housing and services
-cities have improved water, roads, sanitation and electricity
4.
-overcrowding, poverty, affordable housing and pollution
5.
-better housing, improved sanitation and water and more jobs
A. Describe industrialization.
B. Explain the changes that occurred during the Industrial Revolution.
C. Explain how a country can shift from being a periphery country to a semi-periphery to a core country as a result of industrialization.
A.
-when country starts using machines in factories to make goods instead of making them by hand
B.
-many machines were invented, factories were built in cities, people moved from farms to cities for jobs, transportation like trains and steam engines improved and goods were made faster and cheaper
C.
- a periphery country starts by selling raw materials
-then semi-periphery when it begins making some products and building factories
- finally core country when industry, technology, and education keeps growing, making advanced goods and gaining more power in world trade
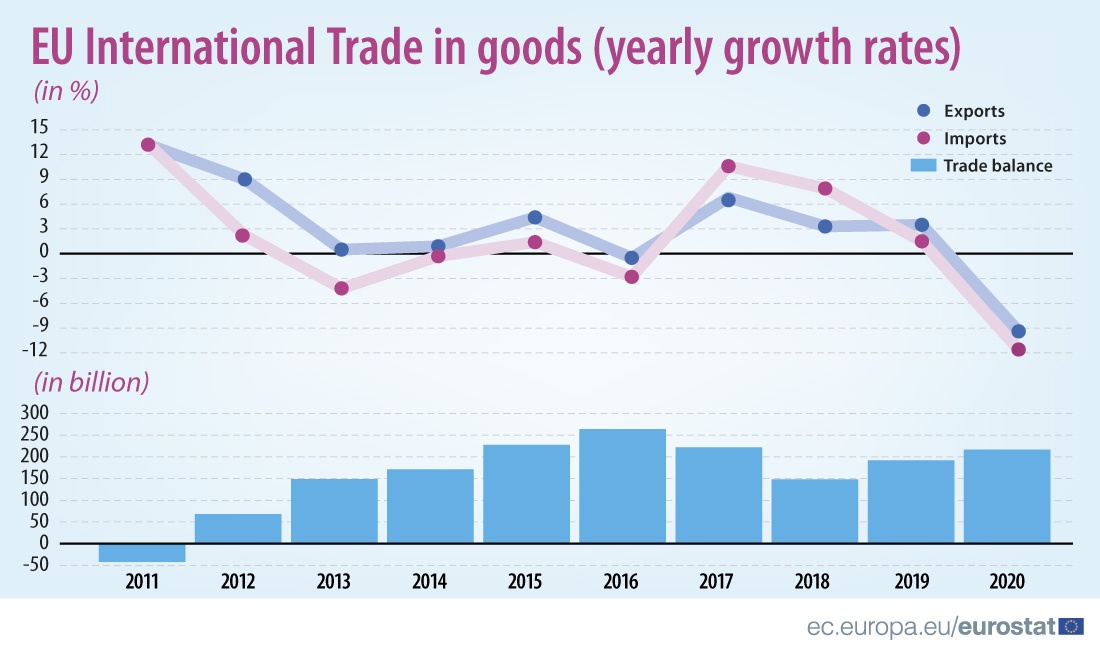
A. Identify the information provided on this chart.
B. Describe the pattern of international trade in the EU over the last decade.
C. Explain the changes that occurred between 2011 and 2020 based on the information on this chart.
D. Explain how the global crisis of COVID-19 in 2020 impacted international trade in the European Union based on this chart.
E. Describe some of the challenges EU countries might face based on the information given.
A.
- chart shows yearly growth rates of EU exports and imports from 2011 to 2020
-shows EU trade balance in billions of euros
B.
-EU trade changed over time as exports and imports increased in some years and decreased in others
-mostly rising after 2011 and then decreasing later on
C.
- in 2011 EU had trade deficit, in 2012 to 2016 trade balance improved and reached its highest point
-trade growth increased and decreased during the decade, in 2020 exports and imports dropped but EU still had trade surplus
D.
-COVID-19 impacted international trade with major decline in trade
-exports and imports fell below 0 percent, showing less trade took place between EU and other countries
-businesses and economies affected by the pandemic
E.
-lower demand for goods, leading to businesses losing money when trade decreases and workers losing jobs in export industries
- economic growth slowing down during periods of weak trade