HWE Exam III
1/102
Earn XP
Description and Tags
Lectures 19, 20, 21, and 22
Name | Mastery | Learn | Test | Matching | Spaced | Call with Kai |
|---|
No analytics yet
Send a link to your students to track their progress
103 Terms
Regions of the atmosphere (2)
Mesosphere, stratosphere, troposphere
Meso has most UV rays and IR radiation, trop has some IR radiation emitted from surface
Our greenhouse keeps us at 59F (2)
Sunlight goes through atmosphere, warms surface, then radiated back to space
Most outgoing heat is absorbed by GHGs and re-emitted in all directions, warming surface/lower atmosphere
Harms from depletion of ozone layer (4)
Average temperature of Earth’s surface will gradually increase
Increased amount of UV radiation will reach Earth’s surface
The oxygen content of the atmosphere will decrease
There is no harm, ozone is a toxic air pollutant (crucial to know: only at ground levels! Beneficial in atmosphere)
Attenuation of incoming solar radiation in Earth’s atmosphere (3)
Infared, visible, and UV: wavelength greater than 330 nm, penetration to Earth’s surface
UV: wavelength from 320 to 330 nm, 50 km in atmosphere
High energy: wavelength less than 100 nm, 200 km in atmosphere
UV rays and their effect on skin (3)
UVA rays: Longest rays (320-400 nm), penetrate deep into skin surface and cause DNA damage, result in skin cancers
UVB rays: Mid-length rays (290-320 nm), reach skin surface, cause tanning, burning, and signs of age
UVC rays: Shortest rays (100-290 nm), usually do not penetrate Earth’s ozone layer
Composition of unpolluted air (4)
Nitrogen: 756,000 ppm
Oxygen: ~203,000 ppm
Water: ~31,000 ppm
CO2: 400+ ppm
Atmosphere (4, 3)
Troposphere: 90% of all air molecules, 10% of ozone (“bad ozone”), 17 km above sea level at equator, 8 km over poles
Stratosphere: 10% of all air molecules, 90% of all ozone (ozone layer: found naturally), 30 km in depth
History of the atmosphere (4)
Initially no oxygen in the atmosphere
Around 2.3-2.7 bya, photosynthesizing cyanobacteria began adding oxygen to the troposphere, formation of protective ozone layer
Stratospheric ozone is essential to existence and most life on Earth
Tropospheric ozone is harmful to respiratory system and plants
Ozone cycle in the atmosphere (4)
O2 molecules are photolyzed, yielding 2 O atoms (slow process)
O3 molecules and O atoms are continuously being interconverted as solar UV breaks O3 into O2, and the O2 molecule quickly reacts with another O atom to yield O3 (fast process); (this interconversion process converts UV radiation into thermal energy, heating the atmosphere)
O3 is LOST by a reaction of the O atom or the O3 molecule with each other (O2 + O = O3) OR some other trace gas such as Cl2 (slow process)
Measuring ozone concentrations: The Dobson Unit (DU) (4)
The number of ozone molecules in a 0.01 mm layer of pure ozone OR
2.69 × 10^16 ozone molecules in a 1 cm² column of the atmosphere
Ozone hole average: 100 DU = 1 mm (thickness of a dime)
Global average ozone: 300 DU = 3 mm
Attacking ozone: A brief history (7)
Refrigeration: Food safety, Air conditioning; First refrigerants were toxic, flammable, and explosive (e.g. SO2, NH3)
Non-toxic alternatives (1928): Chlorofluorocarbons (e.g. Freon), Halons (contain bromine, fire-fighting chemicals)
Ozone-depleting pollutants: CFCs and halons (4)
Water-insoluble: Don’t “run out”
Persist up to 200 years: More stable than PCBs and polychlorinated pesticides
“Heavy”, but can move into stratosphere
Ozone hole over Antarctica (1)
Ozone hole: <220 DU
History of the ozone hole (3)
1960s: About 300 DU
Sharp decline from 1980s-1990s (about 285 to 150 DU)
Gradual recovery
Why is the ozone hole over Antarctica (7)
Chlorine: Normally stored as HCl and chlorine nitrate
Antarctic winter atmospheric conditions:
Polar vortex (swirling whirlpool of stratospheric winds) - Isolates air in vortex
Polar stratospheric clouds - Dark winters, Low temps, Cloud particles (water. ice, or nitric acid), Reaction of particles form chlorine gas (Cl2)
Polar stratospheric clouds (1)
Polar stratospheric clouds containing frozen crystals provide a reaction surface for the formation of chlorine in the Antarctic stratosphere
Why is the ozone hole over Antarctica (cont…) (6)
Sunlight in early spring (October):
UV light breaks Cl-Cl bonds
Cl atoms destroy ozone (catalytic reaction)
Warmer temperatures weaken polar vortex weaker
Dispersal of chlorine by air from the surrounding latitudes
Ozone layer stabilizes (until next spring)
Ozone destruction by chlorine atoms (3)
(Right to left):
O3 and Cl react, forming O2 and ClO (O3 destruction)
ClO and O react, forming O2 and Cl (O2 generation)
Net reaction: O + O3 → 2 O2 (Cl used as a catalyst)
UV Index Scale (2)
UV radiation reaching Earth changes O3 depletion and weather conditions
UV index published by EPA ranged from 1 to 11+
Health effects of UV radiation (5)
Human effects:
Sunburn, accelerated skin aging, skin cancer
Impaired immunological responses
Eye inflammation (can lead to cataracts)
Effects on animal and plant life as well
Stochastic health effects of radiation (4)
Associated with CHRONIC exposure to radiation
SEVERITY of stochastic effects are INDEPENDENT of dose (i.e. think of cancer)
PROBABILITY of having the effect IS dose-dependent: At the highest dose: Effect may OR may not occur (no “safe” exposure)
Linear, no threshold, dose response relationship (LNT)
Incidence of BCCs in males 45-59 at locations varying in average daily ambient UVR (2)
Graph displays stochastic effect, shows no safe “threshold” of exposure
The radiation doesn’t determine how severe the cancer is, but rather how likely it is to happen
Schematic diagram of the relation between UVR exposure and the burden of disease (1)
Minimum risk of disease requires optimal exposure to UVR (means getting enough UVR, not too high OR too low)
The 1987 Montreal Protocol was signed for which of the following reasons? (1)
To phase out the use of CFC's causing depletion of the ozone layer
Atmospheric lifetime and ozone depleting potential of selected gases (8)
Cl2 gases:
Freon (CFC-12): Atmospheric lifetime of 100 years, 1 ODP
CFC-11: Atmospheric lifetime of 11 years, 1 ODP
CCl4: Atmospheric lifetime of 26 years, 0.73 ODP
Br2 gases:
Halon-1301: Atmospheric lifetime of 65 years, 16 ODP
Halon-16: Atmospheric lifetime of 16 years, 7.1 ODP
Methyl bromide (natural!): Atmospheric lifetime of 0.7 years, 0.51 ODP
National and international regulations (7)
U.S.
CFCs in aerosol spray cans banned in 1977
CFC and halon manufacture ceased by 1995
International: Montreal (1987) and Copenhagen Protocol (1992)
First global environmental protection treaty
Ratified by 190 nations
Considered to be successful
Projected concentration of ozone-depleting chemicals in stratosphere (3)
No protocol: Highest
Only 1987 Montreal Protocol: Second highest (similar concentration to no protocol by 2100, just slower rise with Montreal implemented)
With 1992 Copenhagen Protocol: Significantly lower (big impact!)
How to reduce atmospheric levels of ozone-depleting substances (6)
Phase out of old appliances and collect CFCs
Assisting less-developed countries in phase out
Grace period in phase out: China banned CFCs and halons in 2007
Money for 3rd world manufactures to eliminate the product (like agricultural subsidies in U.S.)
Development of substitutes
Finding substitutes: EPAs Significant New Alternatives Policy (SNAP) Program (6)
Refrigeration and air conditioning
Fire suppression and explosion control
Fire-fighting halons work very well, alternatives are costly or toxic
Sterilants
Farmers “like” fumigant methyl bromide
Substitution of ozone-depleting substances: HFCs (6)
Manmade chemicals:
They do not deplete ozone layer, but are potent GHGs
Uses: Refrigerants, aerosol propellants, solvents, fire retardants
Atmospheric sources: Leaks, servicing, equipment disposal
American Innovation and Manufacturing (AIM) Act of 2020: Directs EPA to address HFCs!
What can I do to protect the ozone layer: EPA home appliance tips (7)
Repair air conditioners
Prevents ozone-depleting refrigerants from escaping
Make certain refrigerant is recovered before servicing
Remove refrigerant from equipment before disposal
Use EPA certified technician
Work with local officials: Help start a refrigerant recovery/recycling program
Man charged with sneaking banned GHGs into U.S. (1)
Damn thats crazy tho!
Composition of unpolluted air (again) (3)
CO2: 400+ ppm → latest figures (July 2024): 425.55 ppm
N2O (Nitrous oxide): 0.49 ppm
Air pollution kills people (7)
Established risk factors for adverse health effects
Especially dangerous for susceptible populations
Can cause: Severe respiratory problems, res. failure, CVD, cancer, impact fetuses
What is air pollution (13)
Ambient air pollution
Air around us, ground-levels, tropospheric
Criteria air pollutants
Criteria comes from the 1970 CAA
6 pollutants conformed to the definition (PM10, SO2, NOx, CO, O3, Pb)
National Ambient Air Quality Standards (NAAQS) (1)
Check out the link on slide 8: Includes pollutant, Primary/Secondary, Averaging Time, Level, Form
Primary vs. Secondary standards under the CAA (2)
Primary standards: Provide PH protection, including protecting the health of “sensitive” populations, such as asthmatics, children, and elderly
Secondary standards: Provide public welfare protection, including protection against decreased visibility, damage to animals/crops/vegetation/buildings
Important air pollutants (8)
Volatile organic pollutants (VOCs)
Group emitted in large amounts
Sometimes considered along with criteria pollutants
Major precursors of O3 (with NOx → nitrogen oxides)
Hazardous air pollutants (HAPs)
Organic (e.g. benzene)
Inorganic (e.g. asbestos, heavy metals)
Mobile sources (vehicles) in the U.S. (5)
290 million light duty vehicles
3+ trillion miles driven annually
Motor vehicles: About 50% of air pollution
Metropolitan areas: Over 50%
Sources of CO2, NOx, CO, O3, PM10, VOCs
Multipollutant emissions comparison (4)
NH3: Agricultural sources
PM10/2.5: Dust
SO2: Fuel combustion
VOCs: Varied, mostly mobile, then solvent, then industrial
CO (5)
Represents 50% of air pollution by weight nationwide and worldwide
Decrease since 1970s in US/Europe
Half of motor vehicle CO from only 10% of vehicles in US
Open burning bans
Adding oxygen containing fuel additives reduce CO in winter
CO health effects (5)
Causes 11% of hospital admissions for congestive heart failure in the elderly
Affects the brain, causing headaches, dizziness, fatigue, and drowsiness
Coma and death in confined places
Garage: Suicide
Bedroom: Malfunction of heating system (Important indoor air pollutant!)
CO sources: Incomplete combustion of carbon-containing fuels (6)
Urban traffic up to 80% of CO
Stalled traffic
Cigarette smoke (and e-cigs)
Coal burning (historical issue)
Biomass burned for cooking and heating
Atmospheric oxidation of methane gas (CH4)
Best time to jog and avoid CO pollution (2)
Go for a jog at 3 AM (daily variation of CO levels)
Winter has highest peaks, spring has lowest
Lead (Pb) (8)
Toxic heavy metal: Children are a susceptible population
Sources of lead in air
Lead additive in gasoline (still used in some countries)
Coal burning power plants, old water pipes
Other sources: Lead paint, solder, roadside soil, leaded tableware
Recycling lead-acid batteries: Occupational exposure
Lead air quality (1980-2012) (2)
Annual maximum 3 month average based on 13 sites
1980-2012: 91% decrease in national average!
Sources of SO2 (4)
#1: Coal fired power plants
Cars are a minor source
Volcanoes are big natural sources, 1991 eruption of Mt. Pinatubo cooled Earth for a few years
Second to CO as most common urban air pollutant
SO2: Why we care (6)
SO2 gas irritates the lungs, damages plants and trees
SO2 converted to aerosols:
Acid particulates are part of acid deposition
Cooling effect on the climate
Reactions can occur on particle surfaces: Contribute to destruction of stratospheric ozone
Nitric oxide (NOx) (4)
Various NOs
NAAQS (2010) based on NO2
Adversely affects respiratory system
EPA: No area of the country uncompliant with current NO2 standards!
NOx sources (4)
Mostly mobile, then fuel combustion, then industry
Burning fuel at high temperature: Reaction between atmospheric N2 and O2
BUT: High temperatures promote efficient combustion
Lower emissions of CO, PAHs, and other things at high temps
NOx vs SO2 (7)
NOx are precursors of ground level ozone (NOT SO2)
Like SO2:
Cooling effect on Earth as aerosols (nitrate/nitric acid)
Potent GHG
Unlike SO2:
Nitrate is a major plant nutrient
Important, toxic water pollutant from fertilizers
PM (3)
Tiny particles and liquid droplets
No fixed composition, size, and shape
EPA regulates PM10 and the MORE dangerous PM2.5
Why care about PM (2)
PM2.5 linked to increase in heart/lung disease, cancer
Don’t know about “bad actors” (sulfate, nitrate, elemental C, C compounds, metal oxides
Sources of PM (2)
PM10 sources: Farms, mines, roads, pollen, only 6% from fossil fuels
PM2.5 sources: Diesel motor vehicles, electric power plants, steel mills
Primary vs. secondary aerosols (8)
Primary aerosol particles:
Industrial/vehicle exhaust emissions
Wind-blown dust
Salt from dried sea spray
Secondary aerosol particles:
Gaseous pollutants in exhaust emissions
Emissions from land vegetation and marine organisms
Produced by photochemical processes in urban smog and higher atmosphere
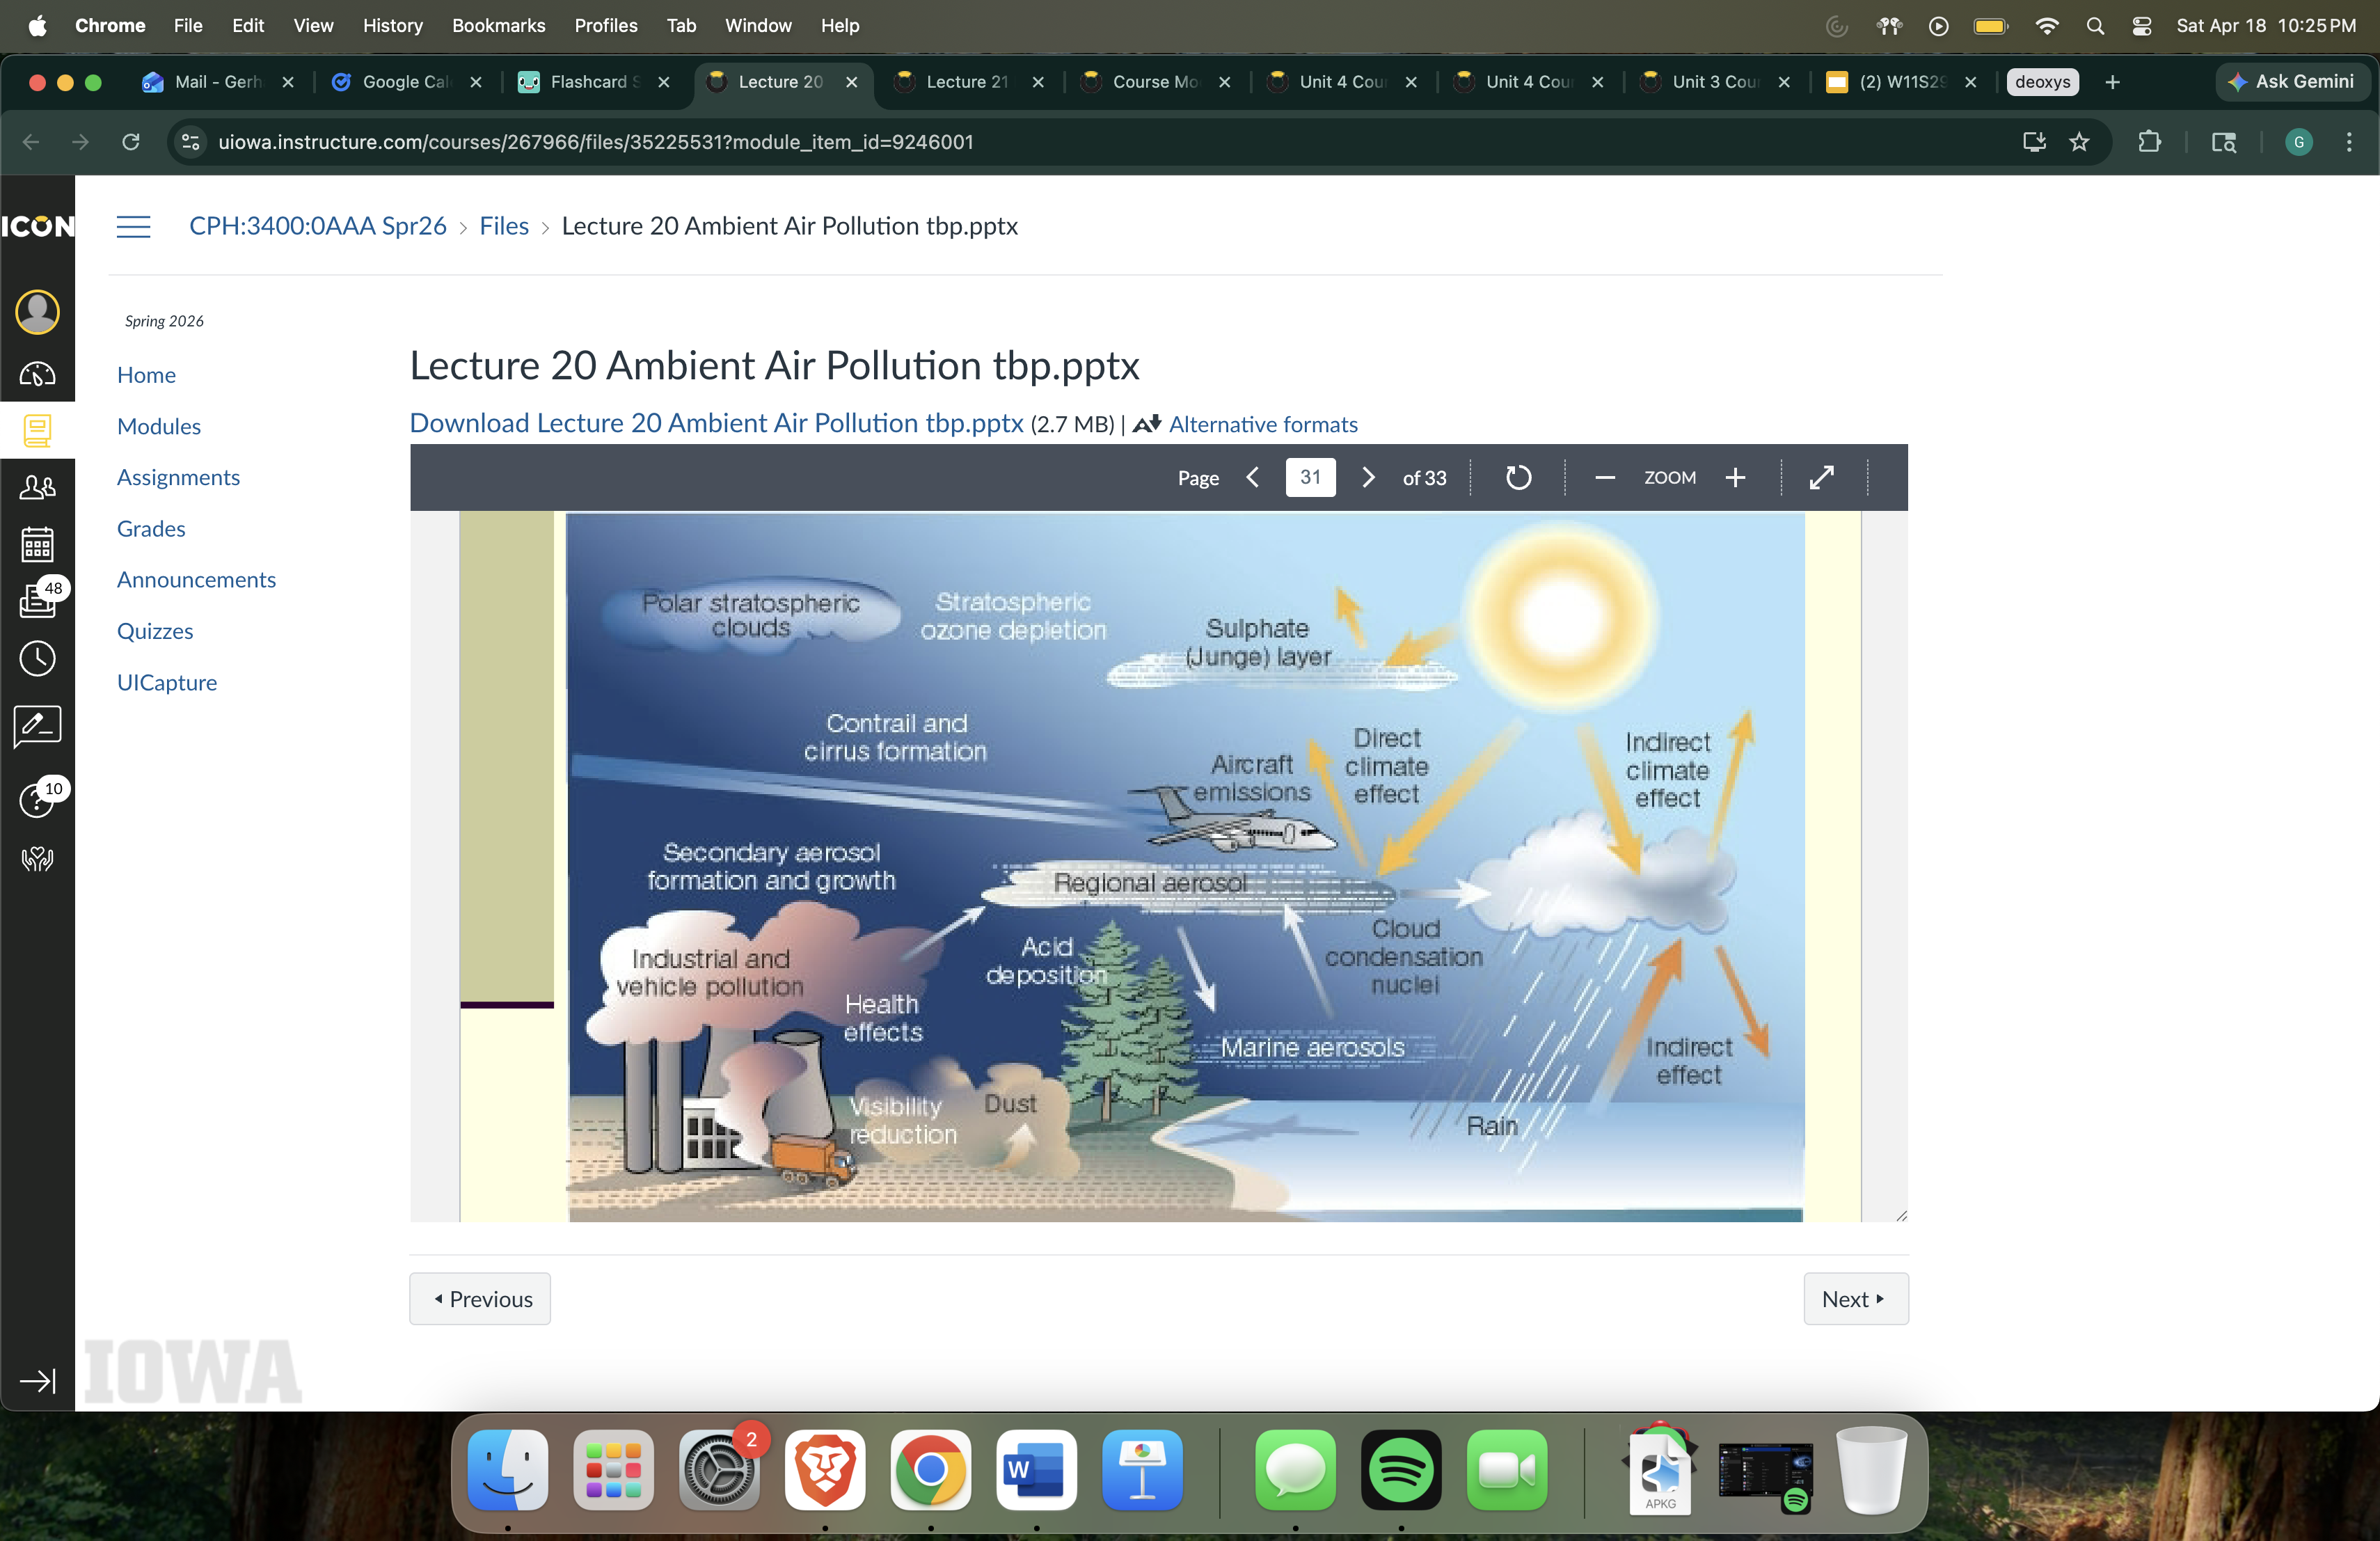
Atmospheric particles have many effects (8)
Ozone depletion in stratosphere
Acid deposition
Fine aerosol particles:
Affect human health, reduce visability
Influence climate both directly and indirectly
Aircraft emissions have disproportionate effect
Sea-salt aerosols are fairly large (generally not transported far above surface)
Atmospheric aerosols (image on slides)
Refer to image
Effects on ozone are location-dependent (1)
Ozone in stratosphere protects Earth, but is harmful in the troposphere
Ozone is NOT a primary pollutant, it is formed from precursors (NOx and VOCs) (6)
NOx + VOC + Heat and Sunlight → O3
Ground level “bad” ozone not emitted directly into the air, but is created through chemical reactions between NOx and VOCs in the presence of sunlight
Major sources of NOx and VOCs:
Emissions from industrial facilities and electric utilities
Motor vehicle exhaust
Gasoline vapors, chemical solvents
“Bad” ozone: Why we care (4)
Serious and persistent air quality problem
US Department of Agriculture: Ground level ozone causes more damage to plants than all other pollutants combined
EPA standard: 75 ppb
Many urban areas DON’T meet this standard
Epidemiologic triangle (3)
Three vertices: Agent (energy), Host (injured person), and Environment (physical and social)
Vehicle vectors connect these three points
Injury: External transfer of energy to human tissues in amounts that damage the cellular structure, tissues, blood vessels, or other structures
Types of energy (6)
Mechanical/Kinetic: Injuries from transfer of physical force (motor vehicle crashes, falls)
Thermal: Injuries from heat/cold exposure
Electrical: Injuries from electrical current
Chemical: Injuries from toxic/corrosive substances (OD)
Radiant: Injuries from radiation
Oxygen depravation (non-energy mechanism): Injuries from lack of oxygen
Classification of injuries (5)
Internal Classification of Diseases (ICD) injury matrices:
Organizes injury data into helpful groupings to make national and international comparisons
Classifies two dimensions: External cause (crash) and nature of injury (fracture)
Additional terms to know (2)
Intent of injury: Whether an injury was caused by an act carried out on person by oneself or another person with the goal of injuring or killing
Intentional injury: Injuries that result from self harm, legal intervention, interpersonal actions, and acts of war
Unintentional injury (5)
Damage or harm that is caused by external factors without intent or purpose
Important to note:
The term unintentional is preferred to accident (unless referring to motor vehicle injuries)
Accident implies a random event that cannot be prevented
Most unintentional injuries are preventable
Leading causes of death from injury (6)
Unintentional injuries:
Unintentional poisoning (OD)
Fall
Motor vehicle crash
Suicide, homicide
Death by age group (5)
Unintentional poisoning (OD) is the leading cause of injury deaths across ALL age groups
Infants <12 months: Suffocation
Children to young adults (5-24 y.o.): Motor vehicle injuries OR firearm
Adults 35-64: Unintentional poisonings (OD)
Older adults: Falls
Leading cause of death by year age 1-44 (4)
Poisoning (exponential increase 2015-2020) > Motor vehicle traffic > Drowning/Falls > Other unintentional
Injury surveillance (1)
Ongoing, systemic collection, analysis, interpretation, and dissemination of data regarding a health-related event
Where to find injury/violence stats (1)
FARS, SUDORS, NVDRS, WISQARS (national electronic injury surveillance system all injury program)
Non-fatal injury, 2023 (2)
Fall, struck by/against, motor vehicle occupant, poisoning
Total: 26.7 million
Haddon Matrix (7)
Left rows include: Pre-event, Event, Post-event
Top columns include: Host (victim), Agent (energy), Vector (animate), Vehicle (inanimate); Physical environments, and Social environments
SOII Data (7)
Survey of Occupational Injury and Illness (SOII)
Weighted sample of about 230,000 establishments
Bureau of Labor statistics
Use of data from injury and illness record keeping forms: OSHA 300 or internal tracking
Excludes federal employees, self-employed, farms with <10 employees
High risk industries: OSHA requires tracking (external vis OSHA 300)
Low risk industries: Internal tracking still required, but not by OSHA
Recordable injury/illness (4)
Any work-related fatality (in COFI)
Any work-related injury or illness that results in loss of consciousness, days away from work, restricted work, or transfer to another job
Any work-related injury or illness requiring medical treatment BEYOND first aid (miss minor injuries)
Any work-related diagnosed case of cancer, chronic irreversible damage, fractured/cracked bones or teeth, and punctured eardrums
Magnitude of nonfatal workplace injuries, private industry 2024 (3)
Estimated number of nonfatal occupational injuries/illnesses: 2.5 million
Nonfatal occupational injuries: 2.34 million (94%)
National occupational illnesses: 150,000 (6%)
Injury by event or exposure, private industry 2023 and 2024 (2)
DART (days away from work, restriction, or transfer) = DAFW (days away from work) + DJTR (days of job transfer or restriction)
About 1.46 million DART injuries per year
Hierarchy of controls (6)
(Most effective)
Elimination: Physically remove hazard
Substitution: Replace hazard
Engineering controls: Isolate people from hazard
Administrative controls: Change how people work
PPE: Protect workers with PPE
(Least effective - requires employees to protect themselves from hazards)
Hierarchy of fall protection (6)
Hazard elimination
Passive fall protection (engineering)
Fall restraint systems (PPE)
Fall arrest systems (PPE)
Controlled access zones (No good admin control for fall protection)
Increasingly less effective from elimination to controlled access
Census of fatal occupational injuries
An event or exposure in the work environment that causes or contributes to a death
5000 deaths compared to 2.5 non-fatal injuries
Leading causes: Transportation, falls, contact incidents, violent acts
What is the difference between the epidemiology of fatal injuries and fatal occupational injuries? (2)
The epidemiology of fatal occupational injuries focuses exclusively on deaths occurring while working, often due to acute, preventable events, using surveillance like CFOI
In contrast, general fatal injuries cover all fatal events, including unintentional injuries (such as road traffic)
Regulations (5)
The National Labor Relations Act (1935): Doesn’t include agricultural workers in its protections
United Farm Workers 1966: Cesar Chaves and Dolores Huerta
The Labor Standards Act (1938): Exempted small farms from the minimum wage
Minimum age of 14 (not 16), for family farms, can begin working at 12!
Hazardous tasks can be performed at 16 (not 18)
Percent working in agriculture (5)
26% of global population
2% of U.S. population
1900: 40% of U.S. → 1930: 21% of U.S.
Trends: Number of farms is decreasing, Average farm size is increasing, Land in farms roughly same
U.S. farms and their value of production by farm type (2)
Highest number of farms are small, but their production value is small
Large-scale farms make up only 5% of farms but about 50% of production
Median income of U.S. farm households by income/farm type (3)
Small farms make most of their income from off-farm sources
Midsize farms make about half of their income from farming
Large-scale farms make TONS of income, almost completely from farming
Farm workers and managers are different populations (4)
ACS Data:
Farmworkers: 26% female, 63% hispanic, 56% are U.S. citizens
Farm manager/supervisor: 17% female, 29% hispanic, 83% are U.S. citizens
Farmer/producer: 36% female, 3% hispanic
Occupations with high fatal work injury rates (2)
Fishery/logging workers, aircraft pilots, and recyclable material collectors all have high fatal work injury rates
Occupations with high NUMBER of fatal work injuries are driver workers/truck drivers and farmers/ranchers
Fatal injury ranking by occupation (8)
Farmer:
Transportation
Falls
Violence
Farmworker:
Transportation
Contact with the machine/object
Exposure to harmful substances/environments (electric current, confined space)
Number of fatal injuries in agriculture, Illinois (2)
By far, most from tractors, then roadway-related
Grain bins and farm equipment
Acute injuries (3)
Tractor rollovers account for 50% of farm-related fatalities
Roll-over protective structures (ROPS) help prevent
Less than 60% of tractors have ROPS
Challenges in quantifying non-fatal injuries (4)
BLS does not count as self-employed
SOII excludes <11 employees
Underreporting of injuries
Total number of workers difficult to count
Farm related counts and injury severity by injury cases (2)
Highest amount from falls, significant amount are moderate/severe
Then natural, machinery, and motor vehicle non-traffic
Injury diagnosis for farm-related injuries (2)
Over half are fractures
Then, open wound, superficial injury, and internal organ
Distribution of injuries from transportation sources (3)
Vehicle traffic and vehicle non-traffic
Ag. vehicle non-traffic
Riding animal, ATV non-traffic
Special hazards of livestock farming (8)
Contact with animal: 5% of fatal deaths
Acute and chronic respiratory hazards:
Gases - H2S, NH3
Organic dust exposures
Zoonoses
Noise
Livestock insecticides
Low back and upper extremity MSD among dairy farmers
Special hazards of crop farming (5)
Injury: Heavy machinery (high risk for injury), Grain storage
Illness: Pesticides/agricultural chemicals, Grain dusts (Organic Dust Toxic Syndrome)
Specifically, Farmer’s Lung (allergic reaction to mold spores)
Ergonomic exposures (vibration)
UV radiation
Pesticide exposure (3)
Organophosphates:
Symptoms: Unconsciousness, constriction of pupil, muscle twitches, secretions from nose and mouth, breathing difficulty
Mechanism of Action: Blocks enzyme that breaks down acetylcholine
Grain engulfment and entrapment (2)
After 4 seconds: Sink knee-deep in the suction of flowing grain, cannot be freed without help
After 20 seconds: Buried (engulfed), mostly fatal
Describe Flowing grain, Bridged grain, and Vertical grain wall avalanche (3)
Flowing grain: Sink down into grain that is flowing out of storage
Bridged grain: Thin grain bridge with large hole underneath, likely to collapse and then entrap
Vertical grain wall avalanche: Huge wall of grain crashes down, buried underneath
Lifelife system stet-up
Research, is it PPE or engineering controls to protect against falling into grain?
Musculoskeletal disorders (2)
Hazard: Heavy lifting; Repetitive movements during planting, pruning, and harvesting
Control: Proper fit tool, Job rotation