AP Stats Chapter 12
1/29
There's no tags or description
Looks like no tags are added yet.
Name | Mastery | Learn | Test | Matching | Spaced | Call with Kai |
|---|
No analytics yet
Send a link to your students to track their progress
30 Terms
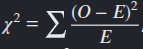
what is the chi squared formula
high x² value means ??
greater evidence against the null hypothesis, sample is far from what we expected
low x² value means ??
null hypothesis is true, value close to zero means sample is close to what expected
what should your large counts be greater than? and how do u format it
(expected values) > 5
what is x² cdf? like what does it calculate / mean
the probability that x² is less than or equal to a specific value, given df.
ALSO
total area under the curve from 0 to that specific value.
what is the layout you should follow when inputting x² cdf?
x² cdf (x², 99999, df)
when do you need to include a follow up analysis ?
when Ho is rejected
what is the sentence structure for the follow up analysis
the largest component of x² is _____ because the observed counts of ____ was higher/lower than expected
if there is an association given in the prompt, wjhat procedure do u choose?
chi squared test for INDEPENDENCE
how would you find the expected count? ( this is just the formula )
expected counts = ( row total ) * ( column total ) / grand total
how do you find df in table
(rows - 1) * (columns - 1)
how to calculate on calculator for expected after observed
first edit the matrix. only enter the observed. leave one matrix empty for the expected
go to stats, test, then choose x² - test and input the matrixes.
how do you find expected count when there is only one category / row?
n * p … sample size * probability
if < .05, we …? ( do we fail and reject or not? )
If < .05, we REJECT Ho and we DO have evidence for Ha
if > .05, we …? ( do we fail and reject or not? )
If >.05, we FAIL TO REJECT Ho and we DON’T have evidence for Ha
when should you use test for GOF?
when you only have 1 sample and 1 variable
when should you do a homogeneity test?
when you have 2+ samples and 1 variable
how do you know when the test is for independence?
1 sample and 2 variables
when looking at data in a table, how can you know if the test is or isn’t GOF?
single row / column OR one - way table = GOF
two - way table = NOT GOF
what should you write for the hypothesis for each different test?
GOF: decimals (ex: if 10% claimed, p = 0.10) OR words (xxx’s claim is/isn’t correct)
Independence: WORDS ONLY || There IS/ISN’T an ASSOCIATION between variables ….
Homogenity: WORDS ONLY || There IS/ISN’T a DIFFERENCE in the distribution of ….
what is large counts formula for chi squared
n * pi > 5
how to find minimum sample size needed? ( Large Count Condition )
1) find smallest proportion
2) 5 / smallest proportion
How does increasing Degrees of Freedom affect the chi² distribution?
The curve becomes less skewed (looks more Normal).
The mean of the distribution increases
The critical value required to reject H0 gets larger ( becomes harder to reject null hypothesis).
hypothesis template for GOF
Ho: the claimed distribution of [ variable ] is correct / stay the same
Ha: At least one of the proportions in the distriubution of [variable] is different from the claim
what does the P value MEAN?
the probability of getting a test statistic at least as large as the one you calculated
OR
P(x² > your value)
format layout for p - value interpertation
Assuming that Ho (explain what it is) is true, there is a [P-value] probability of getting a x² test statistic of (your x² value) or greater purely by chance
how to find expected counts for homogenity
row total * column total / grand total
a low x² value means …?
observed and expected are close
if they ask u to find the p value / probability , use ??
x² cdf
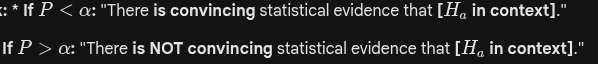
“there IS / ISN’T convincing evidence” … when do you use either statement (p-val)