Lecture 11: Climate-smart conservation
1/6
There's no tags or description
Looks like no tags are added yet.
Name | Mastery | Learn | Test | Matching | Spaced | Call with Kai |
|---|
No analytics yet
Send a link to your students to track their progress
7 Terms
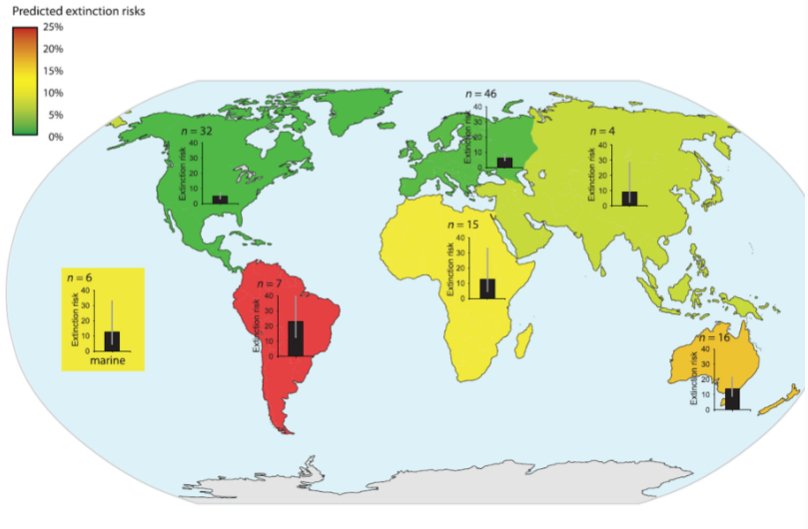
Global extinction risk
(Urban 2015)
estimating global extinction risk from climate change across all taxa and regions and determine how risk scales with warming
meta-analysis of 131 published studies comprising >5 million species projections
integrated predictions across multiple models, regions, and taxa
examined how extinction risk varies by warming scenario (1.5°C, 2°C, 2.8°C, 4°C+)
identified geographic hotspots of highest
vulnerability
overall extinction risk is 7.9% (95% CI)
extinction risk high for South America (~25%), medium-high for Australia (15-20%), medium for Africa and marine (10-15%)
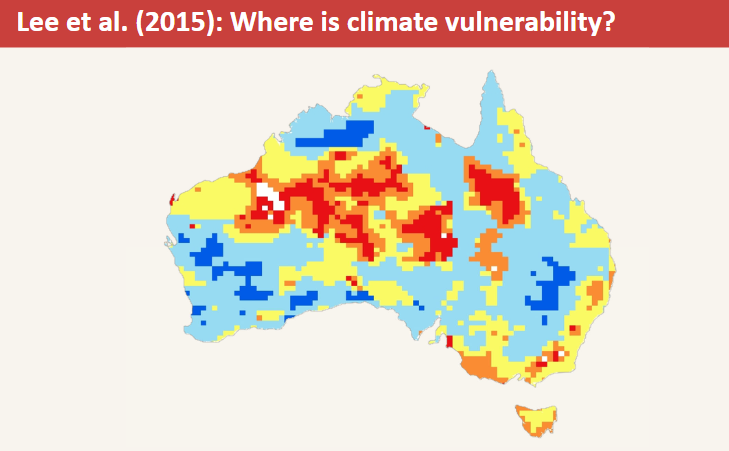
Causes of climate change vulnerability in Australian threatened species
(Lee et al. 2015)
determine what causes climate change vulnerability in Australian threatened species, and where vulnerable
species are concentrated geographicallyassessed 213 Australian threatened species (mammals, birds, reptiles, amphibians, plants)
used NatureServe framework: exposure (temp/moisture change) + sensitivity (habitat specificity) + adaptive capacity
mapped what is causing vulnerability across the continent to identify conservation hotspots and priorities
45% of threatened species moderately-to-highly vulnerable
amphibians most vulnerable
they have small, fragmented ranges, dependent on moisture regimes and aquatic habitats
plants second most vulnerable
low dispersal ability, specific soil types, sensitive to drought
birds least vulnerable
excellent dispersal ability, plasticity
Mountain Pygmy Possum most vulnerable
snow melt, habitat loss, ski resort development
Key traits that make some species more vulnerable
Range size
small ranges mean higher vulnerability (already habitat-limited, nowhere to shift)
Habitat specificity
species dependent on particular moisture regime, disturbance type, or substrate are vulnerable when those conditions shift
Dispersal ability
plants (slow), amphibians (habitat-dependent), reptiles (slow in fragmented landscape), birds (excellent)
Generation time
long-lived species (trees, large mammals) can't evolve fast enough
short-lived species (insects, small mammals) may adapt quickly
Niche breadth
specialists (specific diet, temperature range)
generalists (can adjust to changing conditions)
Montaine frogs have a restricted range and specific moisture habitat with poor dispersal through dry landscape
thus, they are extremely vulnerable
Direct physiological exposure
Heat stress
exceeding physiological tolerances means mortality during extreme heat events
e.g. Carnaby's Black Cockatoo during 2010
heatwave in Hopetoun, WA killed ~50% of
population in a few days
Mechanism
high ambient temperature and humidity prevent thermoregulation resulting in fatal hyperthermia
Drought-induced stress
precipitation changes lead to water stress, reduced growth, or mortality
e.g. Amazon drought experiment (2010) where large
tree mortality increased 4x in experimental
drought plotseven old-growth forests, thought resilient, fail under extreme drought
Disrupted development
For many reptiles sex is determined by nest incubation temperature, not genetics.
over 400 species including sea turtles, crocodilians etc.
Threshold temperatures:
<27.7°C = males
>31°C = females
27.7°C-31°C = mixed
Climate warming means nearly all female offspring
at many nesting sites globallye.g. Raine Island, Australia (99% female green turtles)
e.g. Cyprus (97% female)
e.g. Dutch Caribbean (91% female Leatherbacks)
Conservation problem:
few males signify reproductive failure and local extinction within decades
Mitigation:
nest shading, water management, translocation to cooler sites
all expensive and temporary solutions
Timing Mismatch
Phenology is the timing of life-cycle events (migration,
flowering, emergence, breeding)Climate warming advances spring at different rates across species resulting in a temporal mismatch
e.g. migratory birds arrive at breeding grounds, but insects haven't emerged yet resulting in food shortage for chicks and reduced fledging success
phenological mismatch results in a trophic cascade effect
Pollination mismatch where flowers bloom before
pollinators emerge (or vice versa), leading to reproductive
failureMarine phenology
e.g. zooplankton peak earlier causing a mismatch with larval fish recruitment; subsequent food web collapse
Phenological plasticity has limits if mismatch is greater than adaptive capacity
this means populations can decline even without habitat loss
(Scheffers et al. 2016)
measure how many ecological processes are being
impacted by climate changeidentified 94 core ecological processes that underpin ecosystem function and human wellbeing
reviewed scientific literature to document observed climate change impacts on each process
quantified proportion of processes affected by climate change within each biological level and ecosystem type
82% of biological process impacted (77/94)
marine (25/31)
freshwater (23/31)
terrestrial (29/32)