AP STATS
1/23
There's no tags or description
Looks like no tags are added yet.
Name | Mastery | Learn | Test | Matching | Spaced | Call with Kai |
|---|
No analytics yet
Send a link to your students to track their progress
24 Terms
Categorical Data
Describe categories or labels
NOT numbers you calculate with
Examples:
Eye color (brown, blue, green)
Gender
Favorite subject
👉 Think: "groups"
Quantitative Data
Take on numeric values
You can do math with them
Examples:
Height (in inches)
Test scores
Number of siblings
👉 Think: "numbers you can calculate with"
Individuals
the objects/people you're studying
Two-way Tables
A table of counts describing two categorical variables
Marginal Distribution
a summary that shows the totals for one variable in a table, using the row or column total
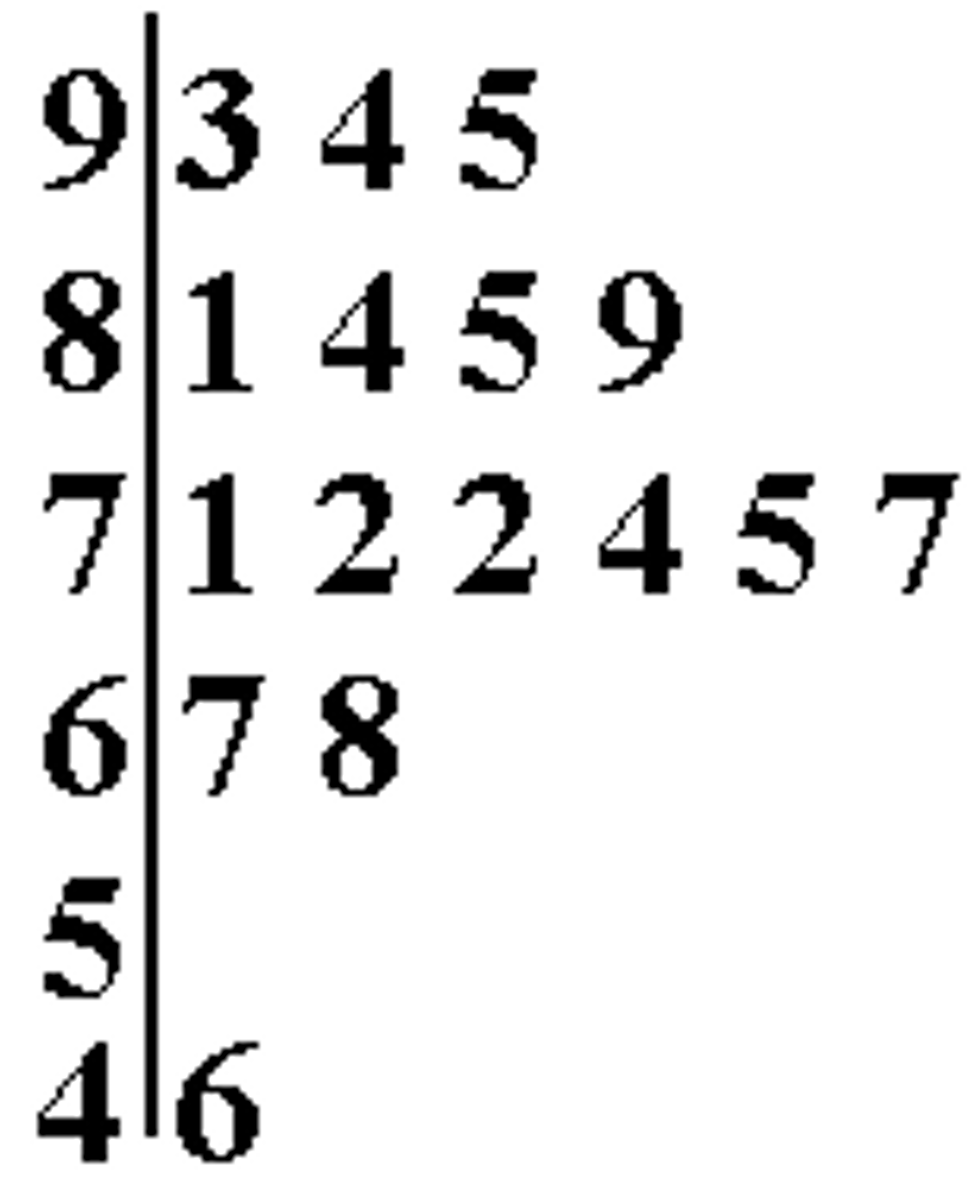
Stemplot advantages and disadvantages
Advantages: see exact values
Disadvantages: overwhelming for large datasets
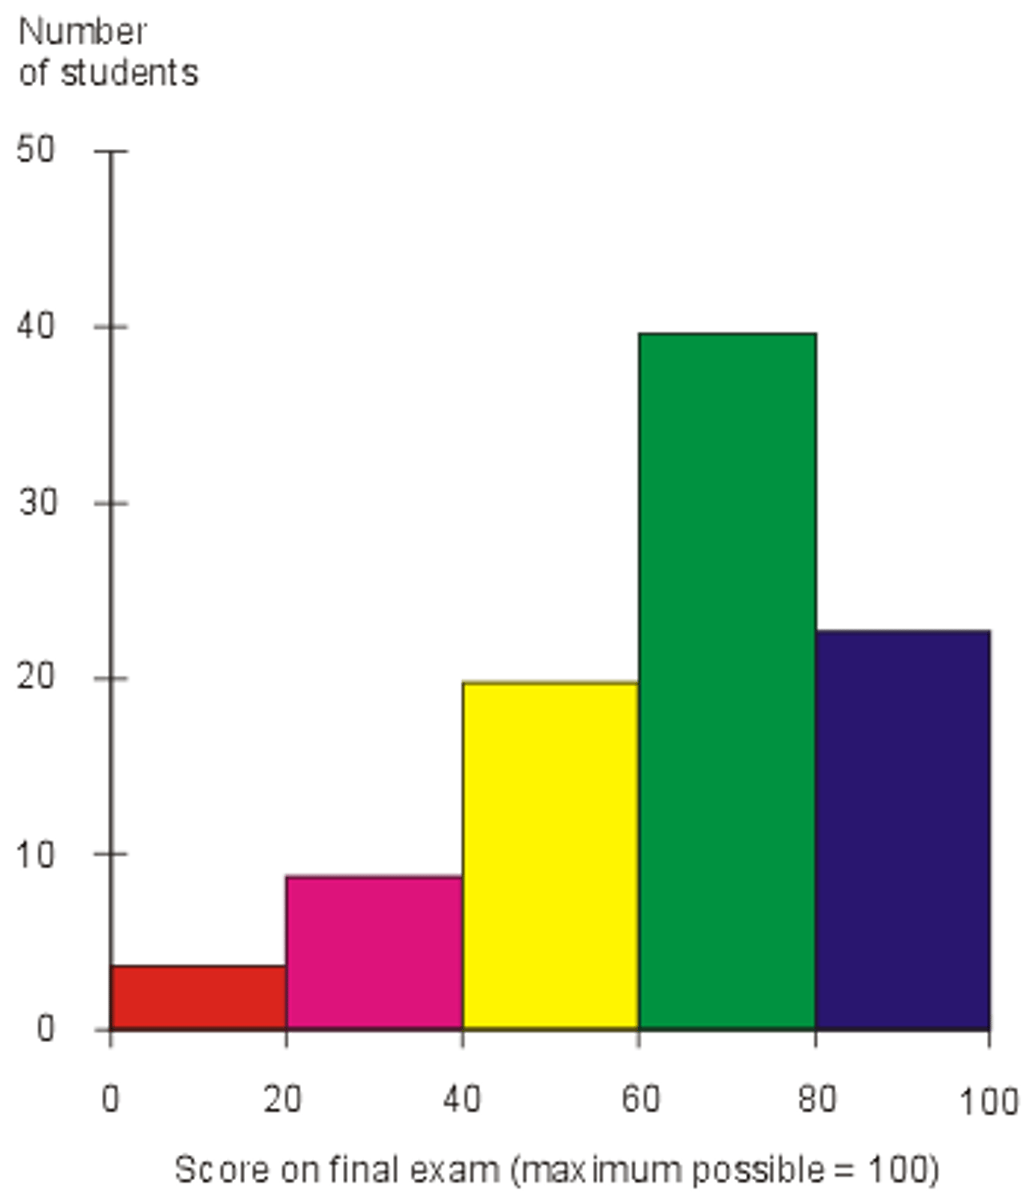
Histogram advantages/disadvantages
Advantages:
Good for large data sets
Helps focus on the general shape of the data
Disadvantages:
Individual data values are not visible (lost)
Distribution shape affected by change in bin width
Frequency
the number of times something occurs
relative frequency
how often something happens out of the total (fraction/percentage)
z-score
a measure of how many standard deviations a data point is above/below the mean
formula: data point-mean/SD
Standarization
a point location in the distribution depends on both distance from the center and the distributions spread of variation
Positive Z-score
number of standard deviations above the mean
negative z-score
number of standard deviations below the mean
adding or subtracting same number to every data
center: increases or decreases by that number
spread: stays the same
shape: stays the same
multiplying or dividing the same number to every data value
center: multiplies/divides by that amount
spread: multiplies/divides by that amount
shape: remains the same
Describe the distribution
CSOCS
Context-what variables is being measured
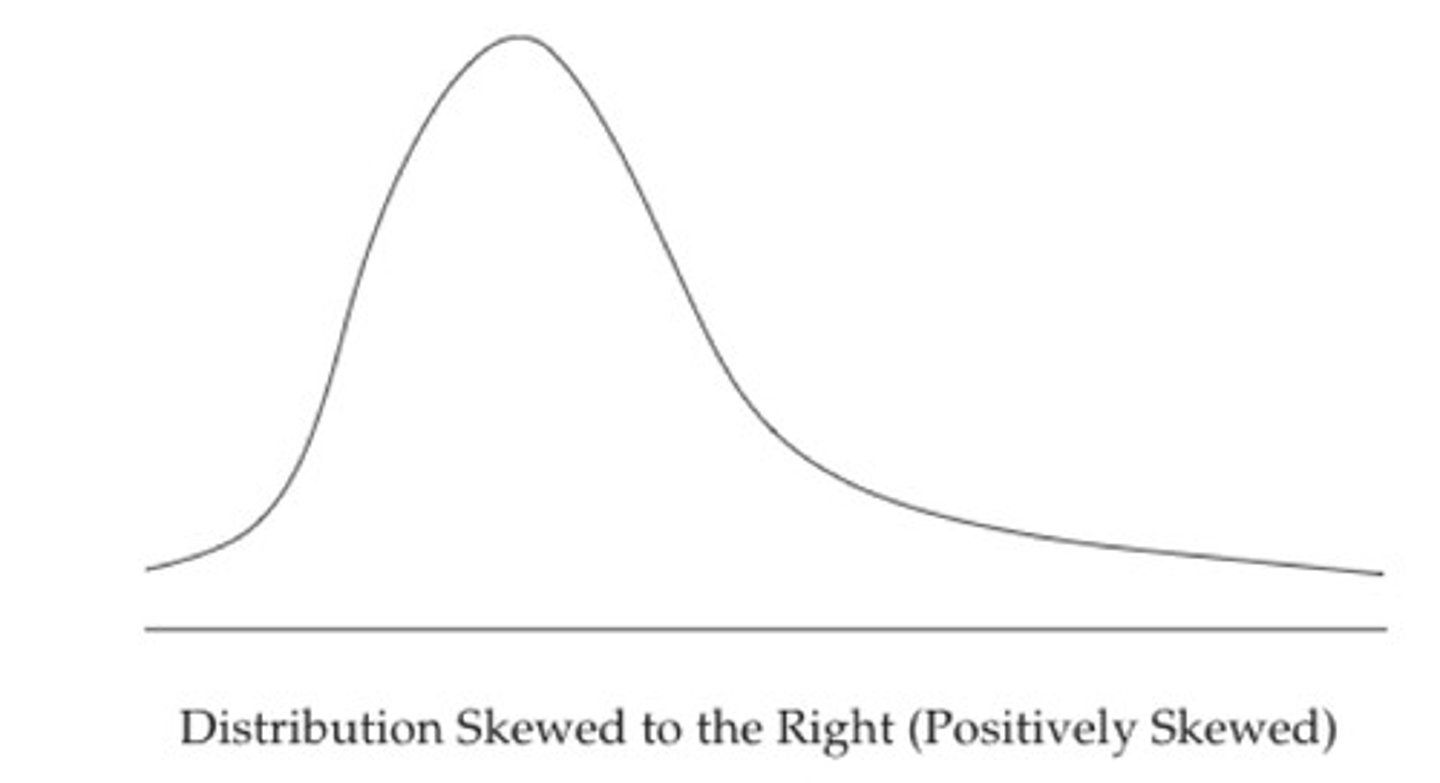
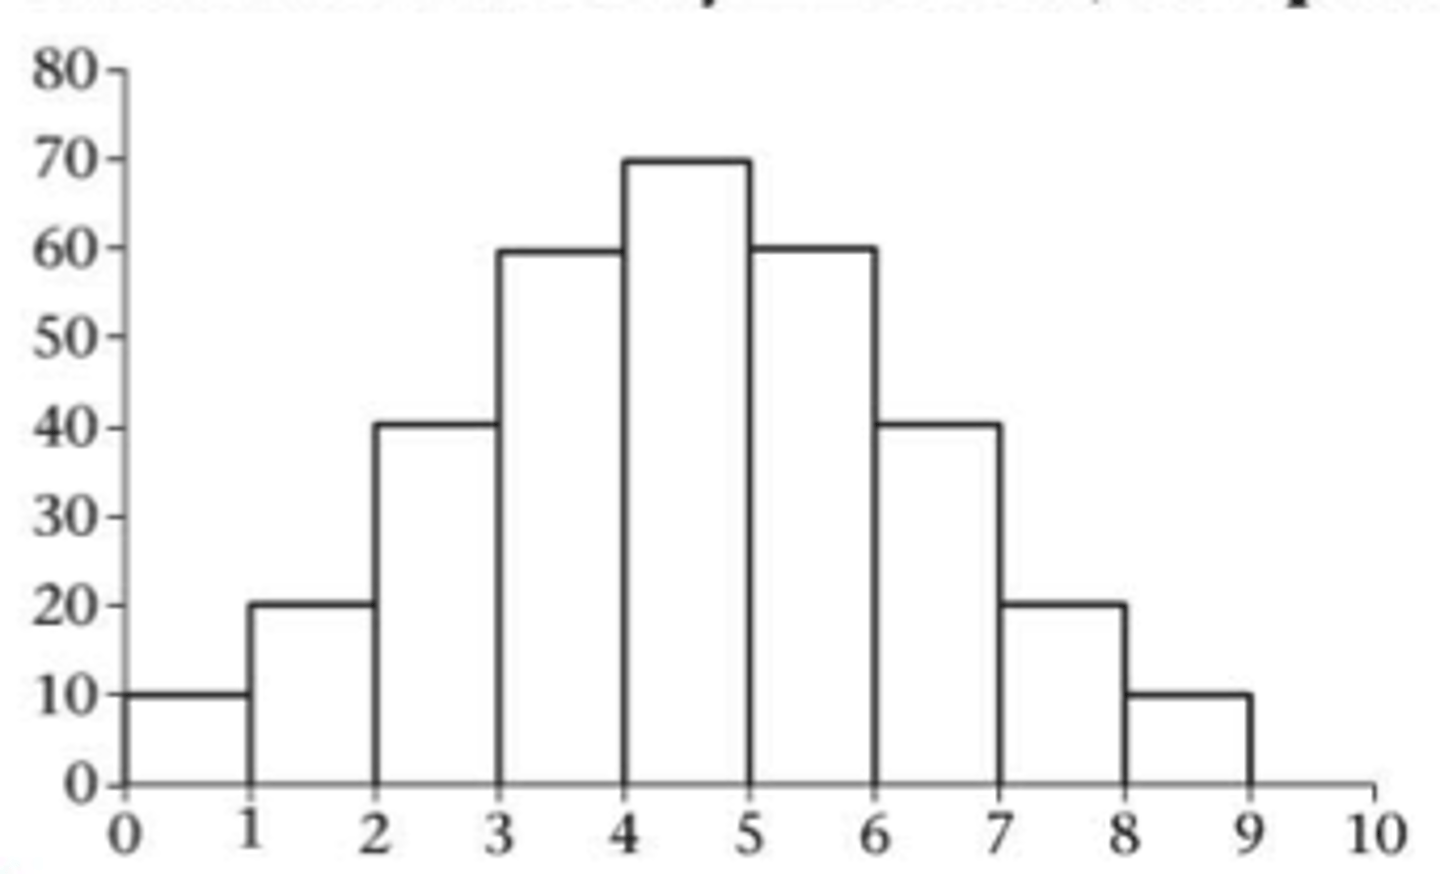
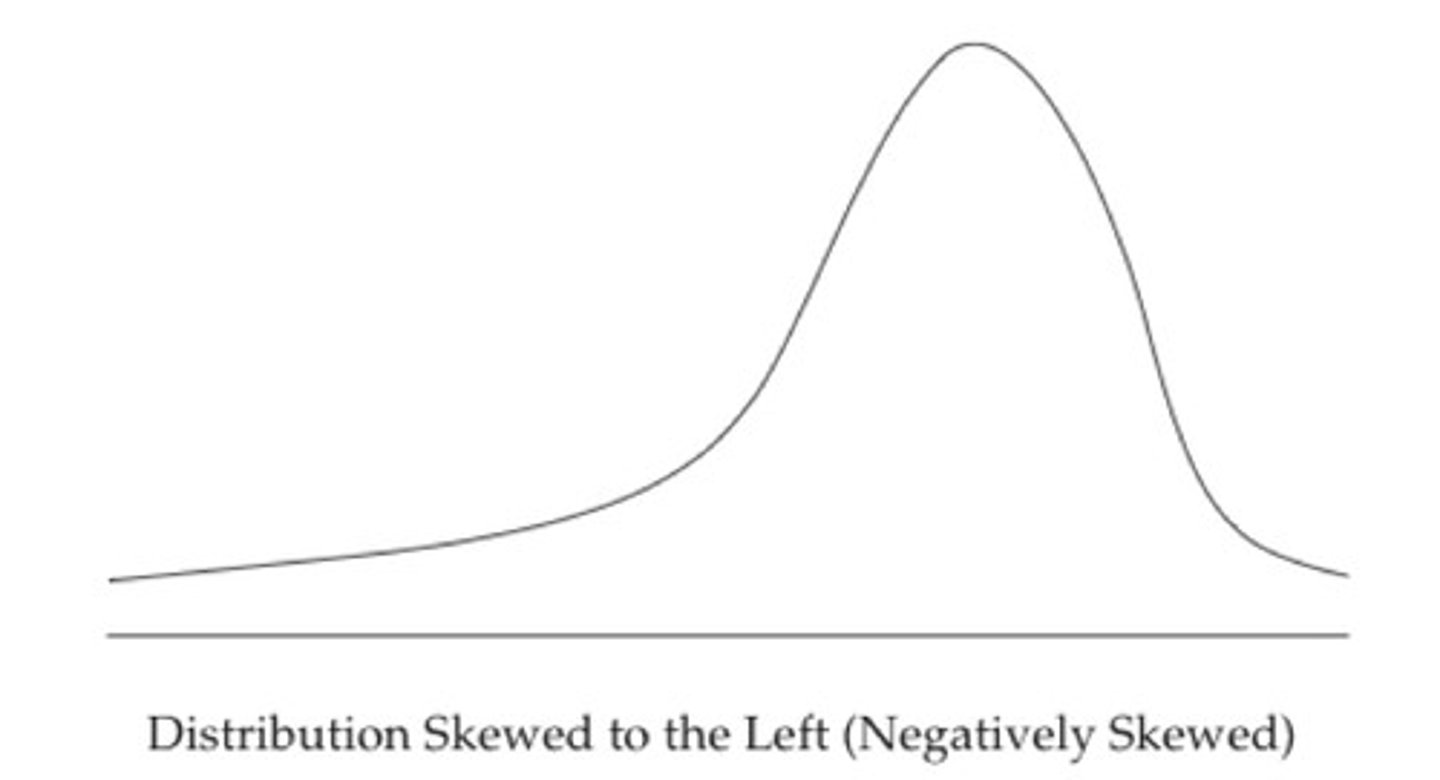
Shape-right/left skew, symmetric, modes
Outliers- unusual point
Center- Mean,median,general center
Spread- Range,IQR,SD
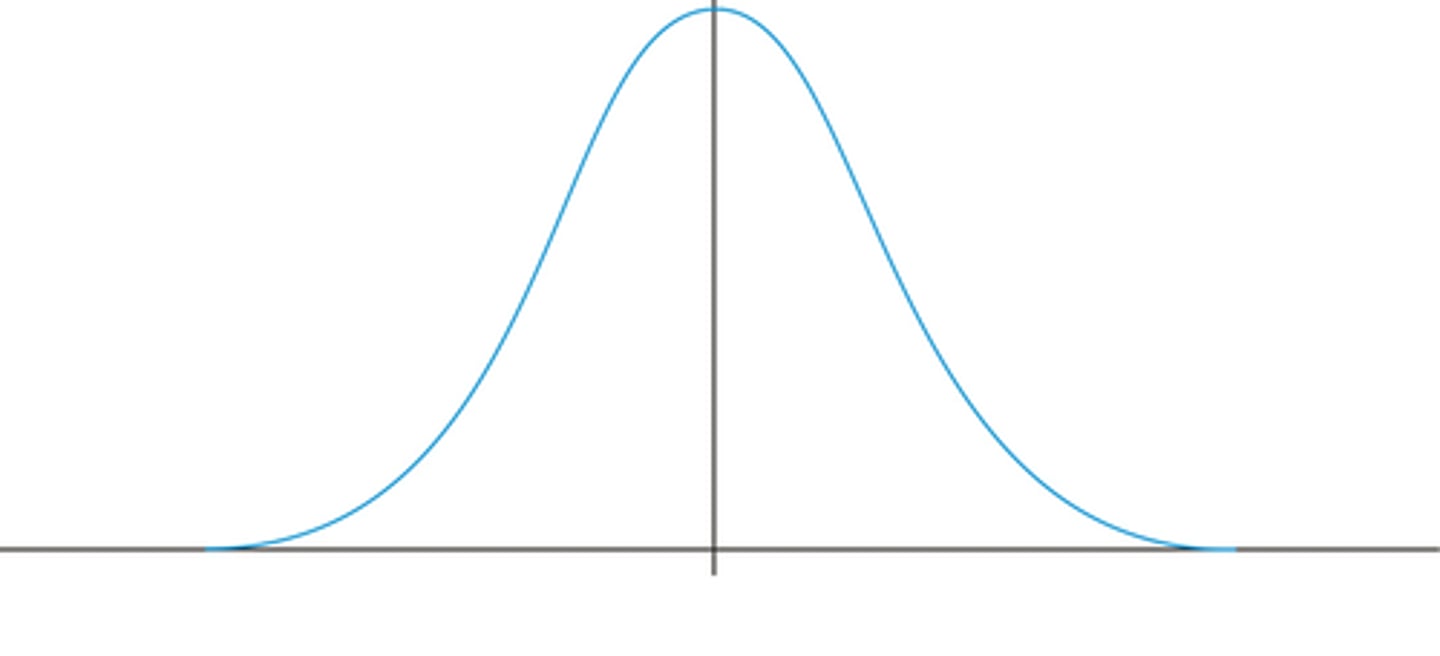
UNIMODAL
one peak
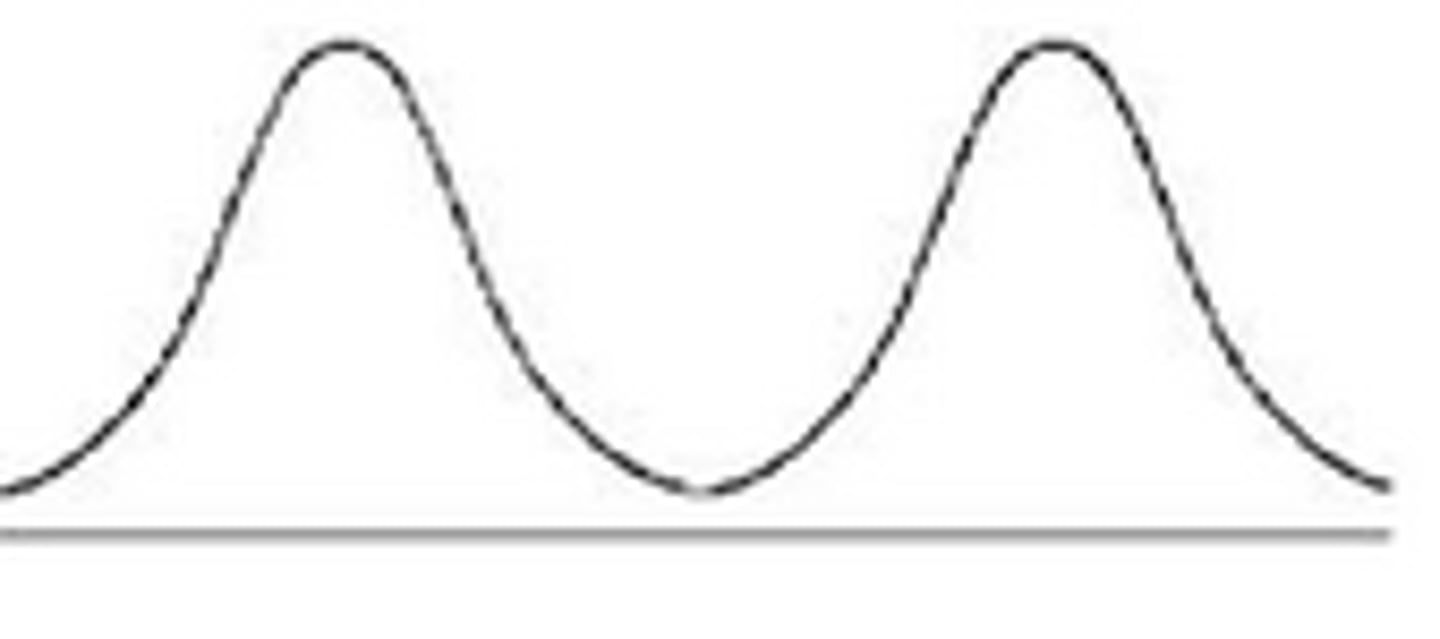
BIMODAL
two peaks
RIGHT SKEW
mean > median
SYMMETRIC
mean = median
LEFT SKEW
mean < median
RANGE
MAX-MIN
IQR
Q3-Q1, the middle 50% of the data
OUTLIERS
Numbers that are much greater or much less than the other numbers in the set
Upper Limit: Q3 + 1.5 x IQR
Lower Limit: Q1 - 1.5 x 1QR