statistics: 6.4 LINEAR REGRESSION IN JASP
1/3
There's no tags or description
Looks like no tags are added yet.
Name | Mastery | Learn | Test | Matching | Spaced | Call with Kai |
|---|
No analytics yet
Send a link to your students to track their progress
4 Terms
how to run a simple linear regression on jasp? 7 pts
is PA/IV a significant predictor of BMI/DV:
open data set in jasp
click on regression
under classical click on linear regression
select BMI then dependent variable
select PA then covariates
under statistics select estimates, confidence intervals, and model fit
see the results on the right side
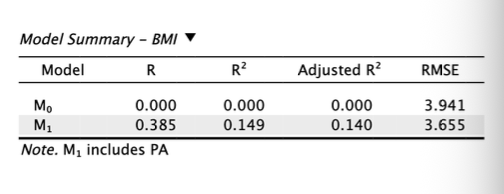
interpreting regression tables: model summary table? 2 pts
(R - H1)- a coefficient that is always positive and tells us about how strong the correlation between both variables is rather than about the direction of the correlation
R2 - H1)- it is the coefficient of determination for regression; regression equivalent of the r2 and tells us the proportion of variance of the dependent variable accounting for the independent variable
interpreting regression tables: ANOVA table? 6 pts
linear model
tests the regression model as a whole and indicates whether the regression model provides a better fit to the data than a model that contains no independent variables
F value- a tool used together with the p-value to answer the questions of whether variance between means of two populations differ significantly
P value- If p < .001 (sifnificant), the independent variable helps predict the dependent variable much better than simply using the average value meaning there is a statistically significant relationship between the independent variable and the dependent variable; If the p-value is not significant, the independent variable does not improve our predictions and prediction could be done using the average value of the dependent variable alone
regression of degrees of freedom (df)- the number of IVs in our regression model; for simple linear regression there is only one
residual degrees of freedom (df)- total number of observations/rows of the data set subtracted by the number of variables being estimated; for simple linear regression the number of variables is 2 (n-2)
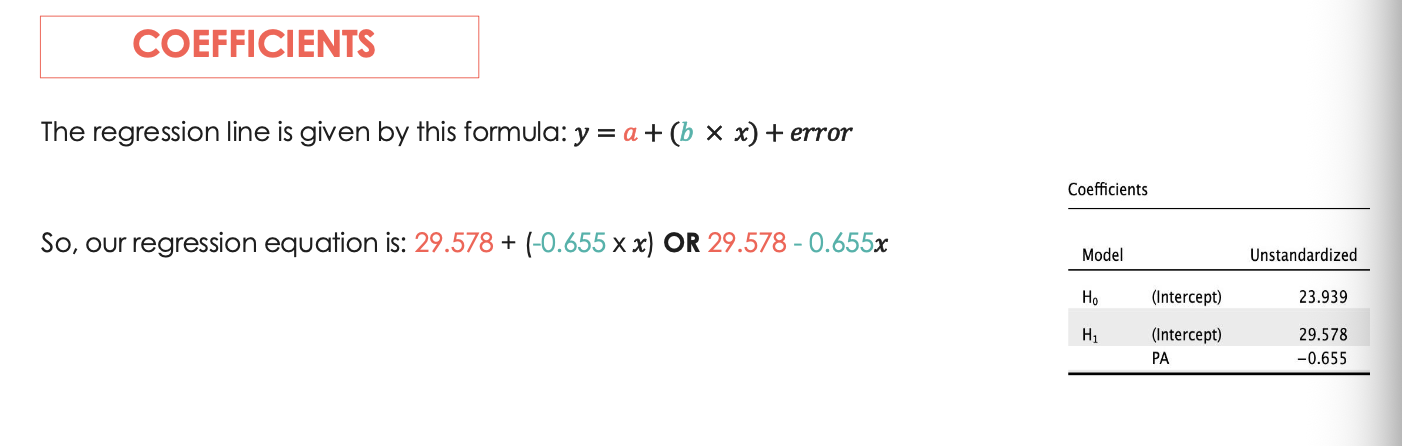
interpreting regression tables: coefficients? 9 pts
tells us how the model works (anova tells us if it works or not)
standardized coefficient- equal the correlation R but can be positive or negative (standardized covariance)
unstandardixed coefficient- values in the original units of measurement
regression line formula- y = a + (b x X) + error
intercept in jasp = unstandardized H1 in the table and is the starting point of the regression line
slope in jasp = unstanrdized vs PA
T and P- if the t-test in the table is not statistically significant (p < .05) then that predictor does not add to your model
if coefficient is positive- then for every one unit increase in the predictor value the outcome variable increases by b points
if coefficient is negative- for every one unit increase in the predictor variable the independent variable decreases by b points