3. Monopolies
1/11
There's no tags or description
Looks like no tags are added yet.
Name | Mastery | Learn | Test | Matching | Spaced | Call with Kai |
|---|
No analytics yet
Send a link to your students to track their progress
12 Terms
Name and define each type of monopoly.
1. Pure: Only 1 firm in industry.
2. Dominant: 40%+ market share.
3. Legal: 25%+ market share.
4. Natural
Give 6 features of a monopoly.
1. Single/ a few sellers.
2. Usually higher prices (price makers)
3. Differentiated products and advertising.
4. High entry + exit barriers.
5. Productively and allocatively inefficient.
6. Dynamically efficient.
Define dynamic efficiency.
The ability to reinvest profit into R&D, innovation, and capital to improve production and quality over time.
What profit is made by monopolies in the short and long run?
Short run: economic profit.
Long run: economic profit.
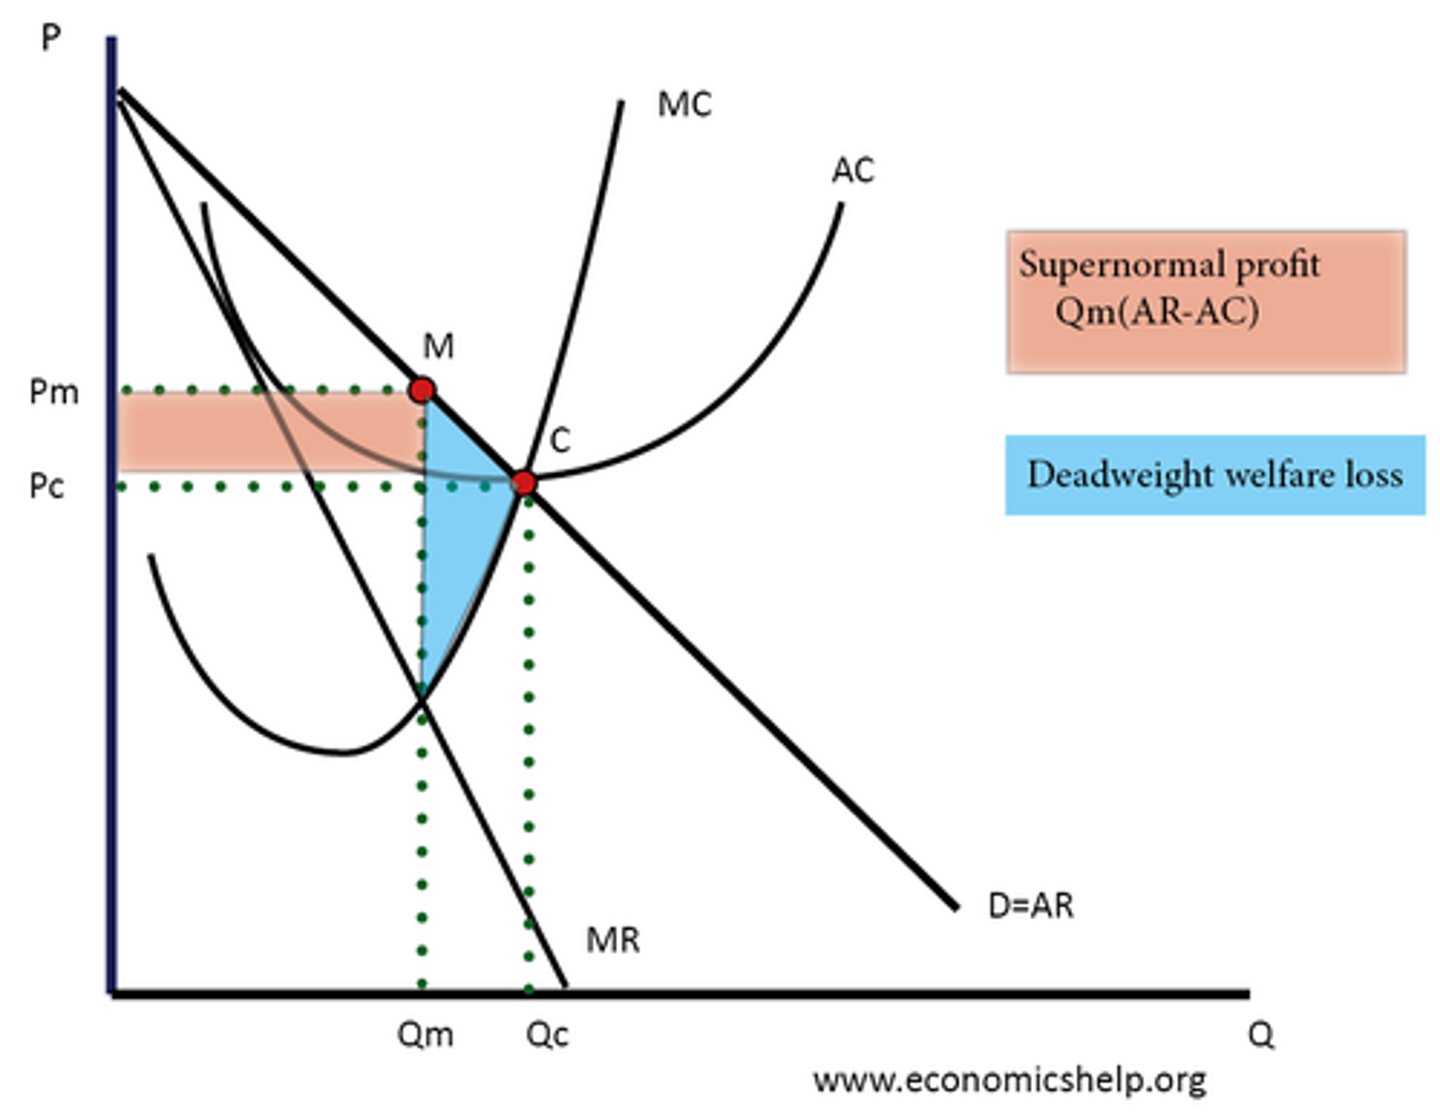
Draw a monopoly diagram.
Box = supernormal profit.
Vertical axis = cost
Horizontal axis = output
Give 4 disadvantages of a monopoly.
1. Little competition: little pressure to innovate.
2. Higher prices
3. Lower quantity supplied
4. Less choice for consumers
Give 4 advantages of a monopoly.
1. Economies of scale.
2. Dynamic efficiency
3. Few large firms may still fiercely compete.
4. Intellectual property rights: protect ideas + encourage new products.
What is a natural monopoly? Give an example.
A market that is most efficient where there is only one firm.
e.g. railway infrastructure.
Give 2 features of a natural monopoly.
- High fixed costs.
- Low marginal costs.
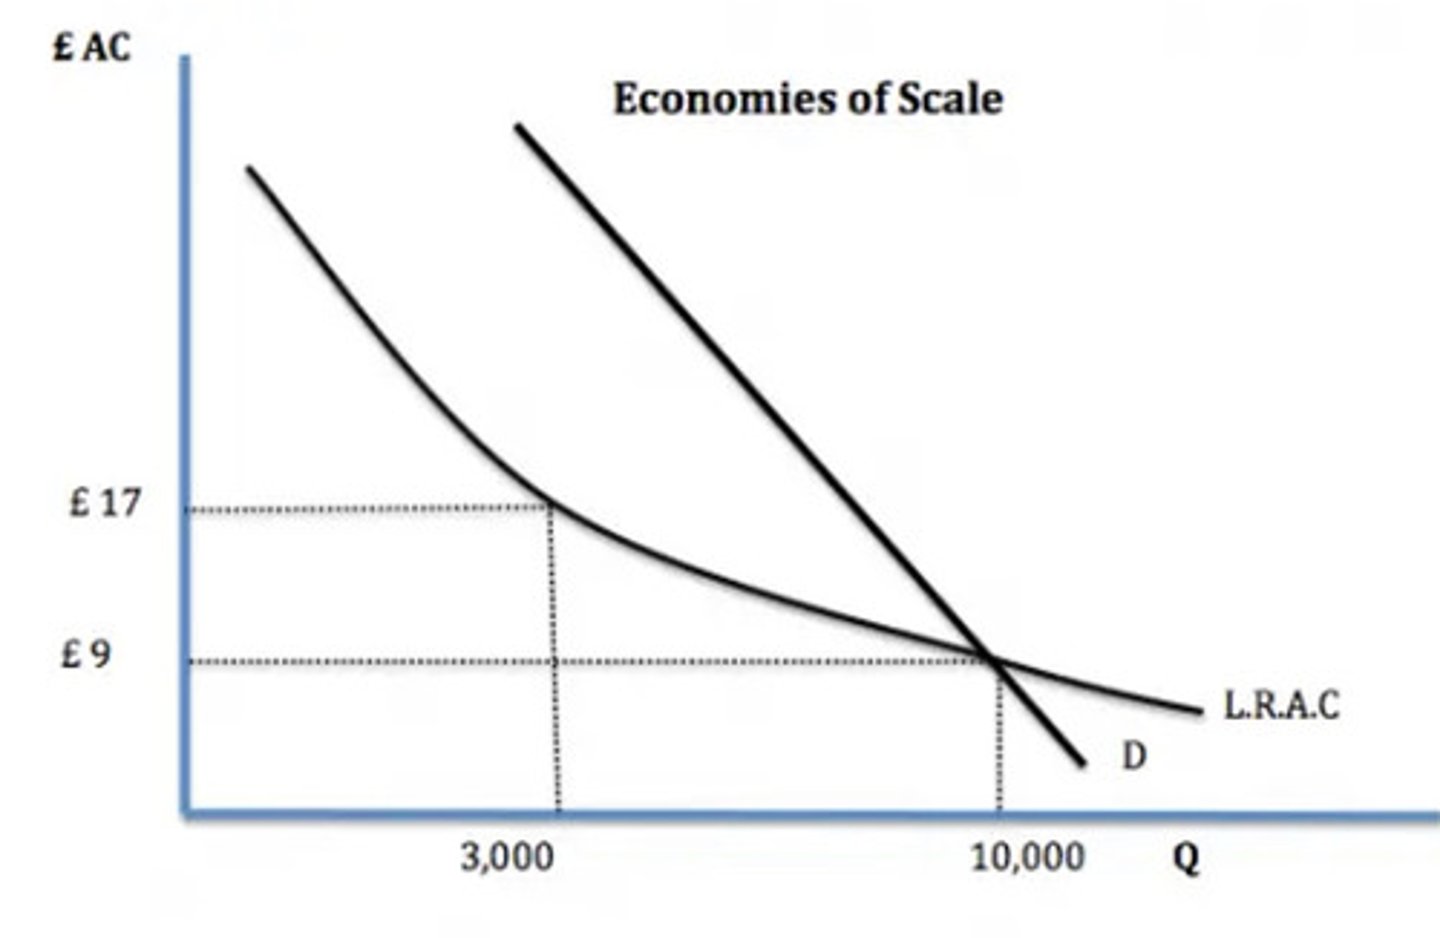
Draw a natural monopoly economies of scale diagram.
demand = 10,000 units.
If a firms produces this, they will get lowest average costs.
If 3 firms produce 3,000 units, they will have £17 average costs.
Optimal number of firms in industry is 1.
Name 7 barriers to entry.
1. Economies of scale.
2. Natural/ geographical barriers.
3. Brand loyalty through advertising.
4. Limit / predatory pricing.
5. Knowledge and expertise.
6. Legals patents for larger companies.
7. Network effects: e.g. using services many other use, like social media.
Name 5 barriers to exit.
1. Costly equipment and facilities: not easy to sell.
2. Redundancy cost to workforce.
3. Penalty fines: e.g. rental agreements.
4. Loss of reputation.
5. Clean up costs: e.g. closing factory, environmental hazards.