A-Level Economics Theme 3 flashcards
1/143
Earn XP
Description and Tags
up to 3.4.3
Name | Mastery | Learn | Test | Matching | Spaced | Call with Kai |
|---|
No analytics yet
Send a link to your students to track their progress
144 Terms
Reasons why firms remain small
owner’s objectives
niche market
high barriers to borrowing
Owner’s objectives (Reasons why firms remain small)
some entrepreneurs prefer a lifestyle business over expansion
Niche market (Reasons why firms remain small)
some markets are limited in size, so firms don’t get much bigger
High barriers to borrowing (Reasons why firms remain small)
banks demand collateral, and without enough assets, a small firm can’t fund big projects
Reasons why firms grow
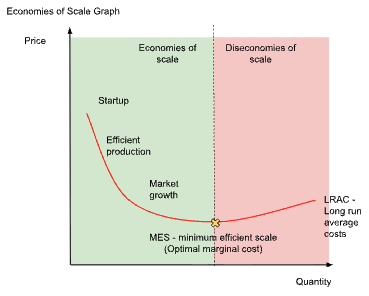
Economies of scale - purchasing more makes it cheaper per unit, where costs fall as output rises, until a certain point
Diseconomies of scale
at the point where costs no longer falls as output rises, costs creep back up
communication breaks down
managers cant keep track of every worker
Economies of scale graph
Principals
shareholders/owners
Agents
Managers and executives that run day-to-day operations
Ownership vs control (principal-agent problem)
Principals want maximum long-term profit, maybe via re-investing in new technology
Agents may prefer big salaries, flashy offices, or safe, low-risk projects that earn them bonuses today.
Principals cannot watch every decisions, agents can drift towards their own interests
Firms spend money on audits, performance-based pay, even detailed board reports to realign agents; incentives with shareholders
Public sector
individuals or groups own and run businesses to earn profits
E.g. Tesco, BP, or local businesses
Public sector
government owned, usually services
E.g. Schools, police, NHS
Public vs private sector problem
Public organisations often aim to provide services that the market might under-supply, funded by taxes rather than customer fees
Profit organisations
measure success by surplus revenue over costs. Profits flow to owners or shareholders
E.g. Apple or a cafe
Non-profit organisations
reinvest any surplus back into their mission (e.g feeding the homeless, funding research or maintaining community facilities)
E.g. charities such as Oxfam, hospices, sports club
Possible resolutions to conflicts and problems
Some public-sector bodies carve out private arms to raise funds (spin-off companies)
E.g. universities setting up spin-off companies
Some private firms set up charitable foundations
E.g. the Lego foundation
Principal-agent tug-of-war never quite disappears no matter how large or small the organisation
Business growth methods
organic growth
Inorganic growth
Organic growth
growth internally (by itself) without mergers or takeovers
Slower, but safer, firm keeps full control and company culture remains the same
E.g. opening new stores, new products, new locations, selling online or increasing production
Inorganic growth
growth externally through integration using mergers and takeovers
Types of integration (types of inorganic growth)
vertical integration
Backward vertical
forward vertical
Horizontal integration
Conglomerate integration
Vertical integration
firm joins with a business at a different stage of the supply chain
Backward vertical integration
moving back towards raw materials or earlier stages
E.g. a coffee shop chain buying a coffee roaster or a coffee farm to secure supply and quality
Forward vertical integration
moving forward towards the customer
E.g. a manufacturer buying a retail chain so it can sell directly to shoppers and control the in-store experience
Horizontal integration
A firm joins with another firm at the same stage of the supply chain in the same industry
The aim is usually to get a bigger market share / pricing power and share costs to benefit from economies of scale.
E.g. two supermarket chains merging, or one fashion brand acquiring another fashion brand.
Conglomerate integration
when a firm joins with a business in a completely different industry
The idea is to spread risk across unrelated markets and have new profit streams
E.g. a media company buying a fitness app, or a food company buying a household cleaning brand
Advantages of organic growth
Lower risk - growth at a manageable pace, using known products and customers
Control and culture - no clash between different companies; staff and systems evolve naturally
Easier to finance - often funded by retained profit rather than big loans
Disadvantages of organic growth
Slow - may miss opportunities if rivals are expanding faster
Limited by resources - you only grow as fast as your cash, people and capacity allow
Narrow focus - less chance to diversify quickly into new areas
Advantages of vertical integration
Control of supply or distribution - improves reliability, quality and delivery times (backward integration), improves shelf space, branding and customer data (forward integration
Cost savings - potential economies of scale and reduced margins paid to middlemen
Competitive edge - rivals may find it harder to access the same suppliers (backward integration) or retail outlets (forward integration)
Disadvantages of vertical integration
Culture and coordination - running very different parts of the chain is complex
Capital intensive - it can be expensive to buy suppliers or retailers
Less flexibility - tied to your own supply/retail network even if market conditions change
Advantages of horizontal integration
Integration problems - culture clashes, duplicated roles, IT systems that are not compatible
Diseconomies of scale - the organisation can become slow and bureaucratic
Regulatory risk - competition authorities may investigate or block deals if the combined firm would be too powerful
Advantages of conglomerate integration
Risk spreading - if one industry is in recession, another industry may be booming.
New profit streams - access to new customers and ideas
Internal capital market - cash from one division can fund growth in another
Disadvantages of conglomerate integration
Lack of expertise - managing unrelated businesses is difficult
Weak synergies - fewer cost savings because the businesses may not share many costs
Management distractions - leaders spend time juggling very different markets
Constraints on business growth
size of market
access to finance
regulation
owner’s objectives
Size of market (constraint on business growth)
in a niche market there may not be enough customers to support big expansion.
If overall industry demand is flat or falling, growth is tougher without stealing share from competitors
E.g. a vegan fine dining restaurant in a small town may not be able to open ten branches if demand isn’t there
Access to finance (constraints on business growth)
growth needs money to build factories, open stores and buy rivals. Smaller firms may find bank loans expensive or hard to get.
start ups might rely on retained profits, which limits the pace of growth
Even big firms face higher risk and interest costs when debt rises
Regulation (constraints on business growth)
competition authorities can block or attach conditions to mergers if they reduce consumer choice or harm competition.
Planning permission can slow store opening
Industry rules and licenses can make expansion costly and slow (e.g. in finance, health, food)
Environmental rule may add extra steps for new plants or logistics hubs
Owner’s objectives (constraints on business growth)
not every owner wants to build an empire, some run lifestyle businesses that prioritises work-life balance, quality or independence over size.
Family owners may fear losing control if they sell shares or merge
Objectives like staying local, staying ethical or keeping staff jobs can limit aggressive expansion
Demerger
one company splitting into two or more separate companies so each part can focus on what it does best
Each with its own management and accounts
Where before is BigCo: A + B + C split to A ltd, B ltd and C ltd
Demerger methods
Sell-off
Spin-off
Split-up
Sell-off (demerger)
when a division is sold to another owner
Spin-off (demerger)
when a division becomes a new company, and the original shareholders get shares of both companies
Split up (demerger)
a large group breaks into several independents and the parent company disappears
Reasons for demergers
Focus
Efficiency
Unlocking value
Regulation and strategy
Focus (reasons for demergers)
separating each firm can set clear goals and move faster
conglomerates often try to run very different activities under one roof, causing managers to spend time juggling priorities and the best ideas can get stuck.
E.g. Ebay and Paypal in 2015, where the online marketplace and the payments business grew better when run independently
Efficiency (reason for demergers)
Shrinking to a right sized business can cut average costs (LRAC) and improve productivity
very large firms can suffer from diseconomies of scale due to more layers of management, slower decisions and waste
Long run average cost curve (LRAC) as a wide ‘U’.
If BigCo had grown past the bottom of the LRAC curve ‘U’, demergers can move each new company back toward the bottom (MES - minimum efficient scale) of the LRAC curve where unit costs are lowest
Unlocking values (reasons for demergers)
After a demerger the market can value each company more clearly.
Investors sometimes give a conglomerate discount to a mixed business because it is hard to see what each part is really worth
Everyday brands businesses could be valued on their own growth and risk while the remaining larger group focused on R&D
E.g. GSK spinning off Haleon (consumer health) and Johnson and Johnson spinning off Kenvue
Regulation and strategy (reasons for demergers)
Sometimes a board demerges to reduce risk, raise cash from a sale or because different parts need different investment styles and cultures
Competition authorities can require divestment if market power looks too strong after a merger.
E.g. a mature cash-cow brand versus a high-risk R&D division
Impact of demergers on businesses
the short term effect is usually disruption and cost, but long term benefit if done correctly
Separating IT systems, renegotiating contracts, duplicating support functions, rebranding and listing fees all costs money
Temporary loss of economies of scale in purchasing, marketing or production
Long-term effects can be positive as each company gets a simpler structure, clearer accountability, tailored incentives for managers investment that fits strategy
If the demerger raises rivalry in the market, it can force both firms to become leaner and more innovative
Financially there are often sharper performance measures and sometimes a stronger share price for the parts than for the old whole business.
But it is not guaranteed, if the separated firms end up too small to spread fixed costs, average costs can rise and profits can fall
Impact of demergers on workers
Mixed picture
Clearer missions, faster decisions and career paths within a focused business
Employees who felt lost in the machine/operation may find it easier to have impact
uncertainty and possible job losses especially where support roles are duplicated across the new companies or where a division is sold to an owner who restructures
Pay, benefits and workplace culture can change
Locations may change too if head office functions move
Impact of demergers on consumers
Depends on how market structure changes
Demergers create more effective competition or frees a consumer-facing brand to focus on service, prices can fall, quality can rise and new products appear faster
E.g. When paypal separated, its focus on payments innovation accelerated, which is good for users
Split raises costs as economies of scale are lost, hence those higher costs may pass onto the prices
Service can also dip during the transition period while systems and teams are rebuilt.
Over time the main test is efficiency and rivalry: more rivalry and better fitted firms usually benefit consumers, less scale with no efficiency gains does not
Total revenue (TR)
total income generated by the business through sales
Total revenue = price x quantity
TR = PxQ
On a normal downward-sloping demand curve TR rises at first as you sell more, then reaches a peak when MR=0, then falls if you keep cutting price beyond that - this effect is known as diminishing marginal productivity or rising cost of marginal productivity
Average revenue (AR)
the total revenue divided by quantity, or the price
The demand curve on a normal downward-sloping demand curve
AR = TR / Q
Is the same as price
Marginal revenue (MR)
the extra revenue from selling one more unit.
MR = ∆TR/∆Q
Lies below AR and crosses zero halfway to the AR intercept if demand is linear on a normal downward-sloping demand curve
Total cost (TC)
everything spent to make the output
Average cost (AC)
average cost of making a unit to the business
AC =TC / Q
Marginal cost (MC)
the extra cost of one more unit
MC = ∆TC / ∆Q
MC = ∆TVC / ∆Q, As fixed costs do not change.
Intersects both AVC and ATC at their minimum points
Profit
total revenue subtract total cost
Profit = TR-TC
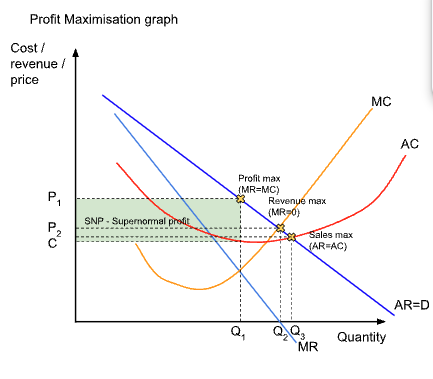
Profit maximisation graph
Key rule - produce where where MR = MC as it is the profit maximisation
If they extra revenue from the next unit is bigger than the extra cost (when MR<MC), keep going, if it is smaller (when MR>MC), you've gone too far and stop producing
Use the profit max point to see the quantity and price by going up to the AR curve
Revenue maximisation on graph
Revenue maximisation - where MR = 0
On AR-MR diagram, revenue maximisation is the quantity where the MR hits the x-axis
Real life example: early-stage platform or streaming services often chase top-line revenue to gain market share, attract investors and negotiate better supplier terms
Sales maximisation on graph
Sales max - where AR=AC
Known as the normal profit, or breakeven point in business studies.
Aim here is to sell as many units as possible, subject to at least ‘normal profit’ covering opportunity costs.
At AR=AC price just covers average cost, no abnormal profit, but output is as large as possible without making a loss
Firms use this to build market share, exploit economies of scale, lock in customers, deter new entrants, or hit internal targets tied to volume.
Real life example: Budget airlines pushing very low fares while still covering average costs, or supermarkets running aggressive price wars to win footfallSa
satisficing
good enough outcomes that keep key stakeholders happy
Form of irrational economics behaviour compared to traditional economics
Not very firm chases mathematical optimum
E.g. a family run shop that keeps prices fair and hours manageable rather than squeezing every last pound of profit; a not-for-profit focusing on service quality; a regulated utility keeping customers and regulators satisfied rather than pushing output to the theoretical optimum
Reasons for satisficing
Conflicting objectives - owners want profit, managers want staff wellbeing or growth
Limited information
Risk avoidance
Wanting better work life balance
Reason for MR being below AR
Price cut on all previous units - the average price being brought down due to a new lower price as the business trying to sell more units, where they choose to cut prices for everyone, with the extra units brought in are at lower price, leading to the average being significantly lower, and the marginal being even lower.
This is the reason for MR falling faster than price and sits below AR when demand slopes down
Exception: In perfect competition, with perfect elasticity of demand, AR=MR=price, as the firm is a price taker with a flat demand at market price, hence selling one more unit doesn’t require cutting price on previous units, so MR=price
PED and revenue
PED - measures responsiveness of quantity to a price change
PED = %∆Q/%∆P (will be negative for a normal downward-sloping demand curve, and usually talks about the magnitude of PED)
PED>1 - When demand is elastic - a price cut increases total revenue and a price rise reduces total revenue
PED<1 - when demand is inelastic - a price cut reduces total revenue and a price rise increases total revenue
PED=1 - When demand is unit elastic - total revenue is maximised and doesn't change with small price tweaks.
At this point MR = 0
Costs
the monetary value of inputs, expenses or resources (such as time and effort) required to produce goods, deliver services or achieve a specific aim.
often classified into fixed and variable costs.
Fixed costs
bills that do not change with output in the short-run.
E.g. rent, business rates, basic insurance, the lease on a pizza oven
Variable costs
costs that rise as you make more
E.g. ingredients, packaging, hourly staff
Total costs
variable and fixed costs added together for any level of output
Total fixed costs (TFC)
total of all fixed bills in a period, doesn’t change when output changes
Total variable costs (TVC)
costs spent on things that rise with output
Total costs (TC)
variable and fixed costs added together for any level of output, or everything you spend
TC = TFC + TVC
Average total costs (ATC)
cost per unit on average
ATC = TC / Q
Average fixed costs (AFC)
fixed cost spread over each unit.
AFC always falls as Q rises
Never hits zero, but gets very small
AFC = TFC / Q
Average variable costs (AVC)
variable cost per unit on average
AVC = TVC /Q
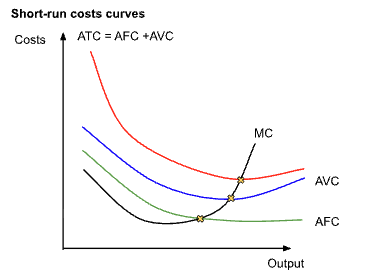
Reasons for short-run cost curves being U-shaped
Diminishing marginal productivity
At least one input is fixed in the short run
If input variables are being added to the fixed input, initially the firm gets more efficient by better coordination, specialization, so the MC can fall.
But there is diminishing marginal utility, so every extra variable costs adds less output, hence the extra cost of the next unit rises.
The ‘fall, then rise’ pattern in MC drags AVC and ATC down and then up, giving the U-shape curves
Short run cost curve details
AFC - falls steeply first then gently
AVC and ATC - U-shaped
ATC - sits above AVC because it includes AFC as well and is U-shaped
MC - cuts the lowest point of AVC and ATC
When MC is below an average, it pulls the average down, when MC is above, it pulls and average up
Short-run vs long-run costs (LRAC and SRAC)
long-run - all inputs are variable, can choose the best plant size for any output level
Each possible plant-size has its own short-run average cost curve (SRAC)
Long run average costs (LRAC) is the smooth envelope that touches the lowest point you could achieve across the SRACs
Inputs
resources use to produce output
E.g.
Machinery
Labour
Factory space
Land
Technology
In the short run, at least one of these is fixed
Examples of short-run inputs
A bakery currently has 1 oven, 5 workers and 1 shop unit
In the short run it can
hire 2 more workers
Buy more flour
Stay open longer
but it cannot quickly add a second industrial oven or move to a larger unit
In the long run it can
move to to a bigger bakery
Install more ovens
Reorganise production completely
So in the long run it can choose the most the most efficient scale for whatever level of output it wants
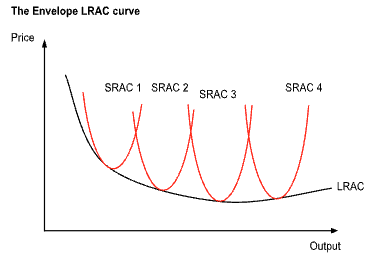
Envelope LRAC curve
Every U shaped SRAC curve. The LRAC is the lower boundary that touches each SRAC at the cheapest output for that scale. As output expands, LRAC typically falls at first, economies of scale, better machinery, spreading management and R&D.
Flattens - constant returns to scale
May rise eventually - diseconomies of scale
Lowest point is the minimum efficient scale (MES) and the lowest average cost a a firm can achieve with the best available technology
LRAC is derived by tracking the changes in average cost that result from increase in the scale of a firm’s operation
E.g. adding new plants results in lower short run cost structures until eventually short run costs being to rise again
In the short run at least one factor of production (usually capital) is fixed. Each SRAC curve represents a different plant size or level of fixed investments. As a firm grows it moves from a smaller plant (SRAC 1) to a larger one (SRAC 2)
In the long run all factors of production are variable, hence the lRAC is derived by taking the lowest possible average cost for any given level of output and it is the boundary of the firm’s production possibilities
Long run marginal cost (LRMC)
crosses the LRAC at the minimum, mirroring the short-run MC/ATC relationship
Minimum efficient scale level (MES)
the smallest output at which the firm operates at or very close to the bottom of LRAC, beyond this, you’re as efficient as you need to be for that technology/industry.
Economies of scale
average cost per unit falling because costs are spread or better methods are used when a firm grows and produces more.
Types of economies of scale
technical economies
managerial economies
purchasing (bulk-buying) economies
marketing economies
financial economies
risk-bearing economies
learning/experience curve economies
network economies
Technical economies (economies of scale)
bigger plants can use more efficient equipment
E.g. a large bakery uses industrial ovens that bake thousands of loaves at once; the electricity and labour per loaf fall compared with a tiny bakery
Managerial economies (economies of scale)
large businesses can afford experts in management, allowing specialisation in management
E.g. a large supermarket chain can afford expert logistics managers, buyers and data analysts, each improving their area. A corner shop owner does everything and is less efficient
Purchasing (bulk-buying) economies (economies of scale)
buying inputs in larger quantities often earns a lower price
E.g. Costco vs a small independent retailer
Marketing economies (economies of scale)
spreading fixed marketing costs over more units.
E.g. a nationwide TV advert costs the same whether you sell 100,000 or 1,000,000 units; the cost per unit falls as sales rise
Financial economies (economies of scale)
big firms often borrow at lower interest rates, as lenders see them as safer, reducing finance cost per unit
Risk-bearing economies (economies of scale)
diversified firms can spread risks across products and markets, making it cheaper to undertake big projects.
learning / experience curve economies (economies of scale)
as workers repeat tsks, they get quicker and waste less,
E.g. a new smartphone assembly line gets faster month by month
Network economies (economies of scale)
platforms like ride-hailing or social media become more valuable as more users join, pulling average cost of matching and service delivery down
Types of diseconomies of scale
coordination and control problems
communication problems
worker motivation and distance
bureaucracy and compliance
input cost pressures
coordination and control problems (diseconomies of scale)
more layers of management, causing slow decisions, different departments duplicating works and projects overrun.
Communication problems (diseconomies of scale)
messages get diluted or delayed and front-line staff don’t get the information they need on time
Worker motivation and ‘distance’ (diseconomies of scale)
workers feel like a small part, effort and care drop, wastage and errors rise
Bureaucracy and compliance (diseconomies of scale)
big organisations spend more time on forms, approvals and meetings; adding to the overheads.
Input cost pressures (diseconomies of scale)
very large firms may push up their own labour or sit costs (e.g. having ot pay premium wages to attract scarce specialists or renting expensive city-centre offices), nudging average costs up
If MES is small relative to total market demand
many firms can reach it the MES output
E.g. Craft beer: where MES is low, a micro-brewery can be efficient at small scale using a modest kit
If MES is large relative to total market demand
only a few firms can hit the MES output
E.g. oil refineries, commercial aircraft, national rail networks, where there are high fixed costs, big plants and a few large firms.