Intro to Macroeconomics
1/50
There's no tags or description
Looks like no tags are added yet.
Name | Mastery | Learn | Test | Matching | Spaced | Call with Kai |
|---|
No analytics yet
Send a link to your students to track their progress
51 Terms
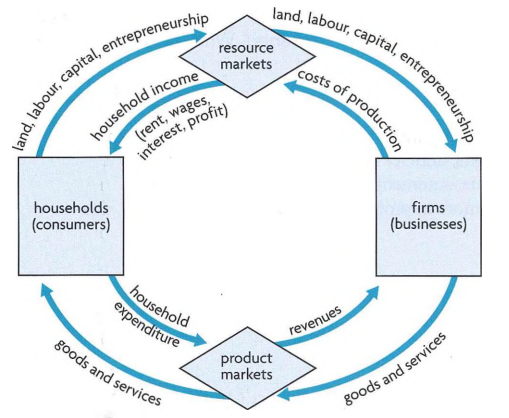
Circular flow of income model (diagram + what it shows in words)
Shows that in any given time period, the value of output produced in the economy is equal to the total income generated in producing that output, which is equal to the expenditures made to purchase that output
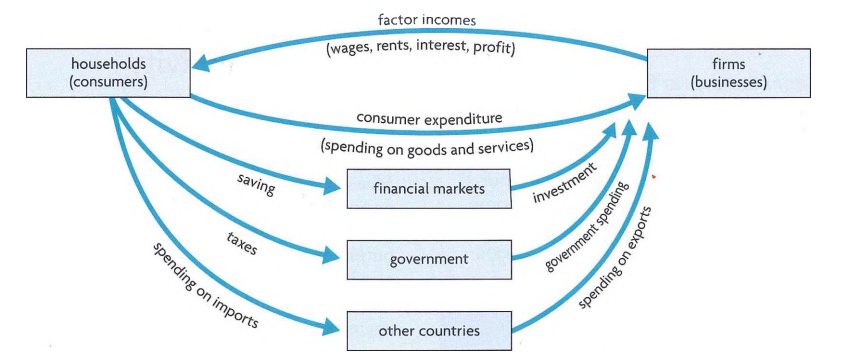
Leakages and injections in the circular flow of income model (briefly explain each pair)
Savings deposited in banks - firms take loans from banks
Taxes paid to govt come back as govt spending in various activities (healthcare, defense, education)
Imports means not spent in domestic economy - exports mean spending from abroad into domestic economy
Uses of measuring national output
assess an economy’s performance over time
make comparisons between countries
establish a basis for making policies that will meet economic objectives
The output method
Measures economic growth by calculating the total value of goods and services produced in a country during a specific time period
The expenditure method
Value of all spending by households on final goods and services (spending on raw materials not included)
C + I + G + X - M
Explain each component of expenditure method
C - all purchases by households on final goods and services in a year
I - spending by firms on capital goods
G - government spending on providing goods and services
X-M - value of all exports minus value of all imports
Income method
Measures national income by adding up the value of all income received by households in return for land, labor, capital, and enterprise (wages, rent, interest, profits)
(Transfer payments like welfare benefits, gifts, second-hand goods NOT counted)
GDP Definition
Gross domestic product (GDP) is defined as the total nominal market value of all final goods and services produced by firms and organizations in a country over a time period (usually a year). It includes spending by the four components, C + I + G + (X-M)
GNI (Gross National Income)
GNI is the total income received by the residents of a country, equal to the value of all final goods and services produced by the factors of production supplied by the country's residents regardless where the factors are located.
Advantages of using ‘per capita’ measurements
Accounts for population differences across countries
Accounts for population growth
Real GDP
Measure of the total value of economic nominal national output adjusted for prices changes (inflation or deflation)
GDP Deflator
Measure of the general level of inflation in the economy, showing the extent to which prices have changed over time
Price Index
Measure of the average prices in one year relative to average prices in a base year
GDP PPP
Method used to compare economic productivity and living standards between countries by accounting for differences in price levels. (using exchange rates)
GNI Formula
GNI = GDP + net income from abroad
Business cycles
Business cycles consist of short-term fluctuations in the growth of real output, which are alternating periods of expansion (increasing real output) and contraction (decreasing real output).
Expansion / Recovery
When positive growth in real GDP (slope is positive)
- Increasing real output
- Declining unemployment rate
- Inflation
Peak
Marks end of expansion (max real GDP for the cycle)
- High real output level
- Low unemployment
- Inflation (rapid rise in general price level)
Contraction
When economy starts experiencing fall in real GDP (slope is negative)
If lasts for 2 consecutive quarters, it is characterized as a recession.
- Decreasing real output
- Rising unemployment rate
- Inflation fades; if prolonged, deflation can occur
Trough
Reprents cycle’s minimum GDP, or end of contraction
- Output and employment levels ‘bottom out’
Long-term growth trend
Shows how output grows over time when cyclical fluctuations are ironed out
Output showed by this trend is known as potential output / potential GDP
Why is full unemployment/natural rate of unemployment not when everyone in the country is employed?
Some become may be between jobs, moving from one geographical area to another, training to get better job, e.t.c
Link between long-term growth trend and natural rate of unemployment (above vs below on business cycle?)
Trend shows level of output when there is ‘full employment’ — unemployment is equal to natural rate of unemployment
Above potential GDP = unemployment lower than natural rate
Below potential GDP = unemployment higher than natural rate
Natural rate of unemployment
Unemployment that occurs when the economy is producing at its potential or full employment level of output (real GDP), and is equal to the sum of structural, frictional plus seasonal unemployment
Potential GDP
The level of output (real GDP) that can be produced when there is ‘full employment’,meaning that unemployment is equal to the natural rate of unemploymet
Reasons to study the business cycle
Reduce the intensity of contractions and expansions (reduces impact of rising price levels in expansions and unemployment in contractions)
Increase steepness of long term growth trend
Economic slowdown
When economy/GDP is still growing but at a slower rate than before
Green GDP
GDP that accounts for the value of resources and environmental destruction
Green GDP = GDP - environmental degradation - P
P stands for expenditure for cleaning pollution, avoiding further environmental damage and healthcare costs of pollution-induced diseases)
Reasons why GDP/GNI do not measure the ‘true’ value of output [6 - NUQNDD)
Do not include non-marketed output (some output of goods and services is not sold in the market and does not generate any income)
GDP/GNI do not include output sold in underground/parallel markets
Do not account for quality improvements in goods and services (e.g: technological improvements can make products sold in lower prices so lower GDP despite same output)
Do not account for negative externalities; undesirable byproducts of production
Do not account for the depletion of natural resources
Differing domestic price levels (can be resolved by using GDP PPP)
Reasons GDP/GNI cannot accurately measure economic well-being
Do not make distinctions between compositions of output (some goods/services contribute more to standards of living that others)
Do not reflect achievements in levels of education, health, and life expectancy
No information of distribution of income
Do not represent working hours / leisure time
Do not account for quality of life factors (e.g: crime rate, political freedom)
OECD Better Life Index
Measures standards of living based on a number of factors the member countries themselves have selected as factors that make a better life
Happniess Index
Alternative to national income as a measure of well-being as it considers how technology, governance and social norms influence communities and their level of well-being
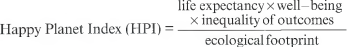
Happy Planet Index
Shows the ecological efficiency with which human well-being is delivered around the world. Tells us how well nations are doing at achieving long, happy, and sustainable lives.
inequality of outcomes - inequalities between people with regard to life expectancy and well-being
Aggregate Demand
The total amount of real output (real GDP) that consumers, firms, the government, and foreigners want to buy at each possible price level, over a particular time period.
AD = C + I + G + (X-M)
Effect of AD shifts explanation
Rightward shift = increae in aggregate demand = for any price level, a larger amount of real GDP is demanded (vice versa)
Causes of changes in C (consumer expenditure)
Consumer confidence (of future economic situation, determining whether they spend or save AND future price levels)
Interest rates (if low, borrow and spend more now)
Wealth (value of assets people own; makes people feel wealthier and so spend more)
Income tax level
Household indebtedness
Age and structure of population (old = less spending)
Distrubution of income (low-income spend more improving lifestyle compared to high-income that may invest or save instead)
Causes of changes in investment (I)
Business confidence (about future sales and activity)
Interest rates (borrowing)
Improvements in technology (investment to adapt it)
Corporation tax
Levels of RDI (real disposable income — determines whehter households can invest)
Corporate indebtedness
Legal/institutional changes
Government spending
Spending undertaken by the government as part of its fiscal policy or as part of an effort to meet particular economic or social objectives
Causes for changes in government spending (G)
Changes in political priorities (choice to decrease provision of subsidies/merit goods; e.g. desire to please electorate)
Change in economic priorities (deliberate efforts to infleunce aggregate demand)
Threats of war/terrorist attacks/ rises in crime
Causes for changes in net exports (X-M)
RDI abroad
RDI in the domestic country
Exchange rate
Level of trade protection
Aggregate supply
The total output of goods and services that producers in an economy are willing and able to supply at different price levels in a given time period
Short-run aggregate supply (SRAS)
The total output of goods and services (real output or real GDP) produced in an economy in the short run (when wages and other resource prices are held constant), ceteris paribus.
Effect of SRAS shift explanation
Rightward shift means short-run aggregate supply increases; for any particular price level, firms produce a larger quantity of real GDP (vice versa)
Factors shifting SRAS curve
Wages (drop means cost of production drop so SRAS shifts right)
Non-labor resource prices (oil, equipment, land inputs, etc)
Indirect taxes (treated by firms as costs of production)
Subsidies
Shock factors (like weather)
Macroeconomic equilibrium
Where aggregate demand and aggregate supply are equal
Long-run aggregate supply (LRAS)
The total quantity of goods and services (real output or real GDP) produced in an economy in the long run (when wages and other resource prices change to reflect changes in the price level), ceteris paribus.
Represents potential ouput / full employment
Long-run equilibrium (or short-run full employment equilibrium)
When AD and SRAS intersect at a point on the LRAS curve
Recessionary (deflationary) gap
When equilibrium real GDP is less than potential GDP (unemployment is greater than natural rate) — not enough demand in the economy for to make it worthwhile for firms to produce at potential GDP
Inflationary gap
When equilibrium real GDP is greater than the potential GDP (unemployment is less than natural rate) — too much demand in the economy
Reasons why the AD curve slopes from left to right
The wealth effect (fall in price level increases amount of goods and services wealth can buy)
Interest rates effect (rise in price levels mean interest rates rise, leading to less consumption and AD)
International trade effect (rise in price level → products less competitive → imports are bought by domestic consumers → contraction)
Monetary policy
Action carried out by the central bank, aiming to change interest rates and control money supply in order to influence aggregate demand; it is a type of demand-side policy, or demand management.