Classification and evolution
1/31
There's no tags or description
Looks like no tags are added yet.
Name | Mastery | Learn | Test | Matching | Spaced | Call with Kai |
|---|
No analytics yet
Send a link to your students to track their progress
32 Terms
Classification
Placing organisms based off similarities
Species
Capable of breeding to produce fertile offspring
Common ancestry
Similar genes
Similar morphology
Similar biochemistry
Similar behaviour
Not fixed, can evolve, have variety across species
Taxonomy
Study of classification
Based off physical similarities
Taxa = level within taxonomy, higher taxa means less similar
Binomial naming
Universal language
Shows evolutionary relationship of species at Genus level
May be different common name for same species in different areas of the world
5 Kingdoms
Animalia
Plantae
Fungi
Protoctista
Prokaryote
Animalia
Eukaryotic
Multicellular
Motile
Heterotrophic
No cell wall
Plantae
Eukaryotic
Multicellular
Autotrophic
Cellulose cell walls
Chloroplasts with chlorophyll
Fungi
Eukaryotic
Multi or unicellular
Saprotrophic
Digest extracellularly, secreting digestive enzymes
Chitin cell walls
Made of hyphae filaments for enzyme secretion and nutrient absorption
Produce spores
Protoctista
Eukaryotic
Mainly unicellular
Auto or heterotrophic
No cell wall
Wide variety
Prokaryotic
Across 2 domains
Unicellular
Small
Autotrophic
No nucleus- loops of DNA
Peptidoglycan cell walls
No membrane bound organelles
Biochemical methods of classification
Cytochrome C- sequence of amino acid chain
DNA- sequence of nitrogenous bases
Convergent evolution
2 species adapting to the same environment but are not related at all
3 Domains
Bacteria
Archea
Eukarya
Scientific knowledge and technology improves so we find out more
Determined by rRNA and way protein synthesis occurs
All eukaryotes in same domain but different kingdoms
Prokaryotes can be in archea or bacteria
Evidence for domains
domains group all eukaryotes in eukarya domain- multiple similarities:
Nuclei
Membrane bound organelles
Linear DNA with histones
Large ribosomes ( 80s )
Darwin and Wallace
Independent work, same conclusion
Darwin Wallace theory
Observations- DW
Organisms often overproduce
Population numbers remain fairly similar
No 2 individuals are similar
Offspring look similar to parents
Deductions- DW
Must be competition
Some with better adaptations survive and reproduce
Organisms pass characteristics to offspring
Fossil evidence
Many are extinct organisms
Show change over time
Carbon dating
Can extract DNA from some
Older rocks, older fossils ( more different )
Small number of organisms fossilised and many are incomplete
Molecular evidence
Indicates presence of common ancestor
Similar species use similar molecules
Inter-specific variation
Differences between different species
Intra-specific variation
Differences within the same species
Causes of variation
Alleles- different versions of a gene which code for specific protein
Sexual reproduction ( meiosis ):
Prophase I - crossing over
Metaphase I - independent assortment
Metaphase II - independent assortment
Random fusion of gametes
New allele occasionally by mutation
Environmental variation
Differences not caused by DNA, cannot be inherited
Discontinuous variation
No environmental impacts
Only genetic effects
Qualitative
Discrete values
On a bar chart
Single or a few genes
Variation with no in-betweens
Continuous variation
Variation on a continuum
No defined categories
Quantitative
Many genes, environmental
Alleles have additive effect
Line graph or histogram
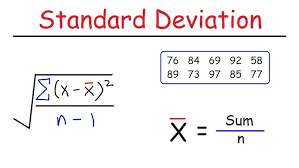
Standard deviation
Spread of data from the mean
More useful than a range of results, considers every piece of data
Small standard deviation, close to mean, little spread in data
s = standard deviation
x = individual value
lined x = mean
N = number of data points
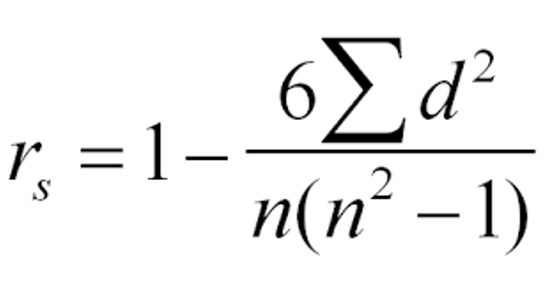
Spearman’s rank
provides a value to determine the strength of the relationship between the variables
To see if there is correlation between two variables
Any data from smallest to largest
Measures whether data are in same order
Not valid if there are a lot of ties
Requires a null hypothesis
rs = rank coefficient
d = difference between the ranks
n = number of pairs of values
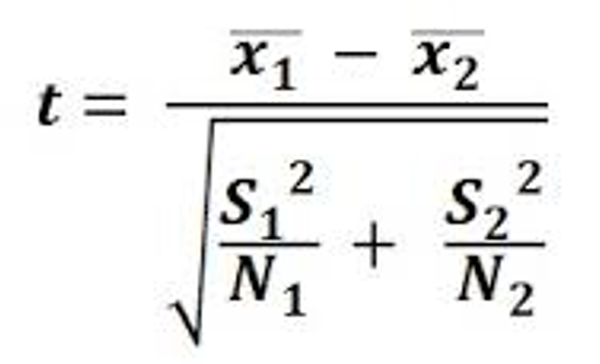
Student T-test
Compares two means to test whether there is a significant difference
Null hypothesis required, saying no difference
Degrees of freedom
Lined x = means
S²- standard deviations of first set of data squared
N- number of data points
Anatomical adaptation
Structural features
Physiological adaptation
An organisms processes
Behavioural adaptation
How an organism acts
Natural selection process
Random mutation
Genetic variation
Selection pressure
Survive and reproduce- selective advantage
Pass on mutation/allele
Allele frequency increases