ecology exam 3
1/146
There's no tags or description
Looks like no tags are added yet.
Name | Mastery | Learn | Test | Matching | Spaced | Call with Kai |
|---|
No analytics yet
Send a link to your students to track their progress
147 Terms
community
an association of interacting species living in a particular area; also defined as all the organisms living in a particular area
consist of many species, all interacting
•Competition
•Exploitative interactions (e.g., predation, parasitism)
•Mutualism
Etc.
community ecology
: study of how various biotic and abiotic aspects of the environment influence the structure of communities
community structure
includes attributes such as the number of species, the relative abundance of species, and the kinds of species comprising a community
because the study of complete community is extremely difficult, we often use?
subsets of the community
•Taxonomic and/or functional: e.g., plants, mammals, insects
•E.g., Plant Life-form/growth-form
•Combination of structure and growth dynamics (e.g., tree, vine)
Guild
: a group of species, without regard for taxonomic position, that exploit the same class of environmental resource in a similar way
Ant-eating
species
Taxon
A group of phylogenetically related species
Birds
assemblage
phylogenetically related groups within a community
BirdsoftheAmazon
geography and phylogeny
local guild
species that share a common resource and occur in the same community
Ant-eating species of the Amazon
geography and resources
ensembles
phylogenetically bounded groups of species that use a similar set of resources within a community
Ant-eating birds of the Amazon
geography, resources, phylogeny.
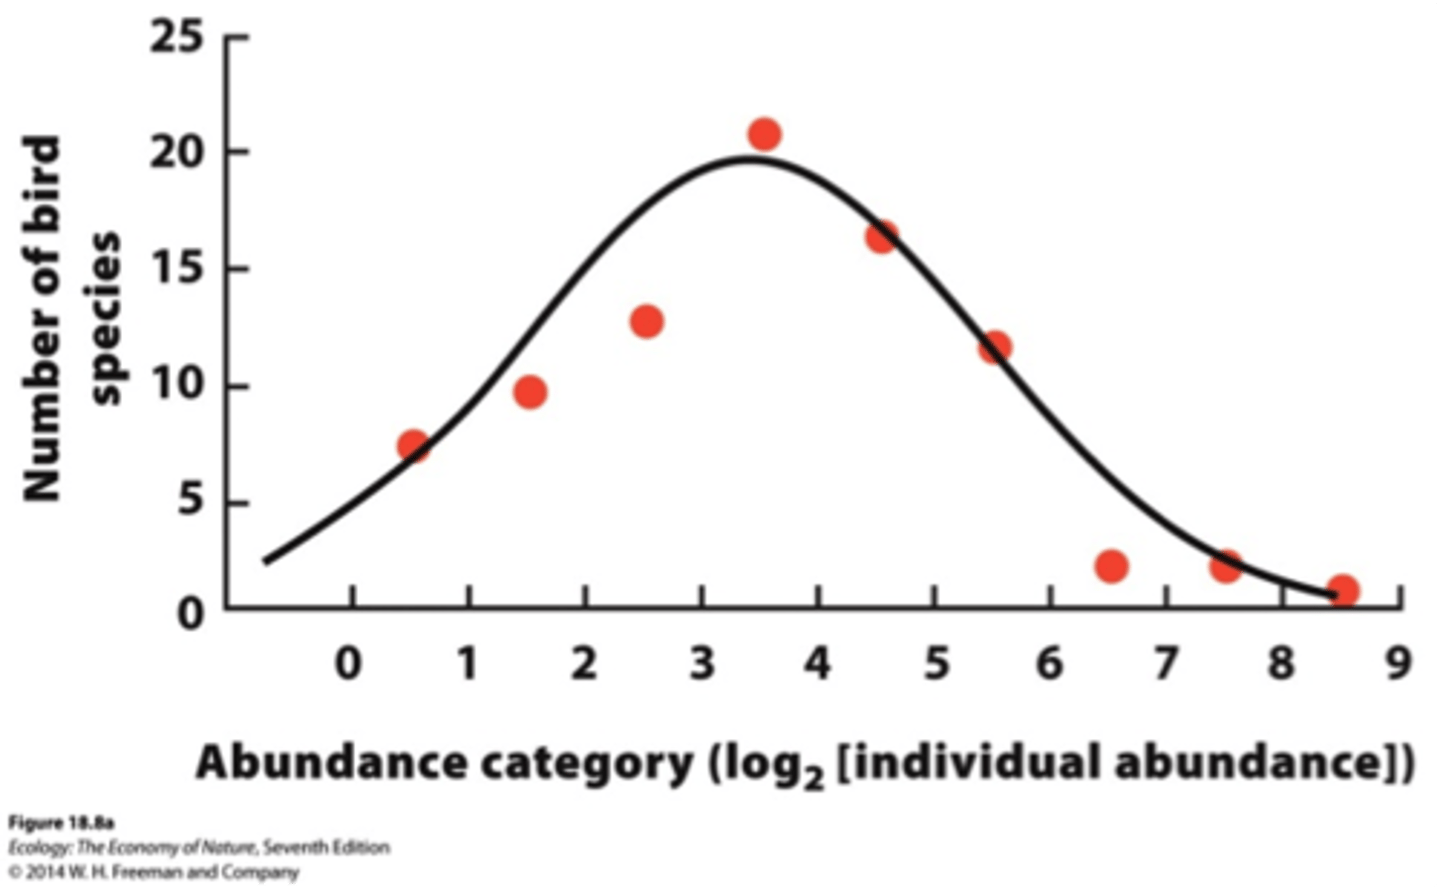
species abundance and diversity main takeaway:
Most species in a given community are moderately abundant; few are very abundant or extremely rare.
relative abundance of a species
Relative abundance is the proportion or percentage of a species relative to the total number of all individuals of all species within a community.
absolute abundance of a species
total number of individuals of a species found in a specific study area or community. It is a raw count or an estimate of the actual population size.
what type of distribution does species abundance show
lognormal distribution (bell curve)
many speces have 4 to 32 individuals whereas, only few speces have greater than 64 or less than 2.
better sampling effort shows?
more species abundance distribution
species abundance
number of individuals per species
The relationship between sample size and a species rarefaction curve
As sample size increases, the slope decreases. You begin to repeatedly encounter the most common (dominant) species.
The shape of the curve tells you if your sample size was "enough":
Steep Curve at the end: Your sample size is too small; you are missing many species.
Flat Curve at the end: Your sample size is adequate; you have captured the majority of the biodiversity.
A rarefaction curve
plotting the expected species richness against the number of individuals sampled
species diversity
a measure of diversity that increases with species evenness and species richness
A combination of the number of species and their relative abundance defines species diversity.
species evenness
the relative abundance of species in a community
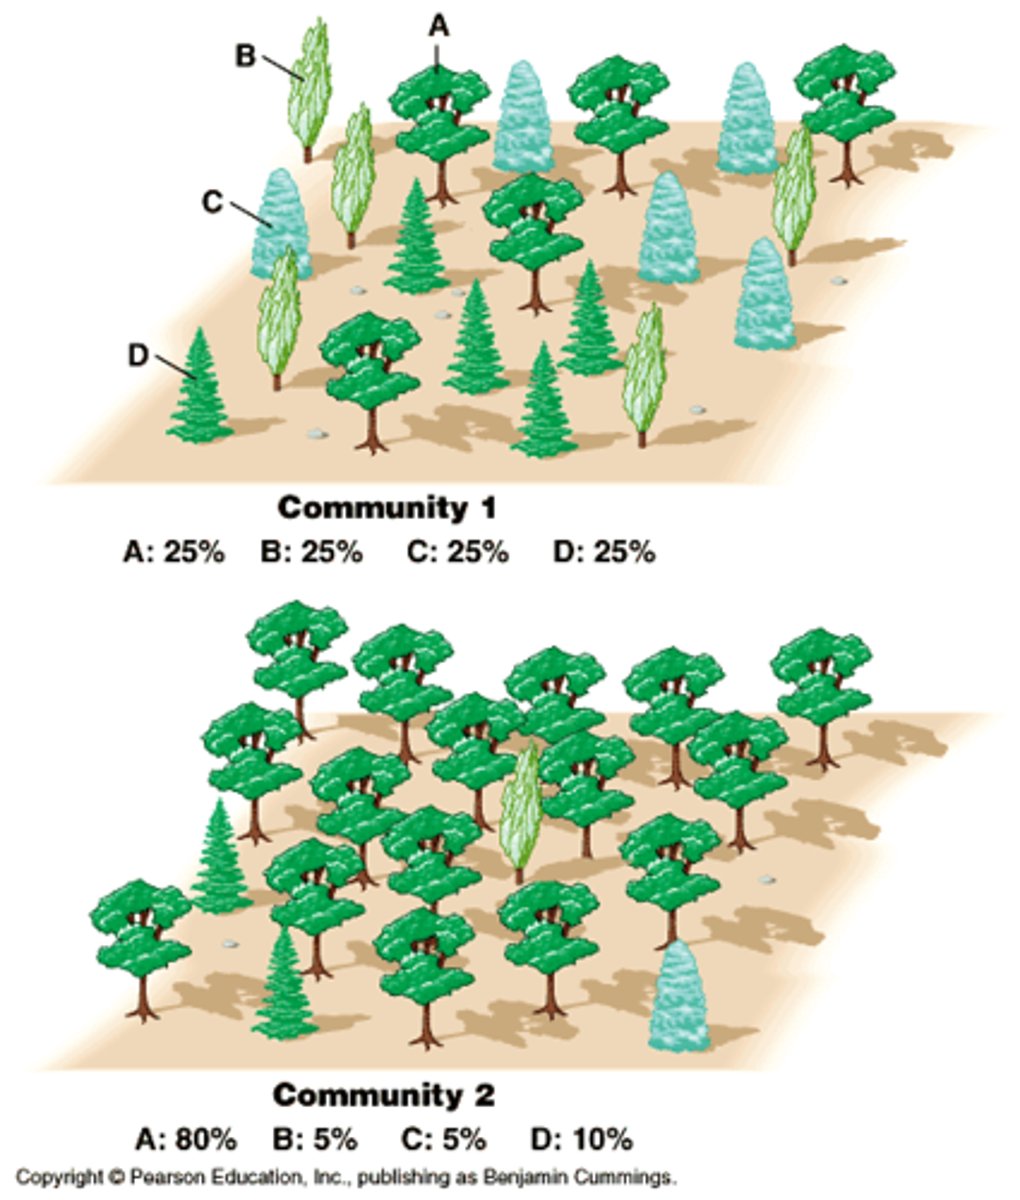
species richness
the number of species in a community

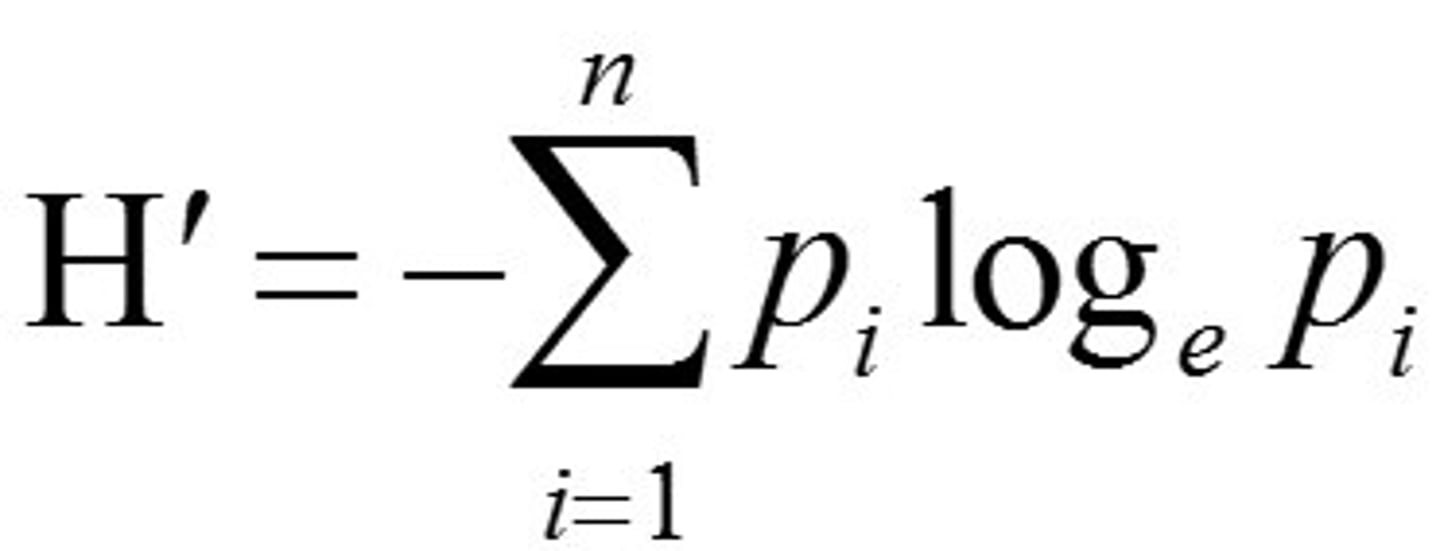
Shannon Diversity Index
H'= value of Shannon diversity index
pi: the proportion of the ith species
loge: natural logarithm (e=2.718) (aka ln)
S: number of species in the community
Community with only 1 species: proportion = 1
loge(1) = 0 -> H' = 0
H' is always >0
advantages and disadvantages of shannon diversity index
Advantage: H' is simple to calculate Disadvantage: H' is very sensitive to sample size
rank abundance curves
a curve that plots the relative abundance of each species in a community in rank order from the most abundant species to the least abundant species. in a Ln scale.
maximum abundance rank = species richness.
greater evenness = flatter slope
steeper slope indicates animal at the top of the slope dominates over the other species in the community.
Environmental Complexity main takeaway
species diversity is higher in complex environments
increased plant diversity explains?
increased animal diversity
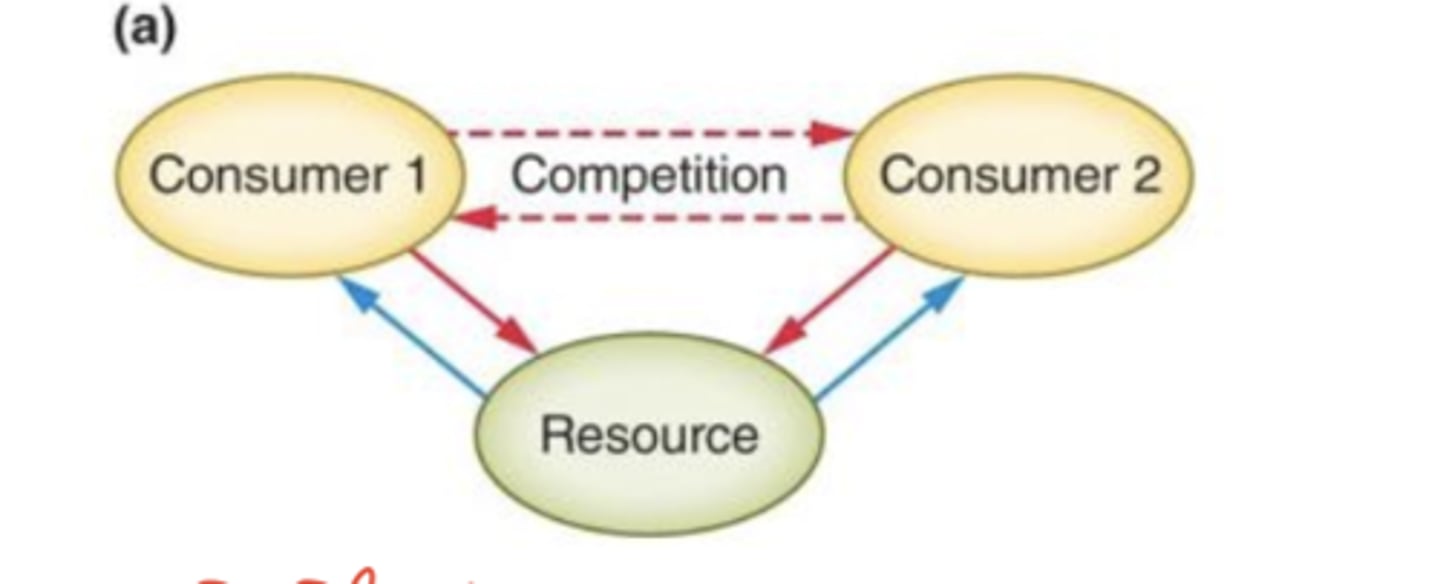
paradox of the plankton Hutchinson 1961
Phytoplankton communities
•Simple environment (open water)
•Competition for same nutrients
•Nitrogen, phosphorous, silica
•Overlapping niches!
niches of algae and terrestrial plants
•Phytoplankton may compete for same nutrients, but have different requirements/abilities to obtain those nutrients
•Recall that the niche is an n-dimensional hypervolume
•Must consider many factors, not just one
variation in soil influences ??
number of communitys.
nutrients enrichment can ?
reduce environmental complexity
•As nutrients increase, diversity of plants and algae declines.
Increasing nutrient availability reduces number of limiting nutrients.
•Light becomes single limiting resource.
•Species most effective at competing for light becomes dominant.
Urbanization Effects on biodiversity
reduces community richness and evenness. decreases diversity
how do we represent feeding relations in a community?
food chain or food web.
food webs
summary of the feeding interactions within a community
reveals community structure.
strong interactions
degree of influence of particular feeding relationship has on community structure.
Direct interactions
interactions between two species (including competition, predation, herbivory, and mutualism) that involve positive or negative effects of one species on another without the involvement of an intermediary species
ex: fox eats rabbit
indirect interactions
one species affects another through a third, intermediary species
ex: bird eats catepiller , caterpiller ate plant. bird poops plant and makes more plants.
indirect interactions: exploitative ( resource ) competition ( negative
indirect interactions Positive
commensalism
An interaction between two species in which one species benefits and the other species is neither harmed nor helped.
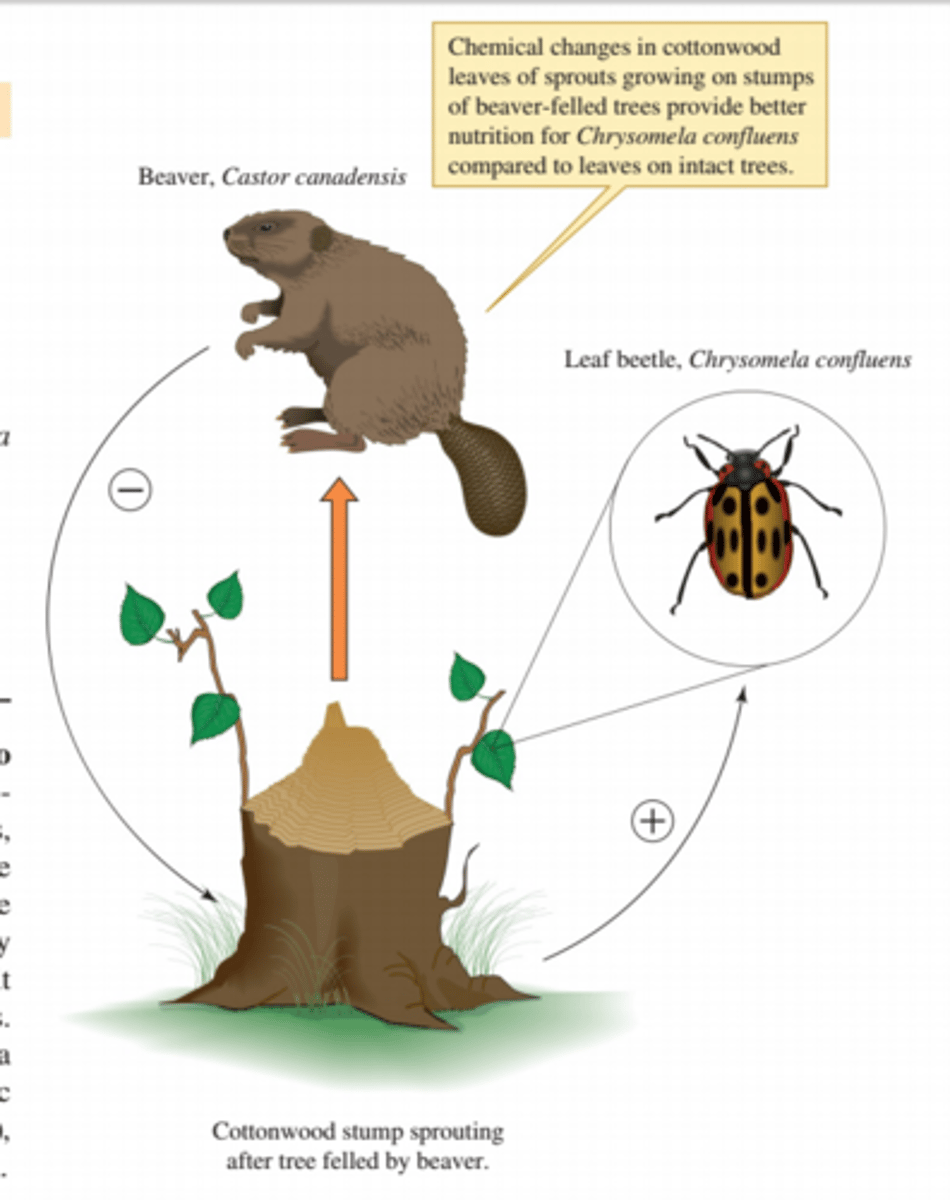
indirect commensalism
when the activities of one species indirectly benefit another species without itself being helped or harmed
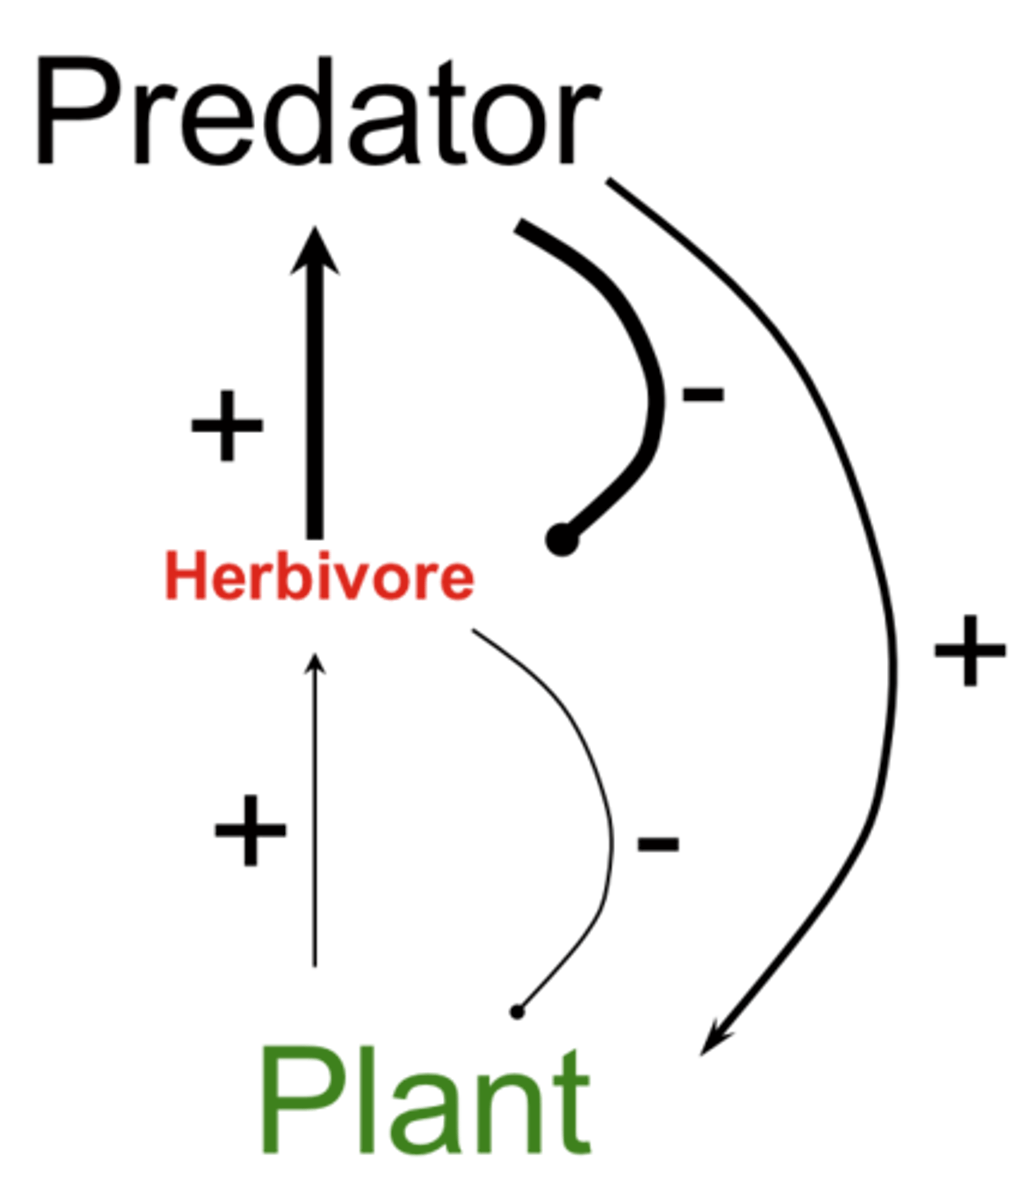
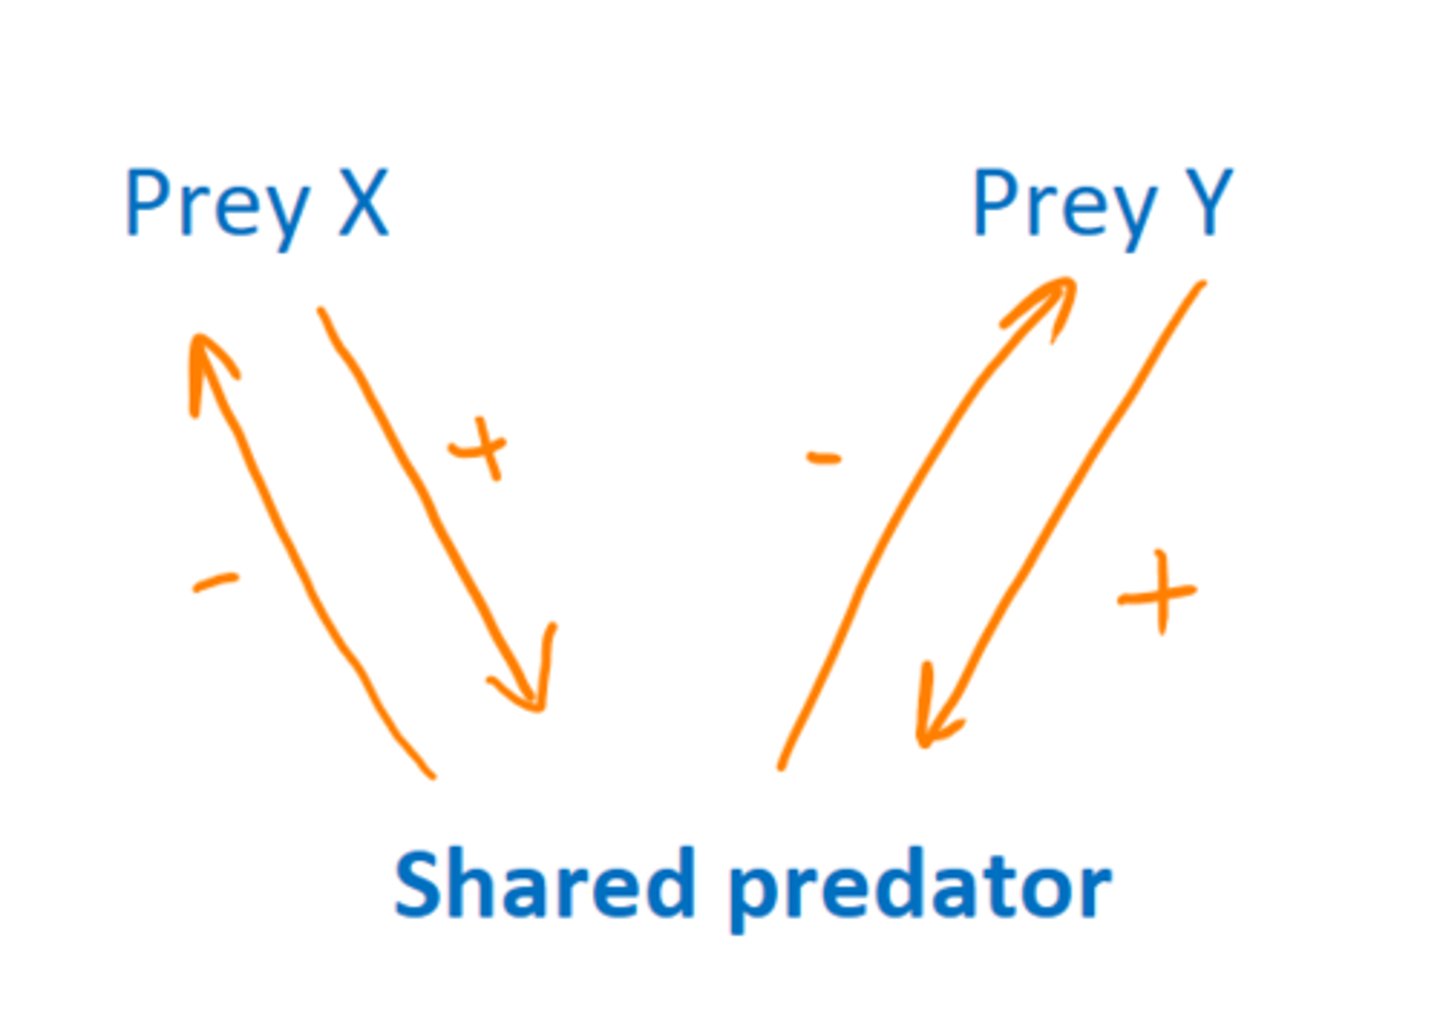
apparent competition
negative effects as a result of two species sharing a predator or herbivore or as a consequence of one species facilitating populations of a predator or herbivore of a second species
net negative interaction between both preys.
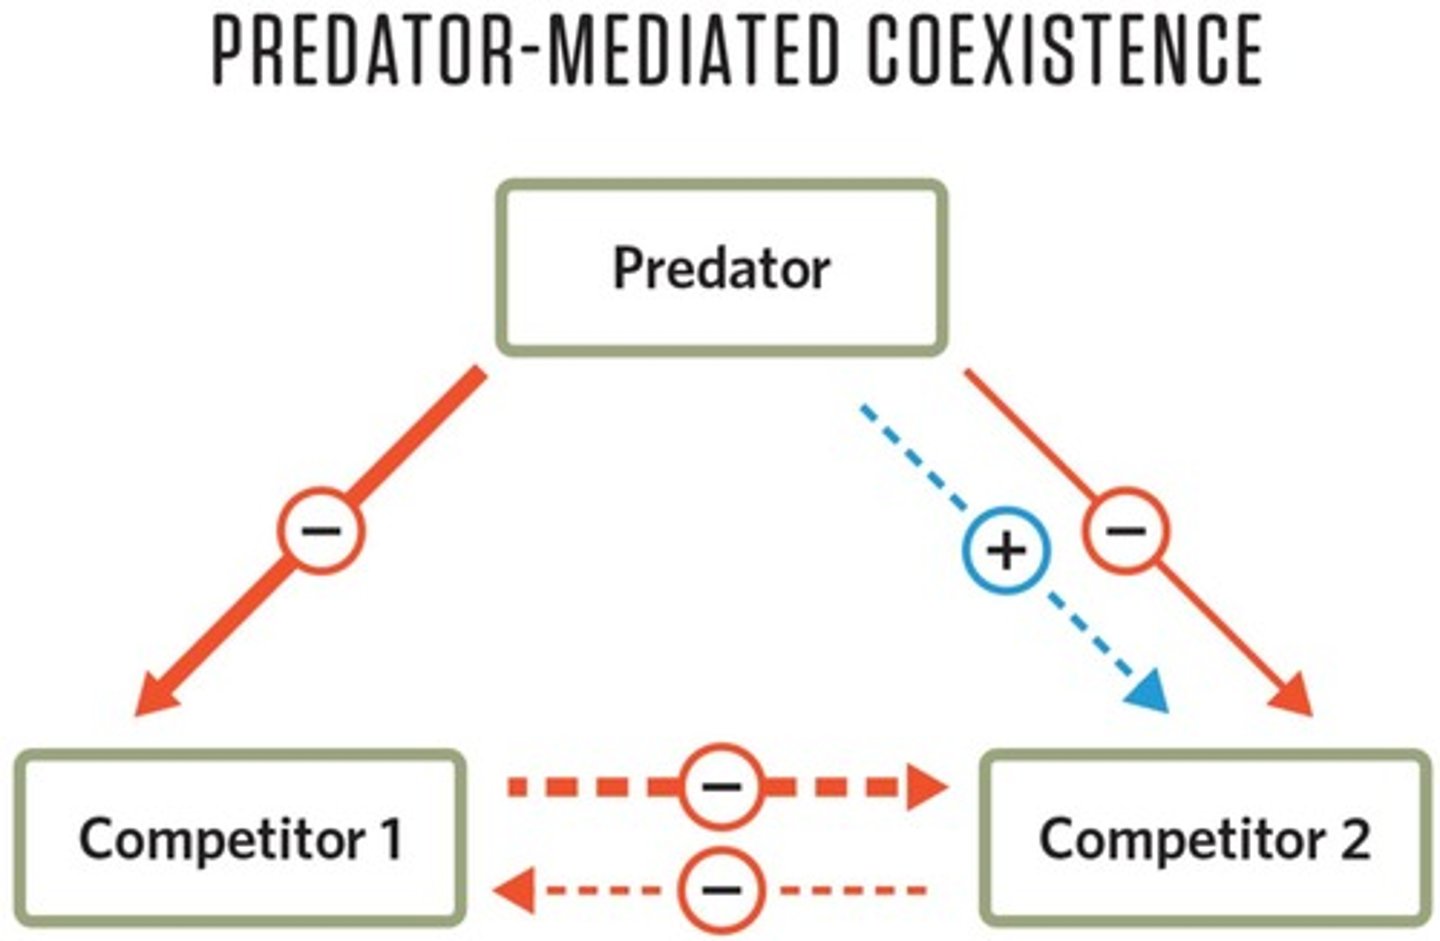
Predator-mediated coexistence
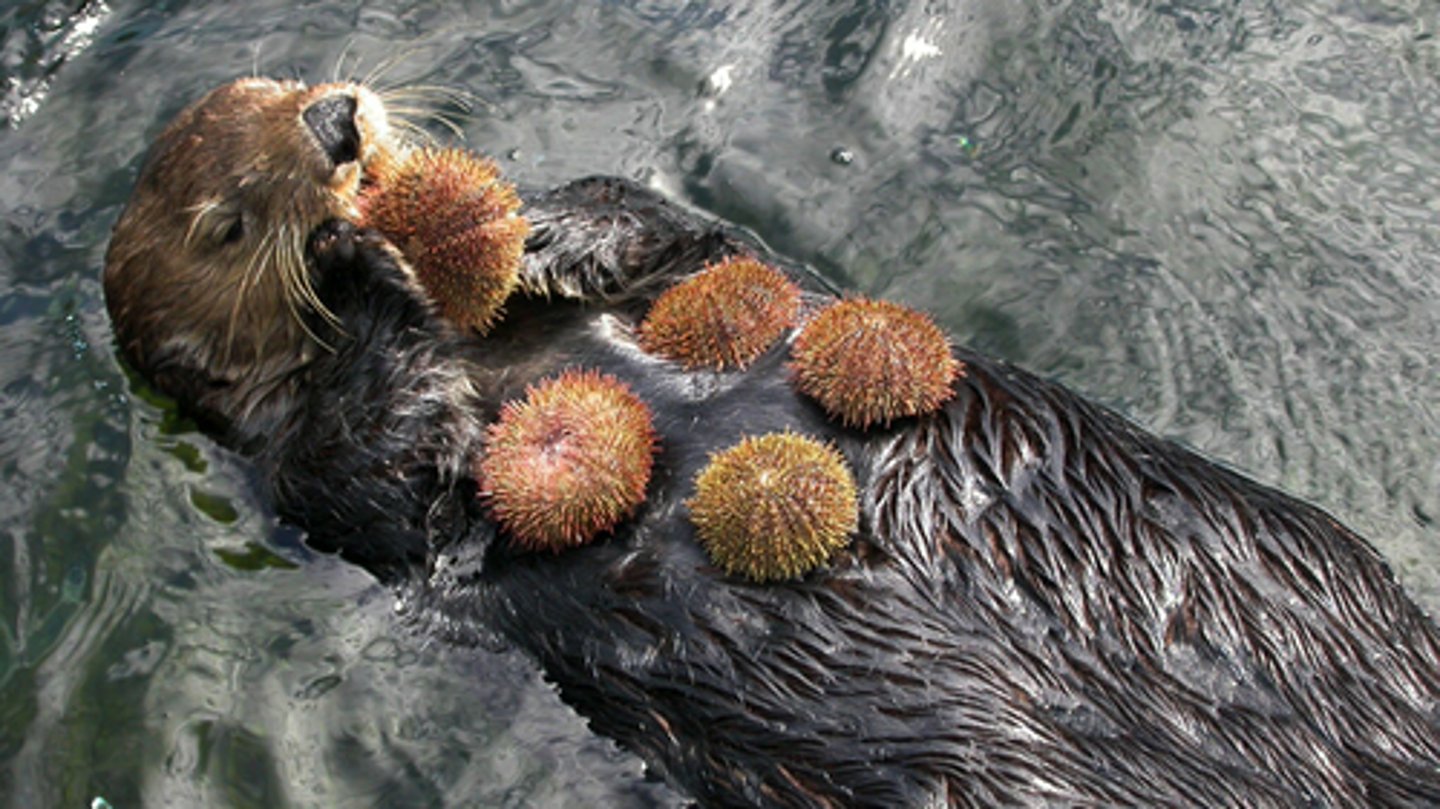
keystone species
species that, dispite low biomass, exert strong effects on the structure of the communites they inhabit.
1. predators might keep prey below carrying capacity
2. if populations are below carrying capacity, less potential for competitve exclusion
3. activity of predatory reduces competitive exclusion leading to increased species richness ( community structure.
ex: sea star removal experiment and otter
dominant species
organisms, such as abundant forest tree species or reef coral species, that substantially influences community structure as a consequence of their abundance
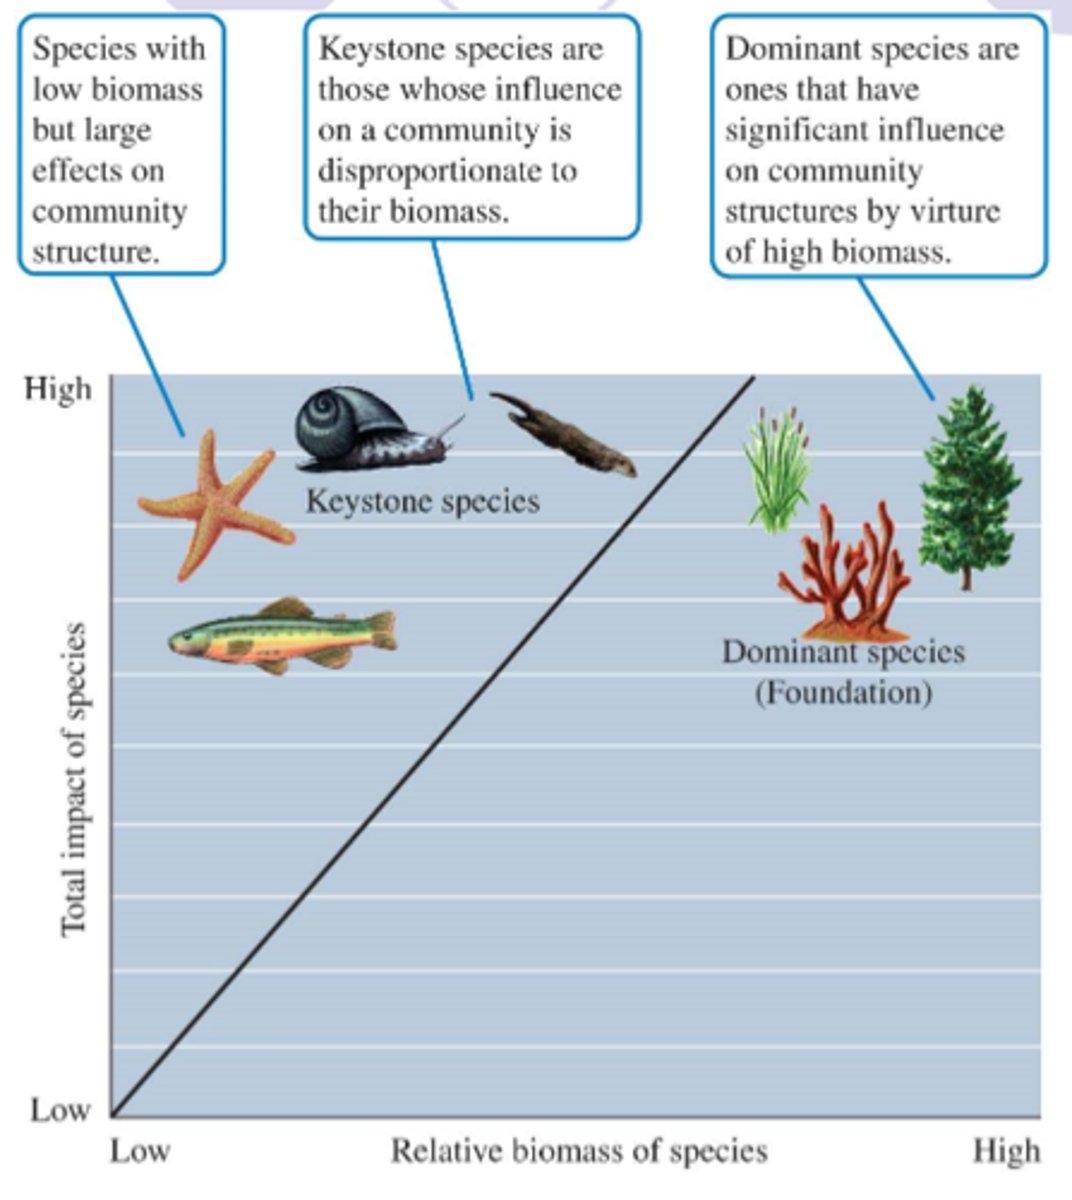
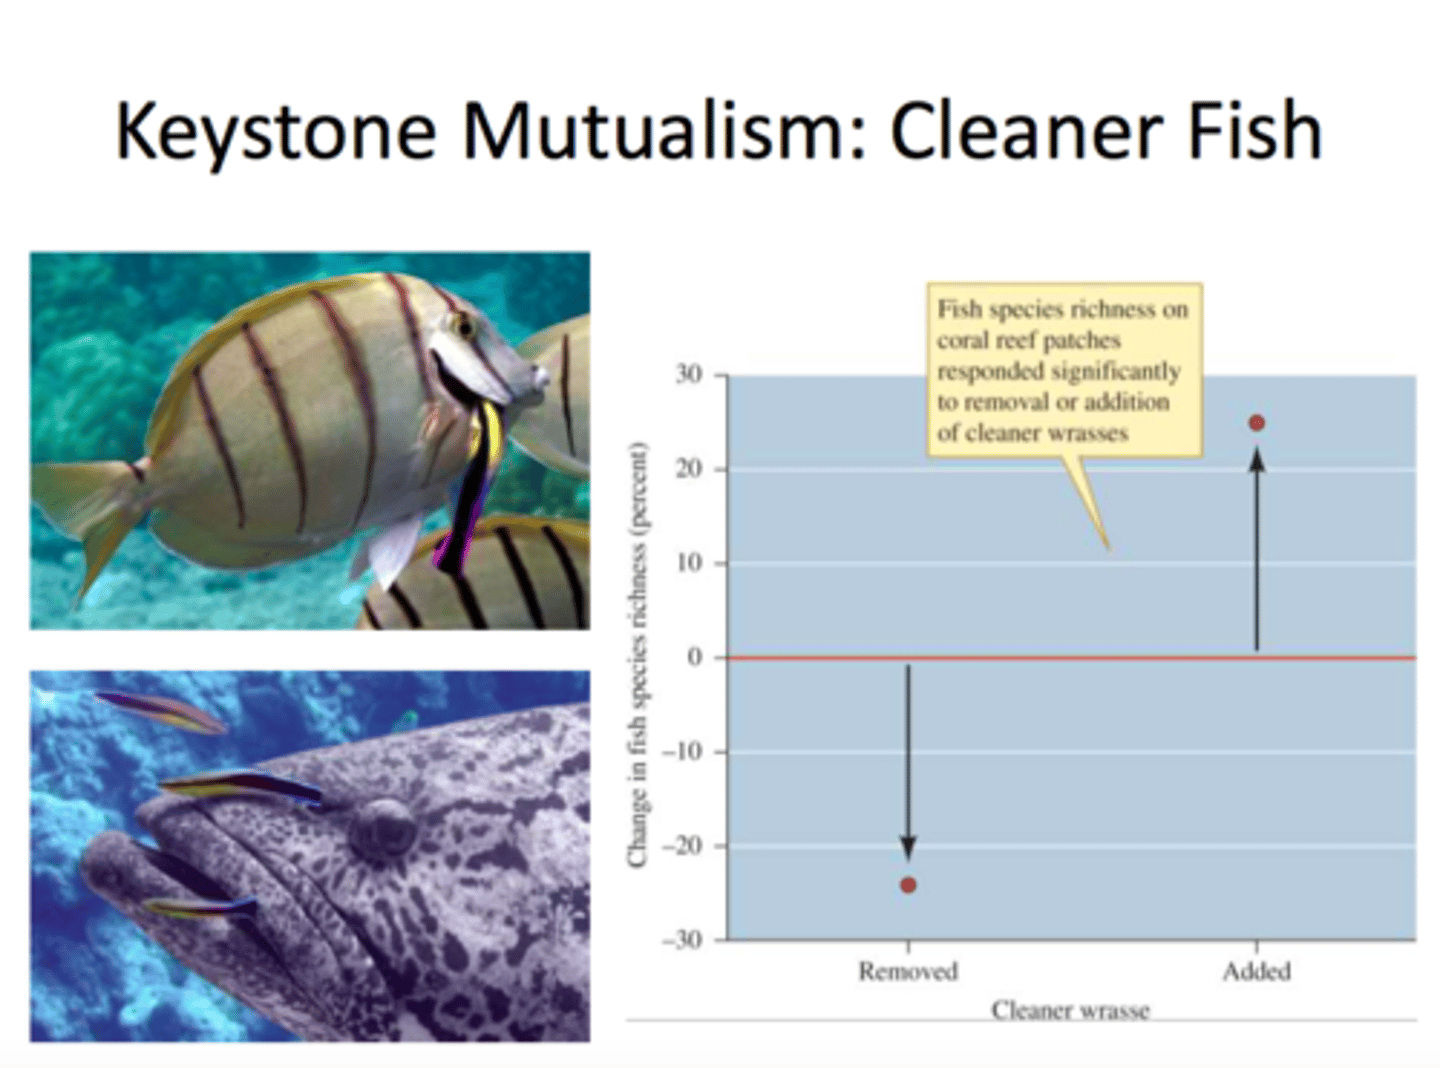
mutualistic keystones
- Mutualists can act as keystone species.•
- Keystone species have high impact on community structure, despite low biomass
ecosystem
a biological community plus all of the abiotic factors
affecting that community
Ecosystem ecologists
include the physical and chemical factors influencing the community and focus on processes such as energy flow and decomposition
photosynthesis converts sunlight into ----?
biomass. convert solar energy into stored energy
Photosynthesis ecosystem scale
•Ecosystems work to absorb,
transform, and store energy
•Physical, chemical, and biological processes
primary production
the production of organic matter, or biomass, by autotrophs in an ecosystem; in most ecosystems, the most significant autotrophs are photosynthetic
rate of primary production
the amount of energy fixed by
the autotrophs in an ecosystem over some interval of time
Gross primary production ( GPP)
the total biomass produced by the primary producers in an ecosystem over some interval of time
Net Primary Production ( NPP)
the amount of biomass left over after autotrophs have met their own energetic needs. NPP is GPP minus respiration by primary producers; it is the amount of energy in the form of biomass available to the consumers in an ecosystem
Trophic levels
•Photosynthetic autotrophs are
Primary Producers
•Herbivores are Primary
Consumers
•Carnivores that eat herbivores are Secondary Consumers
•Etc. (recall food webs)
what causes variation in Net Primary Production?
annual total precipitation and evapotranspiration
Actual evapotranspiration ( temp and precipitation)
Linear relationship.
more evapotranspiration = more primary productivity.
soil fertility and terrestrial primary production
add fertilizer, plants grow. applicable in natural systems
adding N and P increased the NPP by the most.
dry meadow=
N is largely limiting neutrient
wet meadow=
N and P joint limiting
NPP is affected by:
temp, moisture, soil nutirents.
Patterns of aquatic primary production
Aquatic primary production is generally limited by nutrient availability.
Several studies have found a quantitative relationship between phosphorus and phytoplankton biomass
lakes in japan
strong correlation between phosphorous and phytoplankton biomass.
primary producer diversity contributes to higher?
primary production.
•Physical and chemical factors affect rates of primary production.
•Biological factors also influence rates.
plant functional groups
plants with similar physiological and anatomical characteristics.
Manipulated number of species and functional groups that were present in 168 plots.
Plant species richness correlated with primary production.
N-fixing legume and C4 grass functional groups had higher productivity.
plant species richness is correlated with
higher primary production and therefore biomass
primary producer diversity increases
primary production in experimental aquatic systems
•Cardinale (20 11) found increase in nitrate uptake and biomass with increasing algal. species richness.
consumer influences
Consumers can influence rates of primary production in aquatic and terrestrial ecosystems through trophic cascades.
bottom up control
•control of a community or ecosystem by physical or chemical factors such as temperature or nutrient availability
top down control
•the control via influence by consumers
on ecosystem processes
Trophic cascades
actual NPP can be affected by biotic members of the ecosystem
•Effects of predators on prey that alter the abundance, biomass, or productivity of a population, community, or tropic level across more than one link in the food web
top down influence
large mouth bass topic cascade example
•Top down influence, Tropic Cascade
•
•Large mouth bass eat planktivorous fish
•
•Planktivorous fish eat large herbivorous zooplankton
•
•Large herbivorous zooplankton eat phytoplankton
•
•Predation by large mouth bass indirectly reduces the biomass of phytoplankton and NPP
Lake trophic cascade
•Reduction in planktivorous fish populations led to reduced feeding pressure on zooplankton.
•Large-bodied zooplankton soon dominate.
Reduced phytoplankton biomass and rate of primary production
Consistent with reported negative correlation between zooplankton body size and primary production.
compensatory growth
grazing leads to increased growth.
lower plant biomass= lower respiration cost
reducing shading
reduced leaf area= improved water balance.
grazing intensity and compensatory growth
•Too much grazing is obviously not good
•Light grazing is insufficient to produce compensatory growth
•Moderate grazing intensity maximizes
primary production
•Top down control: NPP is affected by the actions of primary consumers
top down control
NPP is affected by the actions of primary consumers
Tropic dynamics
the transfer of energy from one part of an ecosystem.
ecological efficiency
the percentage of energy in the biomass at a lower trophic level that is transferred to the biomass at the next higher trophic level
•Varies from 5%
to 20%
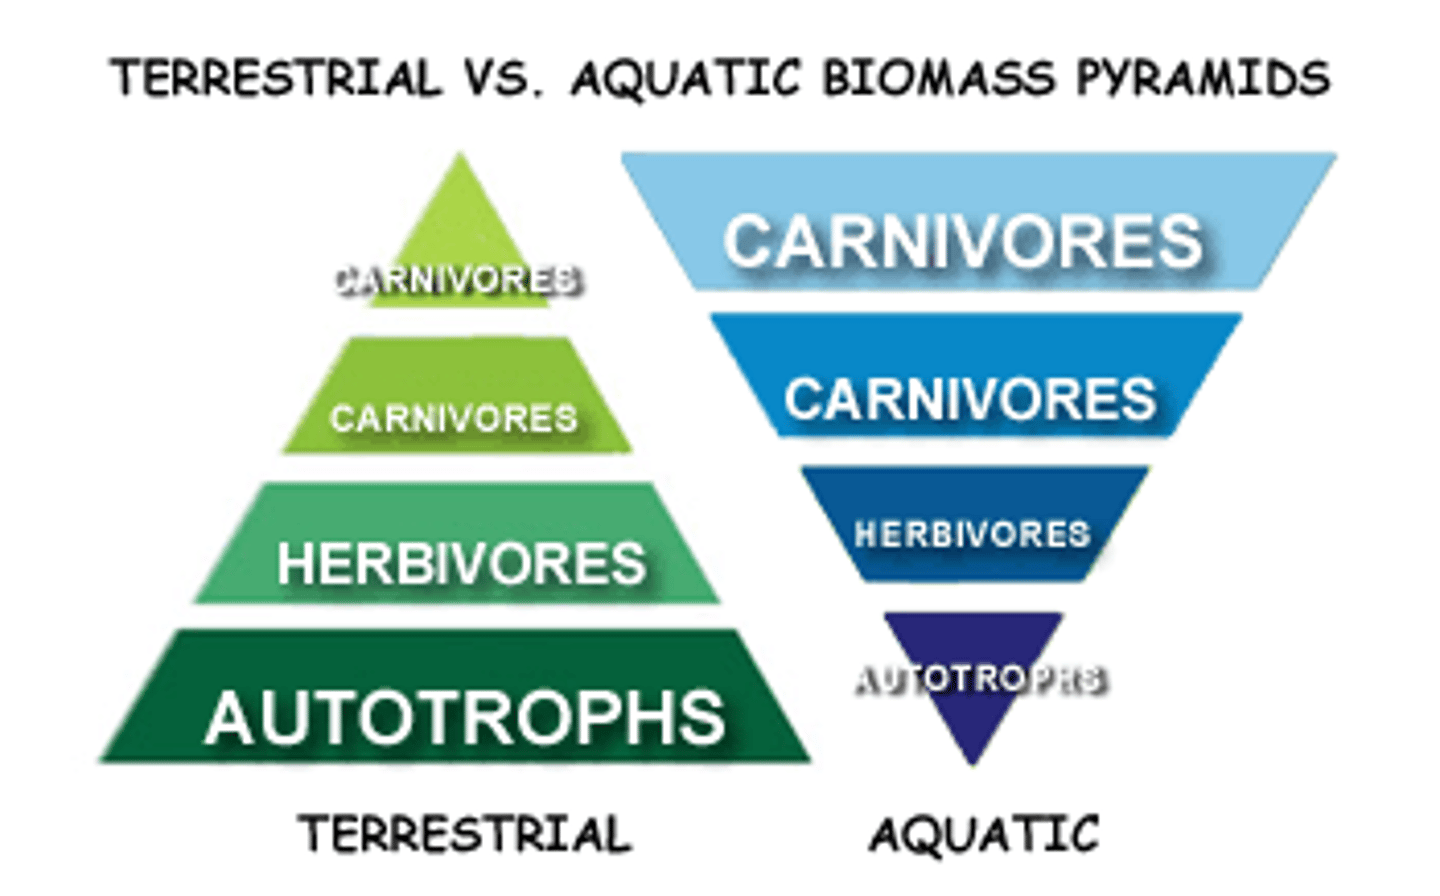
eltonian pyramid
energy is reduced as moving to higher tropic levels
energy transfer between tropic levels is?
inefficient energy is lost.
how much energy is produced in the system =
the amount of tropic levels. higher energy= more tropic levels
energy becomes increasingly limited at
higher tropic levels
the number of trophic levels is limited by
energy availability
energy flow through ecosystems
solar energy ( 100%->) primary producers (1%->) primary consumers (0.004%->) Secondary consumers -> tertiary consumers _>...
energy flows --- ecosystems
through
nutrient cycling
•the use, transformation, movement, and reuse of
nutrients in ecosystems
nutrients include
phosphorous, carbon, nitrogen, potassium, iron, others
nutrient cycles
involve the storage of chemical elements in nutrient pools, or compartments, and flux or transfer of nutrients btwn pools.
the hydrologic cycle pool/ reservoirs vs fluxes
Pools/Reservoirs/Compartments
•Oceans
•Ice
•Groundwater
•Surface freshwater
•Atmosphere
Fluxes
•Evapotranspiration
•Precipitation
•Runoff
Riverflow
nutrient pools
•the amount of a particular nutrient stored in a portion, or compartment, of an ecosystem
•Nutrient cycles are dynamic = fluxes
nutrient flux
•: the movement of nutrients between nutrient pools in an ecosystem
nutrient sink
•part of the ecosystem where nutrient is absorbed faster than released
nutrient source
•part of the ecosystem where nutrient is released
faster than absorbed
Phosporous is critical for
organismal function
•ADP - ATP
•Phospholipids
•DNA, RNA
Calciumphosphate
phosphorous cycle pools
highest to lowest:
Ocean sediments
Soil
Ocean dissolved
Available rock
Organisms
Freshwater
Atmosphere
phosporous cycle fluxes
Dissolved Organisms
Soil Organisms
Runoff
Fertilizer
Marine Detritusè Sediments
Minor atmospheric fluxes
the nitrogen is critcal to
organismal functioning
•Amino acids = proteins
•Nucleic acids = DNA, RNA
•Chlorophyll
•Hemoglobin
•
•Nitrogen is often the limiting factor for plant growth
nitrogen cycle pools
•Atmospheric
•Rocks and sediments
•Ocean
•Soil
•Vegetation
•Marine biota
Nitrogen cycle fluxes
•AtmosphereèOcean
•AtmosphereèTerrestrial
•Terrestrial Cycling
•Marine Cycling
biologically available and unavailable nitrogen
•Atmospheric nitrogen (3.9B teragrams)
•N2 Not biologically available
•N≡N triple bond is very high energy
NH3 is availble to be incorperated into tissues. Plants often via mycorrhizae
animals from plants.
organisms die: bacteria and fungi decompose and release ammonium
nitrogen fixation
•High energy process
•Lightning or nitrogen fixers
•Cyanobacteria
•Free-living soil bacteria
•Nitrogen fixing bacteria at plant roots (legumes)
•Actinomycetes bacteria (plant roots)
Nitrification
•Nitrifying bacteria
•Convert ammonia or ammonium to nitrite and then nitrate
•Chemosynthetic autotrophs
Denitrification
denitrifying bacteria ( often anaerobic conditon)