measuring biodiversity
1/21
There's no tags or description
Looks like no tags are added yet.
Name | Mastery | Learn | Test | Matching | Spaced | Call with Kai |
|---|
No analytics yet
Send a link to your students to track their progress
22 Terms
policy definitions of biodiversity
vague, immeasurable, changes depending on who you ask, no agreed upon empirical definition
aspirational but not scientific
scientific definitions of biodiversity
variety of chromosomes/alleles/species/families/biomes/ecosites etc
generally focuses on organismal biodiversity
species richness, diversity, composition and abundance
species richness
simplest measure of species diversity
number of species
univariate - 1 number used to describe
species diversity
measure of diversity
index which combines species richness and species evenness - ex shannon, simpson’s
univariate - 1 number used to describe
species composition
measure of species diversity
list of species names and their relative abundances
multivariate - many numbers used to describe
number of individuals
not measure of species diversity but commonly used similarly
counts number of total individuals
univariate measure - one number used to describe
why is sampling important?
when taken in a standardized way, can represent an unbiased sample of the total biodiversity
ex quadrats, cameras, insect traps - can all have their biases but depends on objective
sampling bias
when one component or species of a population is over emphasized in a sample
goal is to include all elements of parent in same proportions to avoid this
is observed species richness biased?
hard to accurately measure or estimate by observation - downward biased
problems w number of individuals and number of species - standardizing by sampling effort, need rarefaction curve vs species accum curve
and sample area and number of species - standardizing by area sampled (species area curve)
(need to be exactly the same across samples)
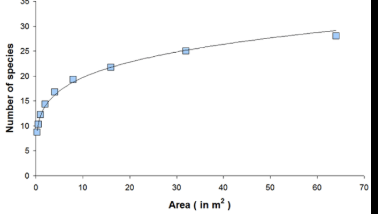
species area curve
non-linear curve means species richness increases with area but with diminishing returns. so depends critically with amount of area sampled
control by ensuring the same area is sampled between sites
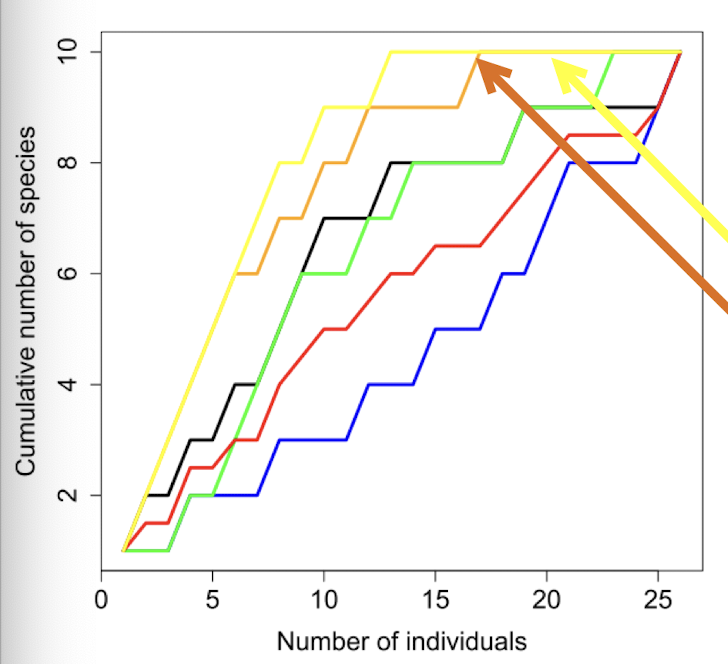
general species accumulation curve
number of species increases as numbers of individuals examined increases but with diminishing returns
depends on order sampled, which is why it changes every time you do it
individual component of rare fraction curve
control with rarefaction
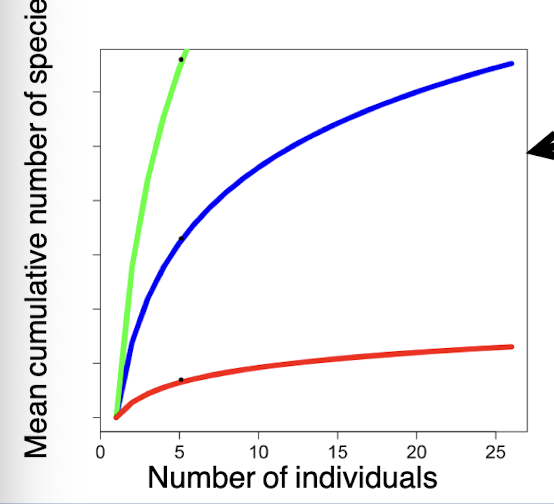
rarefied species richness
the average number of species that you will find from looking at x individuals (same number of individuals in each site)
need to compare number of species encountered after encountering the same number of individuals from each site
the closer to plateaued the closer to having measured the true number of species aka more sampling is unlikely to find more species
note axes
species accumulation curve vs size-based rarefaction curve
one re-sampling of sample, an individual component of rareified richness
need to keep re-sampling in different orders to gain a reliable estimate and see plateaus
sample coverage
the proportion of the total number of individuals in a community that belong to the species represented in the sample
coverage-based rarefraction
allows comparison of species richness at equal sample coverage instead of sample size for a better comparison
only accurate if the sample is large enough, 5-20 individuals - but when used it is the best method
alternative to size based
asymptotic estimator - chao1
tool to correct the observed richness by adding a term based on the number of singletons, doubletons, or few individuals
used to estimate total species richness when the curve has not plateaued
species diversity index
used as species richness leaves out information
a function of species richness and evenness (its both not individual measure)
two common indices are Simpson’s and Shannon’s
species evenness vs species dominance
equalness of abundance among species vs
the inverse, a lack of equalness - one species is most common
simpson’s diversity index
has many variants, gives less weight to and so cant easily detect rarer species rather detects dominance
shannon’s diversity index
has many variants, gives more weight to and so can detect rarer species (but not as well as species richness does, which counts all species)
hill numbers
unified concept of diversity, the continuum of possible diversity measures are now thought of as effective number of species (unit and def)
more intuitive measure, the number of equally abundant species necessary to produce the observed value of diversity
bias in diversity indices
less extreme as species richness as it is now only one component of the measure
but should still keep sample area constant and use rarefraction to account for the richness
species evennes doesnt have same constraints with sample area or individuals sampled