Predator-Prey relationships
1/5
There's no tags or description
Looks like no tags are added yet.
Name | Mastery | Learn | Test | Matching | Spaced | Call with Kai |
|---|
No analytics yet
Send a link to your students to track their progress
6 Terms
Image of predator-prey graph
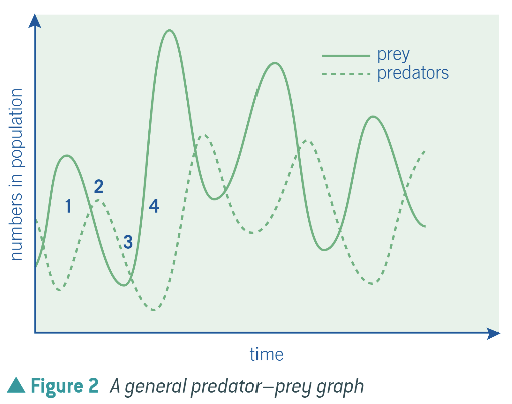
Features of stage 1 of the predator-prey graph
An increase in prey population provides more food for predators
Allows more predators to survive & reproduce
Results in increase in PREDATOR population
Features of stage 2 of the predator-prey graph
Increased predator population eats more prey organisms
Causes decline in PREY population
Death rate of prey population GREATER than its birth rate
Features of stage 3 of the predator-prey graph
Reduced prey population can’t support large predator population
Intraspecific competition for food increases
Results in decrease in predator population size
Features of stage 4 of the predator-prey graph
Reduced predator numbers result in less prey population being killed
More prey organisms survive & reproduce
Increases prey population
Cycle repeats
What is the link between predator and prey population also affected by?
Presence of other predators
Seasonal changes in abiotic factors