Module 2 Lecture 1: Statistics Refresher
1/54
Earn XP
Description and Tags
Name | Mastery | Learn | Test | Matching | Spaced | Call with Kai |
|---|
No analytics yet
Send a link to your students to track their progress
55 Terms
Psychology
Study of human behavior and mental processes
Scientific study of how people behave, think, and feel
As a science, it measures behavior, thinking, and feeling
Through data, one can objectively observe and analyze the way people behave, think, and feel
Statistics
Is a branch of scientific methodology. It deals with collection, organizing, summarizing, presenting, describing, interpreting, analyzing of data,
As well as with drawing conclusions and making reasonable decisions on the basis of such analysis.
Two Main Purpose of Statistics
Description
Inference
Description
It allows convenient forms of summaries and allows evaluation of some observations relative to others.
Inference
Logical deduction about events that cannot be observed directly
Transforming Observations into Variables
Variables are observations of physical, attitudinal, and behavioral characteristics that can take on different values.
Behavioral scientists often study abstract variables such as motivation, self-esteem, and attitudes.
Variables in a study can be characterized by the type of values that can be assigned to them.
Discrete Variables
Can take on only specific values (e.g., whole numbers); no other values can exist between these numbers.
Are commonly restricted to whole, countable numbers
Example: No. of children in the family, no. of students in a class, no. of times you wake up early in the morning in a week
No such thing as 3.5 children in the family or 5.3 times 5.4 times waking up early in a week.
Continuous Variables
Can take on a full range of values (e.g., numbers out to several decimal places); an infinite number of potential values exists
There are an infinite number of possible values that fall between any two observed values. A continuous variable is divisible into an infinite number of fractional parts.
Example: Weight (45.34 kilos), time (2.4567 seconds), distance (8.09214 kilometers)
The possible values are continuous, limited only by the number of decimal places we choose to use.
Measurement
Application of rules for assigning numbers to objects
Rules are essential in converting things into numbers
A process of linking abstracts concepts to empirical indicators
Transforming phenomenon into numerical terms
Scales of Measurement
The categories used to measure a variable
Nominal Scale
Ordinal Scale
Interval Scale
Ratio Scale
Nominal Scale
Are used for observations that have categories, or names, as their values.
Involves classifying individuals into categories that have different names but are not related to each other in any systematic way
The word ________ means “having to do with names.”
Example: Gender (Male/Female), Blood type (O, A, B), College program (BS Psych, AB History)
Ordinal Scale
Consists of a set of categories that are organized in an ordered sequence. Measurements on this scale rank observations in terms of size or magnitude.
Example: sizes (small, medium, large), rank (1st, 2nd, 3 rd), severity (mild, moderate, severe)
With measurements from an _______ scale, you can determine whether two individuals are different, and you can determine the direction of difference.
However, ________ measurements do not allow you to determine the size of the difference between two individuals.
Interval Scale
Has an arbitrary zero point. That is, the value 0 is assigned to a particular location on the scale simply as a matter of convenience or reference.
In particular, a value of zero does not indicate a total absence of the variable being measured
Ratio Scale
Anchored by a zero point that is not arbitrary but rather is a meaningful value representing none (a complete absence) of the variable being measured
Properties of Measurement Scales
Classification / Categorization
Magnitude
Equal Intervals
Absolute Zero
Classification / Categorization
This property is present in all types of measurements. This property allows the categorization of objects being measured.
Magnitude
This property is present when you can tell which object is more, or less, or if the objects are just equal.
Equal Intervals
This property is present when the difference between two points at any place on the scale has the same meaning as the difference between two other points that differ by the same number of scale units.
Absolute Zero
This property is present when there is a meaningful zero in the scale -- i.e. when the measurement is zero, nothing of the property being measured exists.
Four Pillars of Descriptive Statistics
Frequency Distribution
Central Tendency
Measures of Variability
Standard Scores
Frequency Distribution
Is an organized tabulation of the number of individuals located in each category on the scale of measurement
Summarize how often (or frequently) scores occur in a data set.
We can summarize how often each individual score occurs (i.e., ungrouped data) or how often scores occur in defined groups or intervals (i.e., grouped data)
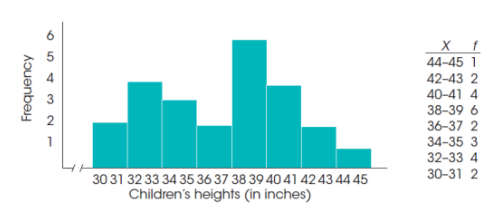
Histograms
To construct a ________, you first list the numerical scores (the categories of measurement) along the X-axis. Then you draw a bar above each X value
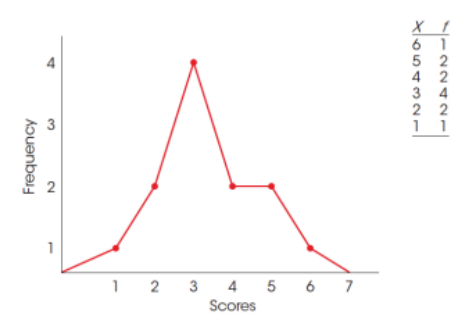
Polygons
To construct a polygon, you begin by listing the numerical scores (the categories of measurement) along the X-axis. Then,
A dot is centered above each score so that the vertical position of the dot corresponds to the frequency for the category.
A continuous line is drawn from dot to dot to connect the series of dots.
The graph is completed by drawing a line down to the X-axis (zero frequency) at each end of the range of scores.
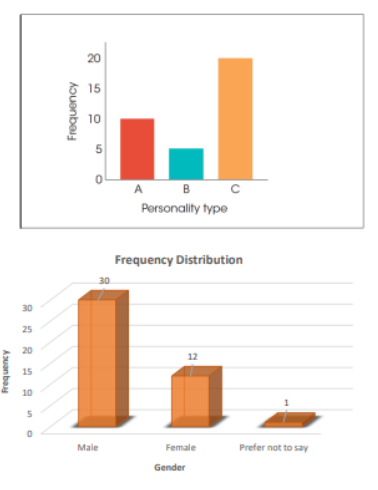
Bar Graphs
Essentially the same as a histogram, except that spaces are left between adjacent bars. For a nominal scale, the space between bars emphasizes that the scale consists of separate, distinct categories.
For ordinal scales, separate bars are used because you cannot assume that the categories are all the same size.
To construct a ______, list the categories of measurement along the X-axis and then draw a bar above each category so that the height of the bar corresponds to the frequency for the category
Smooth Curves
When a population consists of numerical scores from an interval or a ratio scale, it is customary to draw the distribution with a ________ instead of the jagged, step-wise shapes that occur with histograms and polygons.
The ______ indicates that you are not connecting a series of dots (real frequencies) but instead are showing the relative changes that occur from one score to the next.
One commonly occurring population distribution is the normal curve.
Shape of a Distribution
there are three characteristics that completely describe any distribution: shape, central tendency, and variability
nearly all distributions can be classified as being either symmetrical or skewed
Central Tendency
measures the degree to which the scores are spread over a wide range or are clustered together
In a symmetrical distribution:
it is possible to draw a vertical line through the middle so that one side of the distribution is a mirror image of the other
In a skewed distribution:
the scores tend to pile up toward one end of the scale and taper off gradually at the other end
The Tail of the Distribution
the section where the scorers taper off toward one end of a distribution
Skewed Distribution
The tail on the right-hand side is positively skewed because the tail points toward the positive (above-zero) end of the X-axis. If the tail points to the left, the distribution is negatively skewed.
especially distributions for continuous variables, there is a strong tendency for the mean, median, and mode to be located in predictably different positions
Kurtosis
leptokurtic
mesokurtic
platykurtic
Central Tendency
a statistical measure to determine a single score that defines the center of a distribution
its goal is to find the single score that is most typical or most representative of the entire group
its measures are also useful for making comparisons between groups of individuals or between sets of data
its measures are values at or near the center of a distribution
Three Common Measures of Central Tendency
mean
median
mode
Mean
most commonly reported measure of central tendency
also called as “arithmetic mean” or “average”
the sum of ∑ a set of scores (x) divided by the number of scores summed, in either a sample (n) or a population (N)
for a population, it is identified by the Greek letter mu, μ (pronounced “mew”), and the mean for a sample is identified by M or X (read “x-bar”)
is the “balance point” in a distribution
Median
its goal is to locate the midpoint of the distribution
Unlike the mean, there are no specific symbols or notation to identify the median. Instead, the median is simply identified by the word median
the definition and computations for the median are identical for a sample and for a population
if the scores in a distribution are listed in order from smallest to largest, the median is the midpoint of the list
is the point on the measurement scale below which 50% of the scores in the distribution are located
Mode
in a frequency distribution, the ______ is the score or category that has the greatest frequency
the statistical definition is similar in that the mode is the most common observation among a group of scores
there are no symbols or special notation used to identify it or to differentiate between a sample mode and a population mode
its definition is the same for a population and for a sample distribution
is a useful measure of central tendency because it can be used to determine the typical or most frequent value for any scale of measurement, including a nominal scale
For a symmetrical distribution:
the right-hand side of the graph is a mirror image of the left-hand side
the mean also is exactly at the center of a perfectly symmetrical distribution because each score on the left side of the distribution is balanced by a corresponding score (the mirror image) on the right side
If a distribution is perfectly symmetrical:
the median is exactly at the center because exactly half of the area in the graph will be on either side of the center
If a symmetrical distribution has only one mode:
it will also be in the center of the distribution
For a perfectly symmetrical distribution with one mode:
one mode, all three measures of central tendency—the mean, median, and mode—have the same value
A bimodal distribution that is symmetrical:
will have the mean and median together in the center with the modes on each side
Rectangular Distribution
Has no mode because all X values occur with the same frequency. Still, the mean and the median are in the center of the distribution
Positively Skewed
A _________ skewed distribution with the peak (highest frequency) on the left-hand side. This is the position of the mode
The vertical line drawn at the mode does not divide the distribution into two equal parts. To have exactly 50% of the distribution on each side, the median must be located to the right of the mode
Finally, the mean is typically located to the right because it is influenced most by the extreme scores in the tail and is displaced farthest to the right toward the tail of the distribution
Negatively Skewed
________ skewed distributions are lopsided in the opposite direction, with the scores piling up on the right-hand side and the tail tapering off to the left.
the mode is on the right-hand side (with the peak), while the mean is displaced toward the left by the extreme scores in the tail
the median is usually located between the mean and the mode
the most probable for the three measures of central tendency from smallest value to largest value (left to right_, is the mean, median, and mode
Variability means
variation diversity differences
The Concept of Variability
to say that things are variable means that they are not all the same
provides a quantitative measure of the differences between scores in a distribution and describes the degree to which the scores are spread out or clustered together
Measures of Variability
Range
Mean/Average Deviation
Variance
Standard Deviation
Range
the distance covered by the scores in a distribution, from the smallest score to the largest score
Mean/Average Deviation
this describe how far, on average, are all the scores from the middle
Variance
is the average squared distance from the mean
Standard Deviation
provides a measure of the standard, or average, distance from the mean
Standard Scores
your academic grades is a form of a standard score
IQ
a standardized distribution with a μ = 100 and σ = 15
z-score
a standard score that uses the mean and the standard deviation to transform each score (X value, raw scores) to standard values