1.2 Discharge relationships within drainage basins
1/36
There's no tags or description
Looks like no tags are added yet.
Name | Mastery | Learn | Test | Matching | Spaced | Call with Kai |
|---|
No analytics yet
Send a link to your students to track their progress
37 Terms
Define discharge
The volume of water passing a certain point in a river at a particular time.
Calculation for discharge
Discharge (m3/second) = velocity (m/s) x cross section area (m2)
What is a storm hydrograph?
It is a graph that shows how the discharge of a river changes over time after a storm. At a particular point on a river
Hydrographs:
Definition of rising limb
Definition of descending limb
The period during which discharge increases
The period during which discharge decreases
Hydrographs:
Definition of lag time
The time period between the end of the rainfall and the peak of the discharge
Hydrographs:
Definition of baseflow
The normal discharge of the river
Hydrographs:
Definition of peak flow
The maximum discharge in the river
Physical factors affecting discharge
Basin size, shape, relief
Rock/soil type
Drainage area and drainage pattern
Surface water stores
Size of drainage basin:
Effect on the shape of the hydrograph
Reasons
Small basin = Shorter lag time and higher peak
Large basin = longer lag time and lower peak
Water reaches the channel more rapidly in a smaller basin as shorter distance to travel
Shape of drainage basin:
Effect on the shape of the hydrograph
Reasons
Circular basin = shorter lag time and higher peak
Elongated basin = longer lag time and lower peak
Less time for water to reach the channel in circular basin as all the boundaries are an equal distance from the channel
Relief:
Effect on the shape of the hydrograph
Reasons
Steeper basin = shorter lag time, higher peak, steep rising and falling limb
Water reaches channel faster as it travels quickly downhill
Permeability of rock type:
Effect on the shape of the hydrograph
Reasons
Impermeable rock = shorter lag time, higher peak
Impermeable rocks are saturated faster than porous and pervious rocks. Saturation-excess overland flow is more common
Soil texture and structure:
Effect on the shape of the hydrograph
Reasons
Sandy soil = slower lag time, lower peak
Larger pore spaces in sandy soils than clay soils. Infiltration is most rapid in sandy spaces
Drainage area and drainage pattern:
Effect on the shape of the hydrograph
Reasons
higher density, faster water reaches the channel = short lag times, high peak discharges
Drainage density is the number of surface streams in a drainage basin. High densities found in areas of impermeable rock and clays
Surface water stores:
Effect on the shape of the hydrograph
Reasons
Higher river discharge
Lakes and glaciers could melt during a warm weather spell and more water would enter the river
Vegetation:
Effect on the shape of the hydrograph
Reasons
Forested basin = slower lag time, lower peak
Vegetation intercepts a large proportion of rainfall. Deciduous trees cause higher discharge in a forested basin in winter as less interception
Meteorological Characteristics
Type of precipitation
Rainfall intensity, amount and duration
Distribution of rainfall across the drainage basin
Prior precipitation/soil moisture
Factors affecting evapotranspiration
Length of precipitation event:
Effect on the shape of the hydrograph
Reasons
After prolonged precipitation = shorter lag time and higher peak
Ground is saturated in water = more saturation → excess overland flow.
Intensity of precipitation:
Effect on the shape of the hydrograph
Reasons
Intense rainfall = shorter lag time and higher peak
Rain is falling faster than infiltration rate so there is infiltration-excess overland flow
Type of precipitation:
Effect on the shape of the hydrograph
Reasons
After snowfall = slower lag time, lower peak
Snow does not reach channel but is stored on ground surface. As snow melts the meltwater will reach the channel quickly as infiltration is prevented if the ground is still frozen.
Factors affecting evapotranspiration:
Effect on the shape of the hydrograph
Reasons
High temps increase rate of evapotranspiration = reduce river discharge levels
Cool temps freeze the ground, restrict infiltration, increase surface run-off = high river discharge levels
Other factors (humidity) influence rates of evapotranspiration
Human Characteristics
Urbanisation (land use)
Deforestation
Urbanisation:
Effect on the shape of the hydrograph
Reasons
Urbanised catchment = faster lag time, higher peak
Higher surface run-off in urban areas as more urban surfaces and sewers take water rapidly to rivers
Deforestation:
Effect on the shape of the hydrograph
Reasons
Deforested catchment = faster lag time, higher peak
Less interception and evapotranspiration, more surface runoff in a deforested catchment
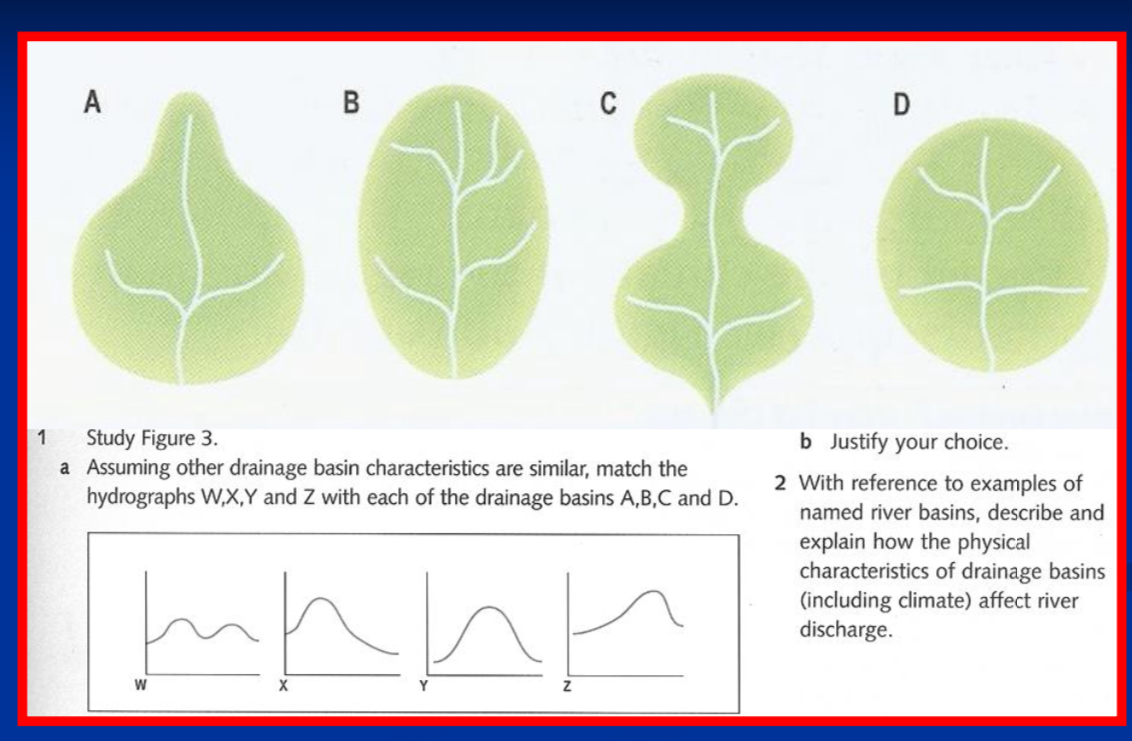
PRACTICE QUESTION
1a) Match the graph with the drainage basin
A = X
B = Z
C = W
D = Y
Calculation for drainage basin discharge
Drainage basin discharge = precipitation - (evaporation + transpiration) +/- changes in store
Hydrographs:
- What is direct channel input?
- What is antecedent discharge?
A very small amount of rainfall that falls on the river itself.
The level of discharge before the storm (summer = small, winter = large)
Explain how water gets to the river using the flows
Rain begins:
Most discharge will reach channel by BASEFLOW
As discharge increases, a larger proportion is THROUGHFLOW
Near to peak discharge, a larger proportion of water is OVERLAND FLOW
After peak discharge has passed, the descending limb is less steep because discharge no longer contains SURFACE RUNOFF
The discharge returns to baseflow level.
Explain two factors that might cause variations in river discharge throughout the year (5)
Glacial melt:
river will be frozen in cold temperatures so river discharge will be low but once it unfreezes it will increase
Vegetation:
summer there is more vegetation which decreases river discharge as it intercepts the rain. less vegetation = less interception and transpiration = soil becomes saturated quicker
Farming seasons:
more crops in farming season more vegetation = decrease river discharge = more interception and transpiration
What are river regimes?
the annual pattern of discharge by a river responding to the region’s climate.
What factors affect river regimes?
Temperatures
Rainfall
Evaporation
Morphology of basin
Vegetation
Infiltration capacity of rock
Two types of variations that can be produced by changes in discharge
Temporal Variations (over time):
Short-term fluctuations e.g. due to heavy rainfall
Medium-term fluctuations e.g. seasonal variations
Long-term fluctuations e.g. climate change or change in land use
Spatial Variations (from place to place)
Changes geographically due to climate and factors affecting discharge
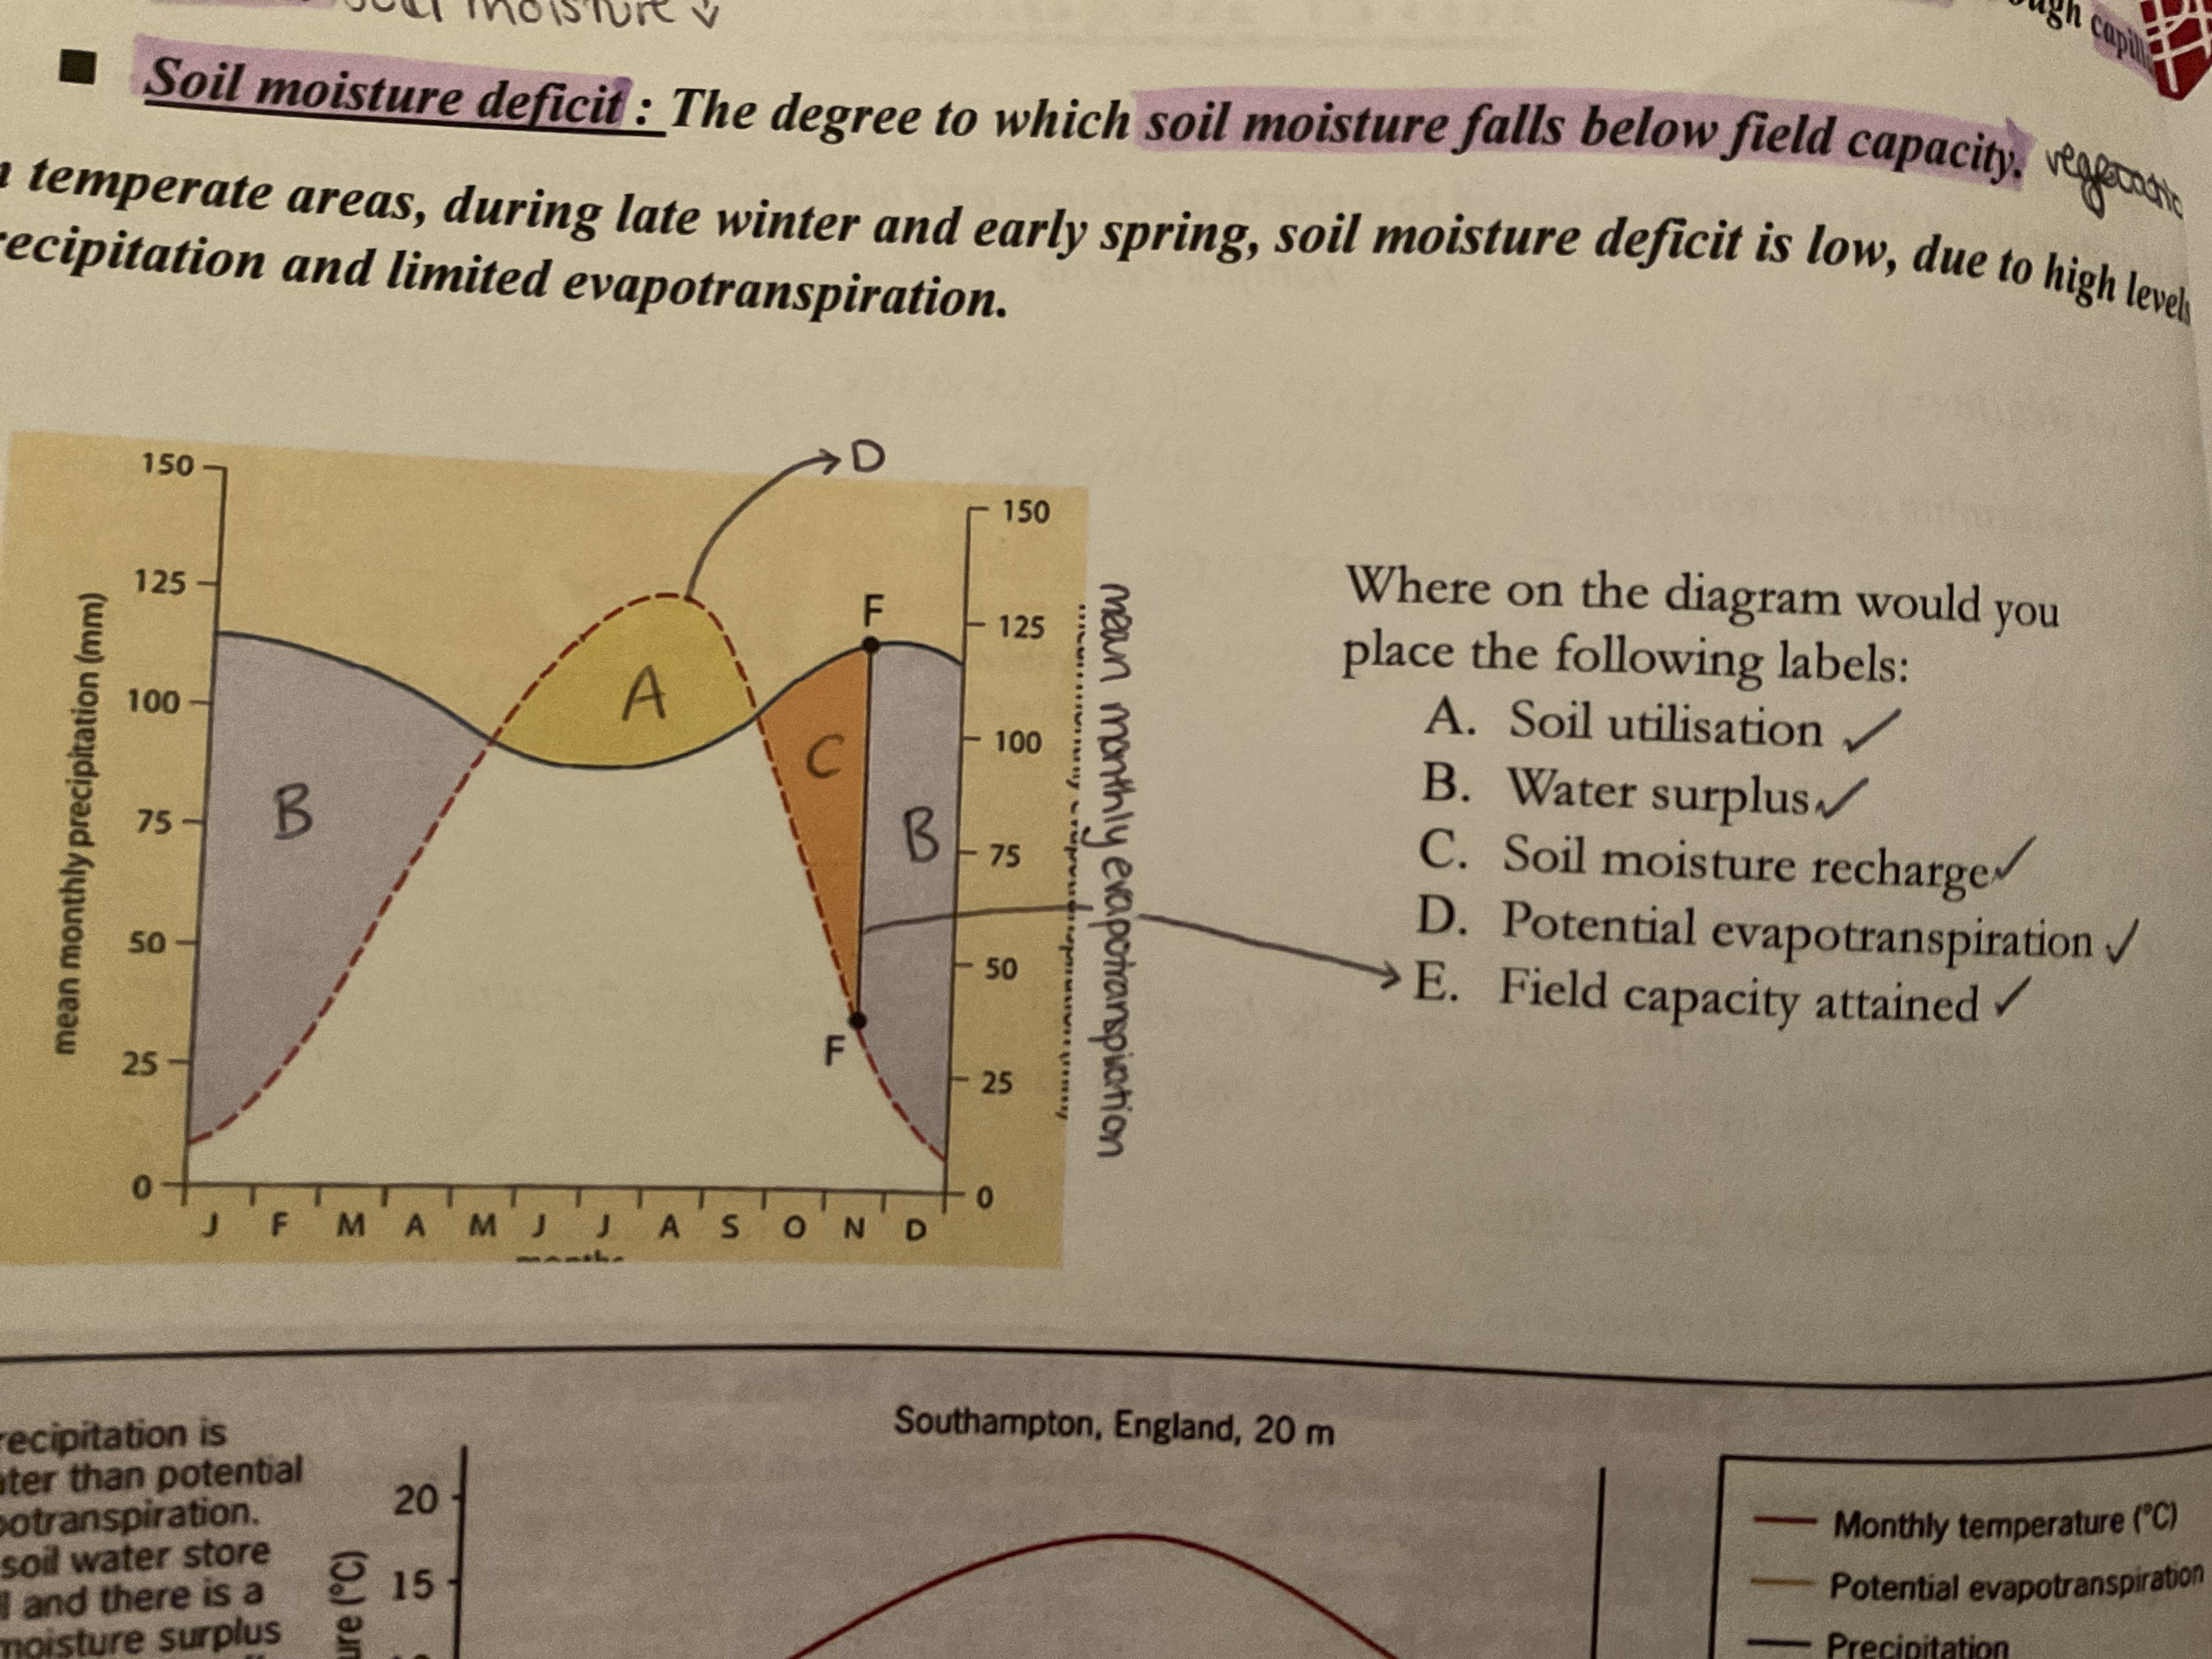
Definition of soil moisture recharge
Occurs when precipitation exceeds potential evapotranspiration
There is some refilling of water in the dried up pores of the soil
Definition of soil moisture surplus
the period when soil is saturated and water cannot enter, and so flows over the surface
Definition of soil moisture utilisation
the process by which water is drawn to the surface through capillary action
Definition of soil moisture deficit
the degree to which soil moisture falls below field capacity
GRAPH TO LEARN