incorrect stats paper 2 questions
1/16
There's no tags or description
Looks like no tags are added yet.
Name | Mastery | Learn | Test | Matching | Spaced | Call with Kai |
|---|
No analytics yet
Send a link to your students to track their progress
17 Terms
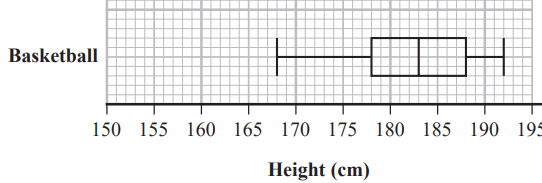
what type of skew is shown for the basket ball players height?
no skew

Using statistical software, Irina finds that the gradient of the line of best fit should be 0.19. Interpret the gradient of the line of best fit.
for every extra 1% in urban population, life expectancy increases by 0.19 years
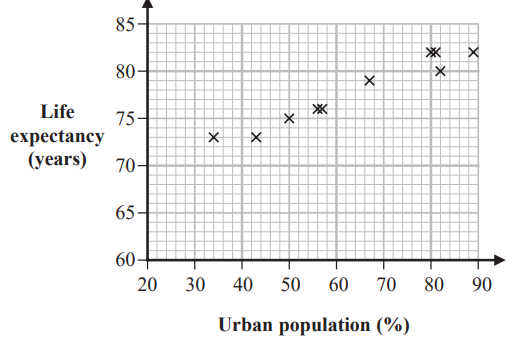
Irina now finds that South Africa has Urban population 65% and Life expectancy 63 years. Determine how this information for South Africa fits with the relationship shown in the scatter diagram for the other countries.
[1] lower life expectancy value than expected/ life expectancy for 65% should be around 77/78 (years) / life expectancy read off their line of best fit at 65%
[1] Anomaly / does not fit with other data
The department manager decides that the results of her simulation are sufficient for her to plan how much time is needed per week for consultations with each specialist. Explain why the manager is not correct.
[1] Simulation must be repeated / each simulation will give a different result
[1] we need to see the distribution of results… /to identify likely maximum/minimum / to see how much the results vary / assumes there are always 50 consultations (every week) / a comment relating to the time of each consultation. e.g. ‘the simulation doesn’t measure the time of each consultation (just the number of consultations)’
Explain what needs to be true about his two samples for them to be valid for the capture recapture method. [3]
(Each) sample needs to be random/each trout has the same chance of being caught
• Trout should be allowed to mix before taking second sample
• (Each) sample should be large enough (to be representative)
Discuss the validity and the reliability of Pual’s estimate of the num of trought in a pond using capture recapture method.
[1] Only valid if … …tags remain in place …population is ‘closed’ (no births/deaths etc) …sampling method is same each time …tagging fish does not affect the likelihood of being recaptured …appropriate time between the two samples …random sampling is used
[1] Reliability … …is high as sample sizes are large
A negative time for a train means that the train arrived early at Manchester Piccadilly. In the week, 14 trains arrived early. (b) Find how many of the 238 trains did not arrive more than 10 minutes late at Manchester Piccadilly.
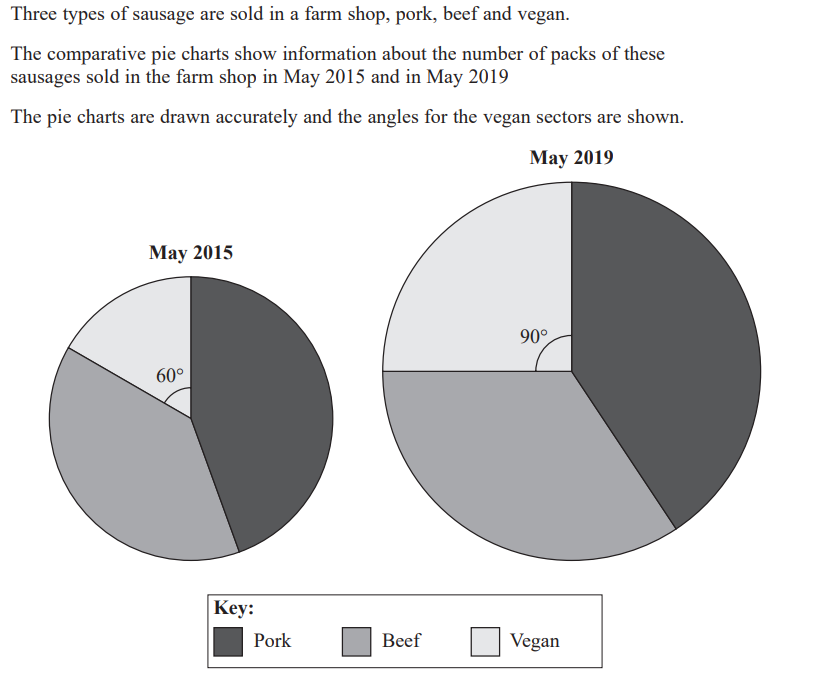
30 packs of vegan sausages were sold in the farm shop in May 2015. Work out the number of packs of vegan sausages that were sold in the farm shop in May 2019
radius for 2015 = 3cm, 2019 = 4cm
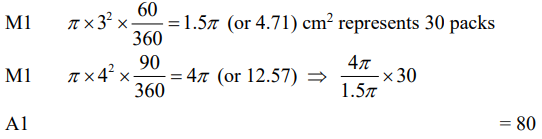
Comment on the difference between the means of these two distributions.
Mean temperature in summer is 14 C which is greater than mean temperature in winter which is 3.5 C .
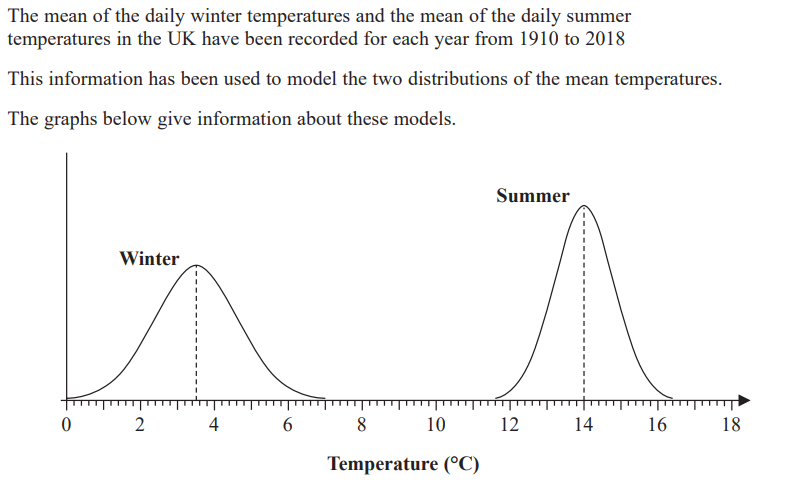
Interpret the value of the intercept of the line of best fit on the Annual profit axis
the profit when the distance is zero
Matthew is collecting information about road safety in his town. He wants to collect information from drivers who live in his town. Matthew plans to ask drivers at his local car park about their views on road safety. He plans to collect a quota sample of 20 drivers from each of three age groups. Matthew’s three age groups of drivers are : 39 years old or younger 40 years old to 59 years old 60 years old or older
Comment on whether Matthew’s plans are appropriate. [2]
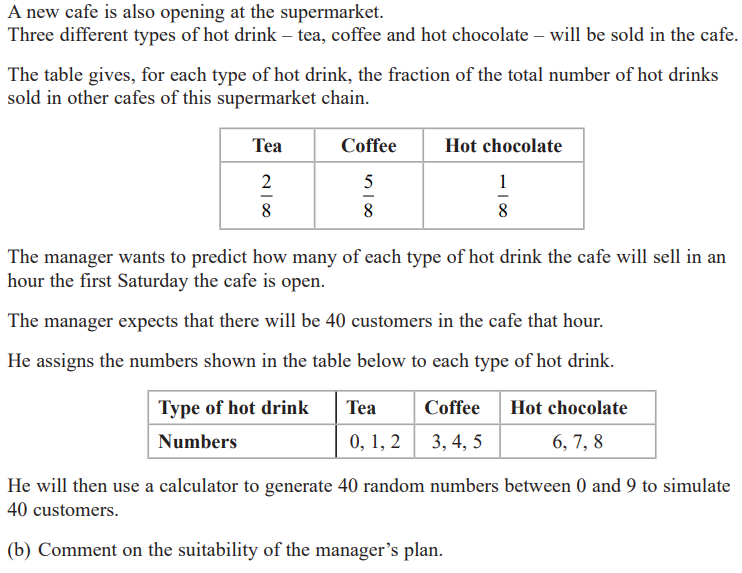
[2] the plan assumes all three drinks are equally popular/there should be 2 numbers for tea, 5 numbers for coffee and 1 number for hot chocolate / the simulation needs to be repeated multiple times to get an indication of variance / should only be using the numbers 1 to 8
[1] The plan for simulation is not appropriate
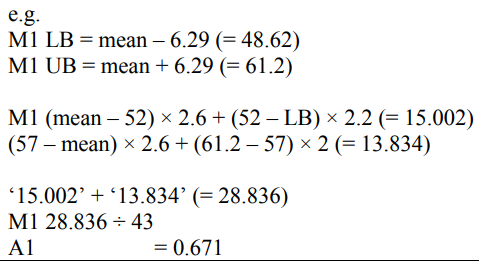
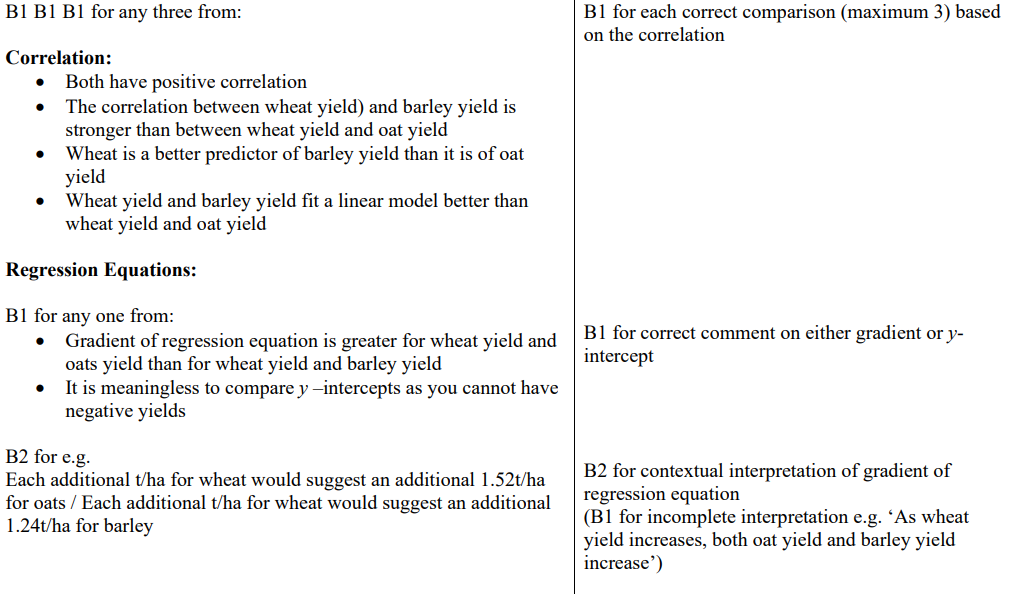
![<p>This year Louise has a field planted with wheat. She wants to use the information in the table to decide whether to plant barley or to plant oats in the field next year. She plans to plant the crop which is predicted to give the greatest yield. Louise solves the equation 1.24x – 0.30 = 1.52x – 1.05 She gets the answer 2.67 t/ha</p><p>Explain how Louise could use her answer to decide which of barley or oats to plant next year. [2]</p>](https://assets.knowt.com/user-attachments/ae23faab-9243-44f2-b8cd-8729045f7e6f.png)
This year Louise has a field planted with wheat. She wants to use the information in the table to decide whether to plant barley or to plant oats in the field next year. She plans to plant the crop which is predicted to give the greatest yield. Louise solves the equation 1.24x – 0.30 = 1.52x – 1.05 She gets the answer 2.67 t/ha
Explain how Louise could use her answer to decide which of barley or oats to plant next year. [2]
if there is less than 2.67 t/ha of wheat produced then plant barley rather than oats to get the larger yield
![<p>[2]</p>](https://assets.knowt.com/user-attachments/36237b1c-6ac8-4206-ad54-16567f684c2e.png)
[2]
Not appropriate since… • it would be better to have larger class intervals towards 0 and 40 and smaller class intervals in the middle of the data range • it would be better to collect the data before deciding on the class intervals to use
Elizabeth wants to investigate possible drainage solutions that reduce surface runoff. She wants to establish whether a particular drainage solution reduces surface runoff. Elizabeth plans to measure surface runoff in 10 areas for a year without the drainage solution. She will then install the drainage solution in these 10 areas and measure the surface runoff for a year.
Explain how Elizabeth’s plan to collect data controls some extraneous variables. You should include in your answer an example of an extraneous variable that is likely to be controlled in this investigation. [2]
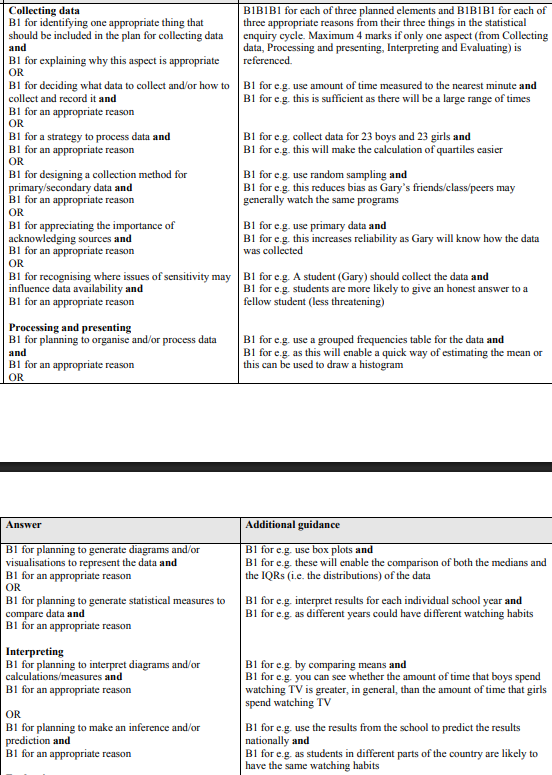
Gary is going to investigate the amounts of time students spend watching TV. He is going to write a plan for this investigation. His hypothesis is “The amount of time that boys spend watching TV is greater than the amount of time that girls spend watching TV”. Write down three other things he should include in his plan. Explain why each of these things is appropriate. You must refer to more than one stage of the statistical enquiry cycle. [6]
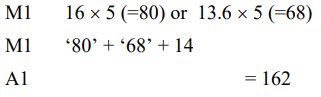
![<p>[5]</p>](https://assets.knowt.com/user-attachments/cc0142fb-af18-4760-a0fd-9ee2af476d62.png)
[5]