5-7 Hearing Science, Exam 2 Hearing Science
1/172
There's no tags or description
Looks like no tags are added yet.
Name | Mastery | Learn | Test | Matching | Spaced | Call with Kai |
|---|
No analytics yet
Send a link to your students to track their progress
173 Terms
3 auditory perceptual tasks
auditory sensitivity (detection)
auditory discrimination
auditory identification (recognition)
auditory detection
ability to distinguish between the presence and absence of sound (to hear or not hear a sound)
psychoacoustics definition
the relationship between the physical feature of sound and auditory perception
Acoustics Definition
study of the physical properties of sound
Psychology definition
study of the brain and how someone perceives the surrounding environments and stimuli
auditory discrimination
The ability to tell the difference between one sound and another sound (are the sounds the same or different?)
Auditory Identification (Recognition)
the ability to label or recognize what a sound actually is (i.e., identifying and understanding speech)
Psychoacoustics Method of Limit definition
A technique used to measure a person's sensory threshold by gradually increasing or decreasing the intensity of a stimulus until the person's response changes
Method of limit ascending
You start below the person's threshold (so they can't hear it) and increase the intensity step-by-step until they indicate that they can hear the sound
The point at which they first hear the sound estimates the threshold.
Method of limit descending
You start above threshold (clearly audible) and decrease intensity step-by-step until the person indicates they cannot hear the noise
The point where they lose perception is another estimate of the threshold.
Method of limits adaptive
The test changes direction depending on the listener's response.
Example: If they say they hear it, the next step is softer; if they don't hear it, the next step is louder.
This helps quickly "zero in" on the exact threshold.
Fixed Step Size
Each increase or decrease in sound intensity is the same amount (e.g., 5 dB, 2 dB).
Why do we use fixed step size?
Keeps the procedure consistent.
Used to gradually approach the threshold from both directions.
Even adaptive methods often use fixed step sizes for each adjustment.
Method of limits threshold
You collect the intensity levels at several reversal points.
Then you average the reversal values.
Method of limits reversal
occurs when the direction of the stimulus changes
Example: You're making the tone softer (descending) and the listener stops hearing it. Next trial, you make it louder (ascending).
method of constant stimuli
psychophysical technique where several predetermined stimulus intensities are repeatedly presented in random order, and the observer's yes/no responses are used to plot a psychometric function and determine the detection threshold.
psychometric function
A curve that shows how a person's probability (percent) of detecting or correctly responding to a stimulus changes as the stimulus intensity increases.
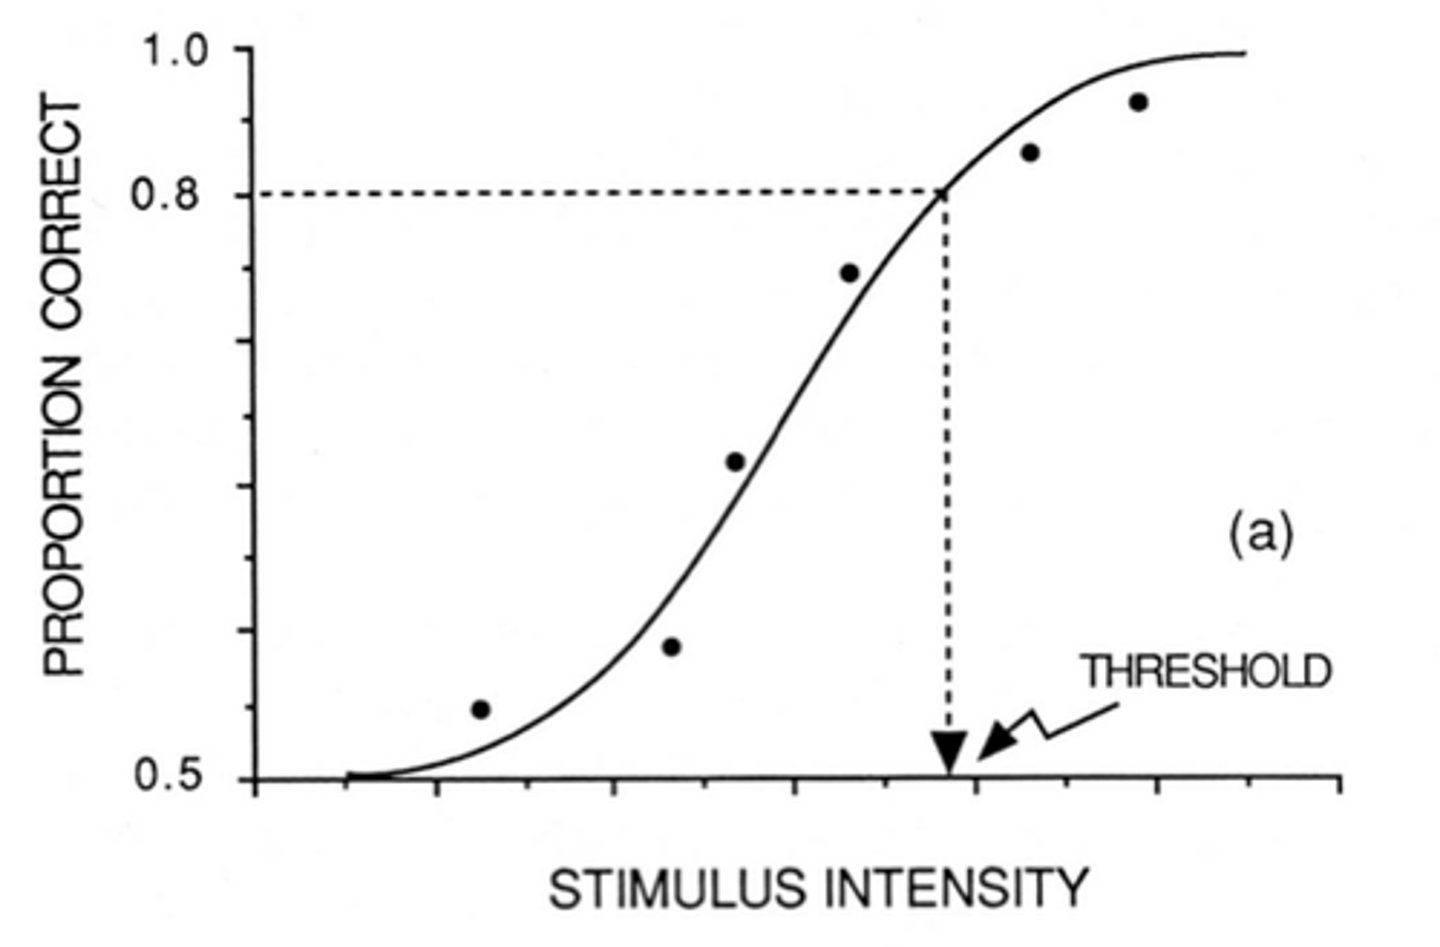
psychometric function features
There is an equal number of stimuli at each level
threshold is a certain percentage point
3 scaling methods
direct scaling, ratio scaling, magnitude scaling
direct scaling
-Directly establishes the correspondence between physical sounds and their perception.
-Loudness and pitch
ratio scale
numbers a person assigns to a stimulus reflect true numerical ratios
compared to the reference sound
magnitude scale
numeric rating system where a person assigns numbers to describe how strong a stimulus feels, so bigger numbers mean a stronger perceived intensity.
No reference sound provided
auditory masking
interference that one stimulus causes in the perception of another stimulus
what is masking measured as?
masking is measured in percentage
Amount of masking
masking efficiency - how well the masker can block auditory perception
Masking efficiency formula
amount of masking = score in Q - Score in noise
What can be a masker?
Any unwanted sound is a masker (any sound that isn't your target signal)
amount of masking depends on
timing of the masker, its intensity, frequency, and bandwidth
frequency and level of the signal and masker
tonal masker
pure tone is the masker that influences masking by noise level (more noise, more masking) and frequency (in general broader the noise frequency, the more masking there is, but it depends on the signal)
tonal masking occurs when
a loud, pure tone (the masker) makes a softer, nearby tone (the target) inaudible
Thresholds of tonal detection with tonal masker
masking efficiency is dependent on the intensity level and frequency of the tonal masker
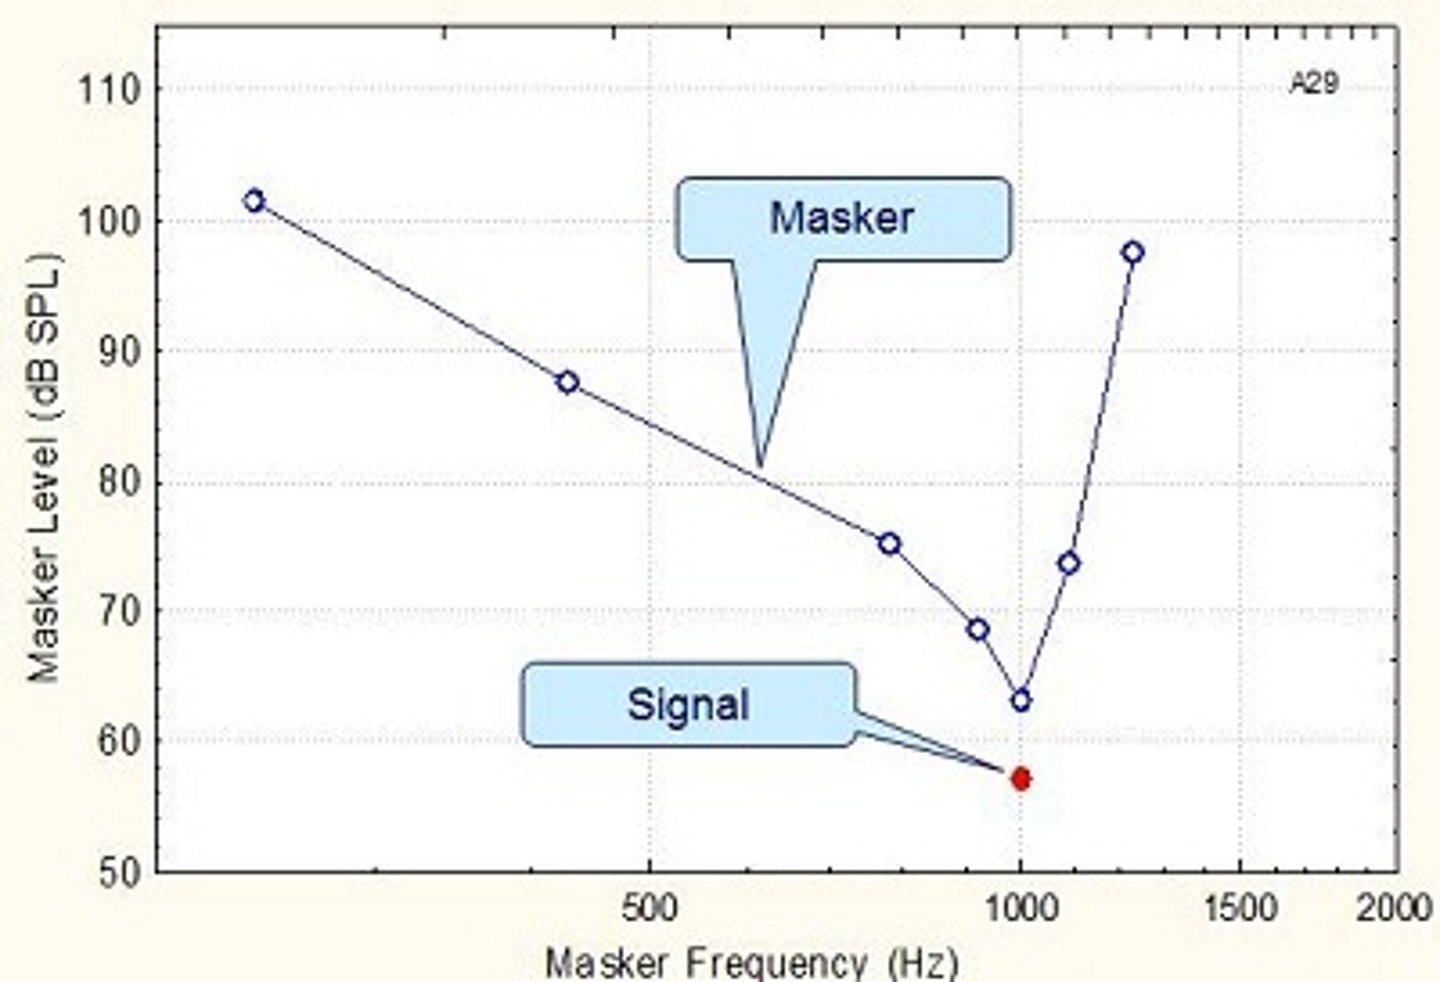
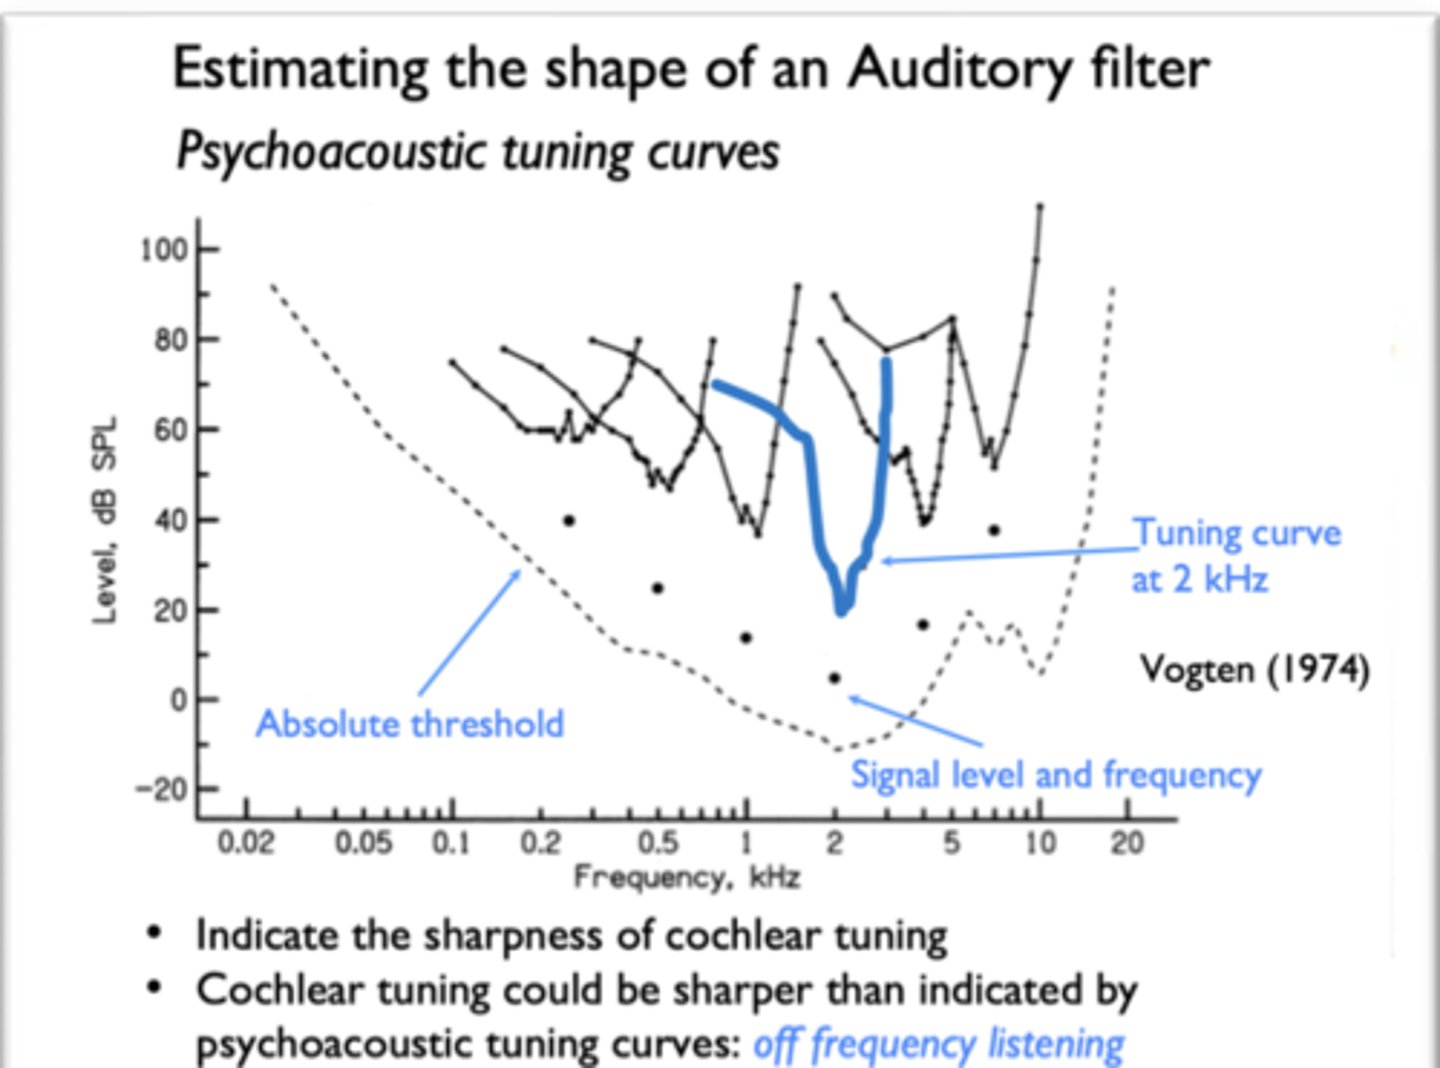
psychoacoustic tuning curve
graphical representations of an auditory system's frequency selectivity, showing the masker level needed to mask a fixed signal frequency across a range of masker frequencies.
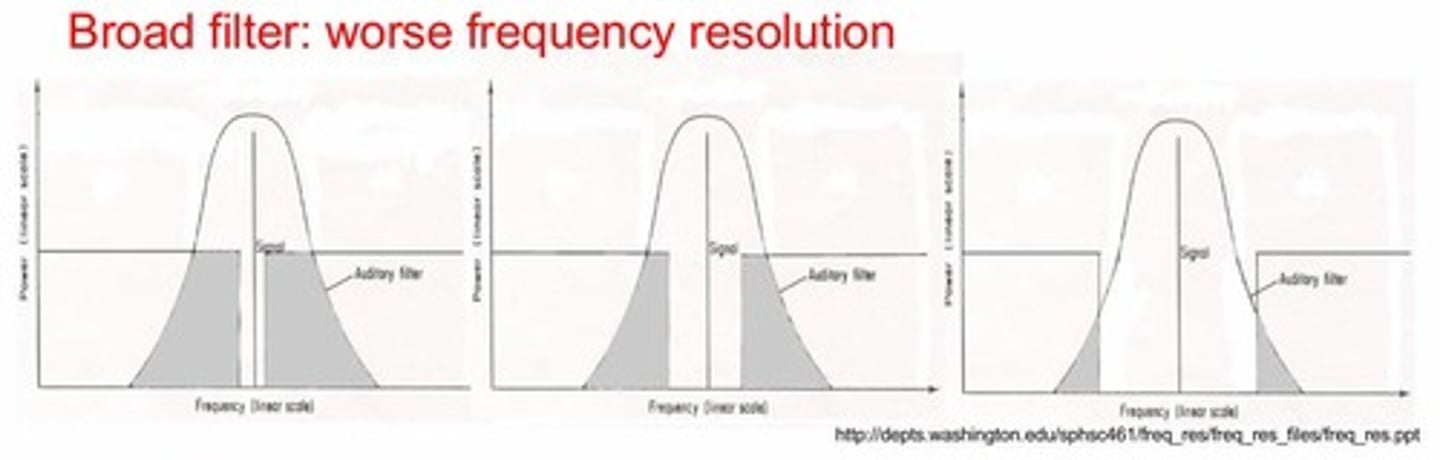
Auditory filter
a theoretical model of how the human ear, specifically the cochlea, separates sounds into different frequency bands
Frequency-dependent masking suggests that
only those frequencies close to the signal frequencies close to the signal frequency are effective in masking
Critical Band of the Auditory Filter
auditory system filters out noise frequencies far away from the signal frequency
Signal Frequency
Rate at which a signal oscillates (repeats over time), measured in hertz, determines pitch
Our auditory system is composed of a set of filters tuned to
different frequencies
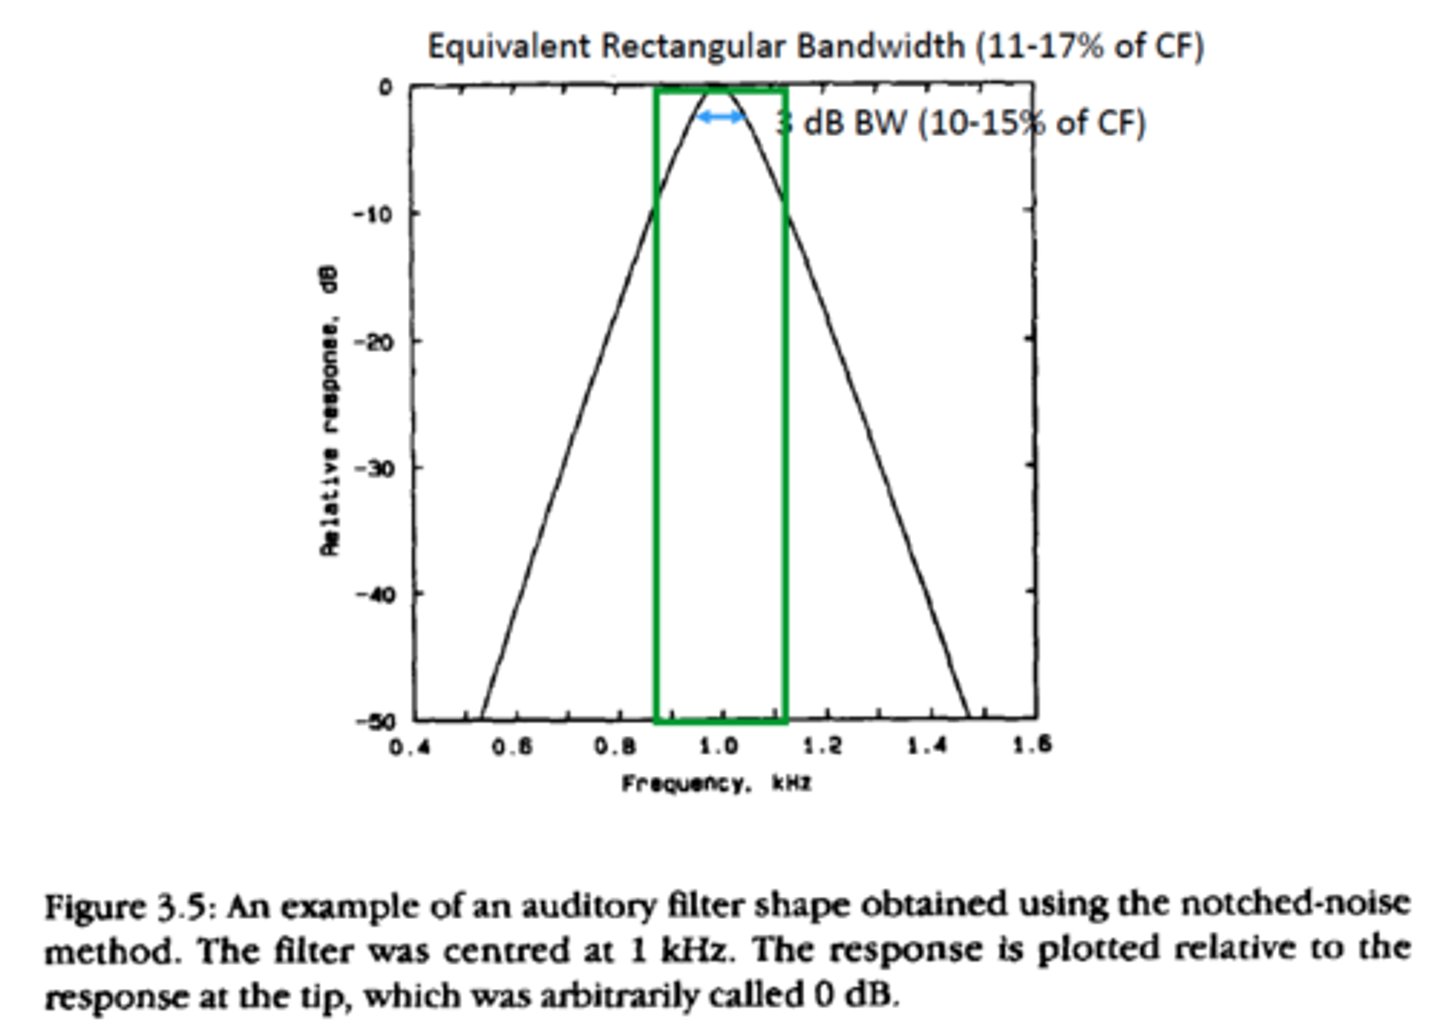
Bandwidth of auditory filter
measured by a notch noise method
affected by signal level and hearing status
Equivalent Rectangular Bandwidth (ERB)
used to estimate the size/width of the auditory filter
ERB formula
-
Auditory filter determines our
frequency selectivity
frequency selectivity
the auditory system's ability to respond differentially to different frequencies and bands of frequencies
Narrower auditory filter bandwidth =
better frequency selectivity
signal level
The higher the signal level, the broader the bandwidth of the auditory filter
What is measure-notch noise?
A method for testing a listener's ability to detect a pure-tone signal within a masker noise.
What is created in the masker noise during measure-notch noise testing?
A spectral 'notch,' or gap, around the signal frequency.
What is varied in measure-notch noise testing?
The width of the notch created in the masker noise.
auditory filter bandwidth's relationship with frequency selectivity
a narrow bandwidth results in high frequency selectivity, and a wide bandwidth results in low frequency selectivity
loudness definition
attribute of auditory sensation in terms of which sounds can be ordered on a scale extending from quiet to loud
how to measure loudness
matching and scaling
matching method
Listeners are asked to adjust the level of the target sound to match the loudness of the reference sound, has equal loudness contour
matching method reference sound
1 kHz tone at 40, 50... dB SPL
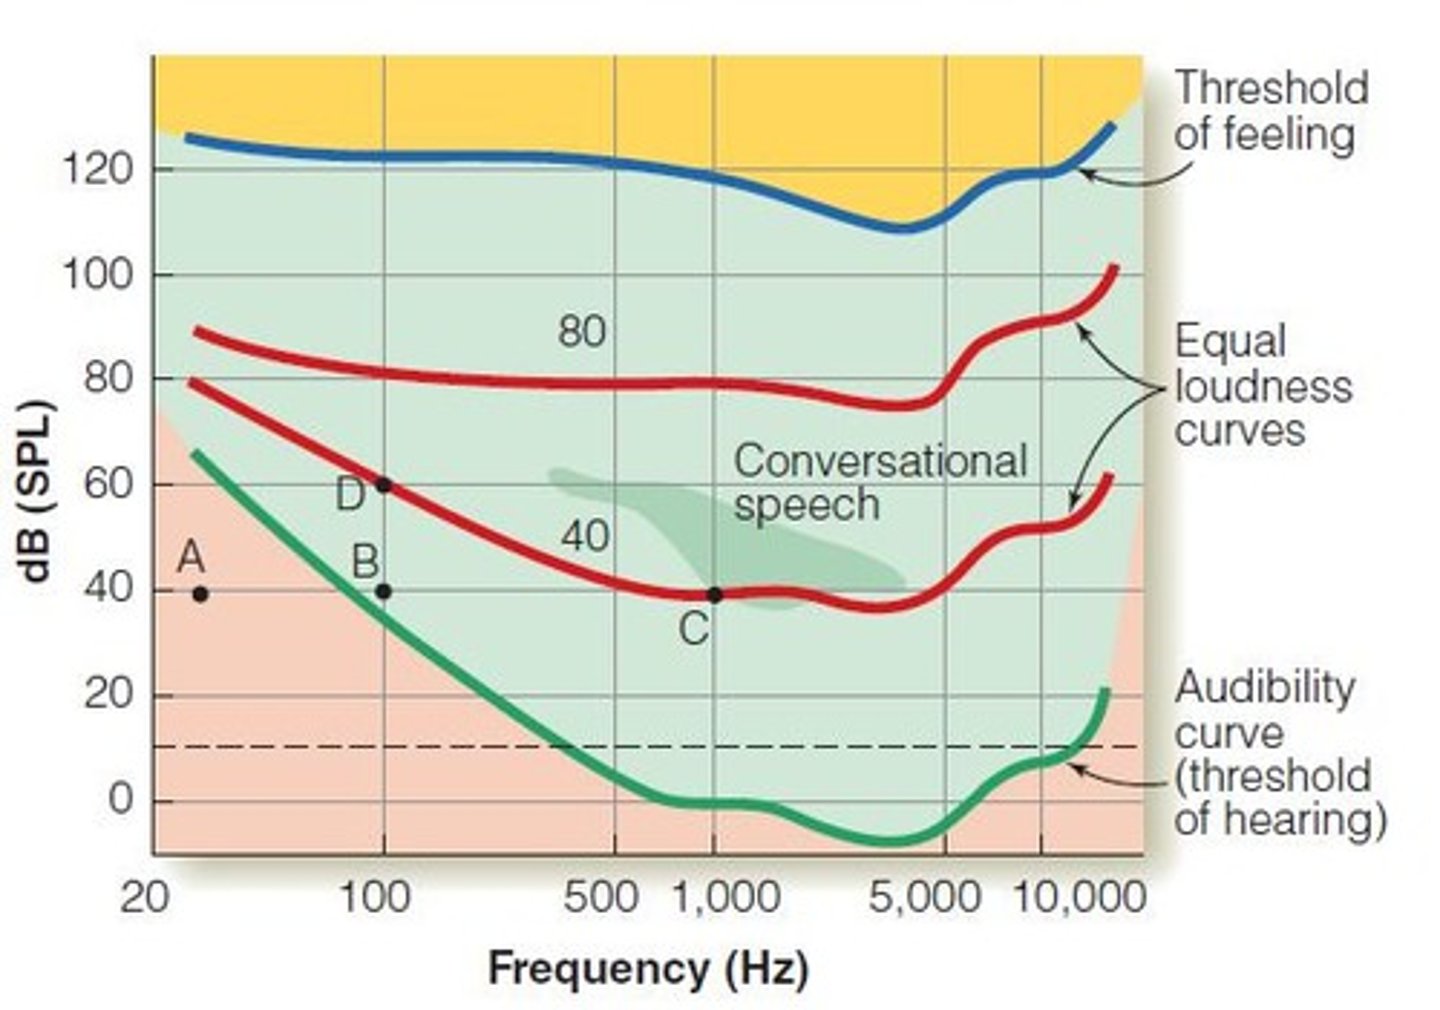
Equal Loudness Contours
graph with presentation level on the y-axis and frequency on the x-axis, showing graph lines connecting points of equal perceived loudness
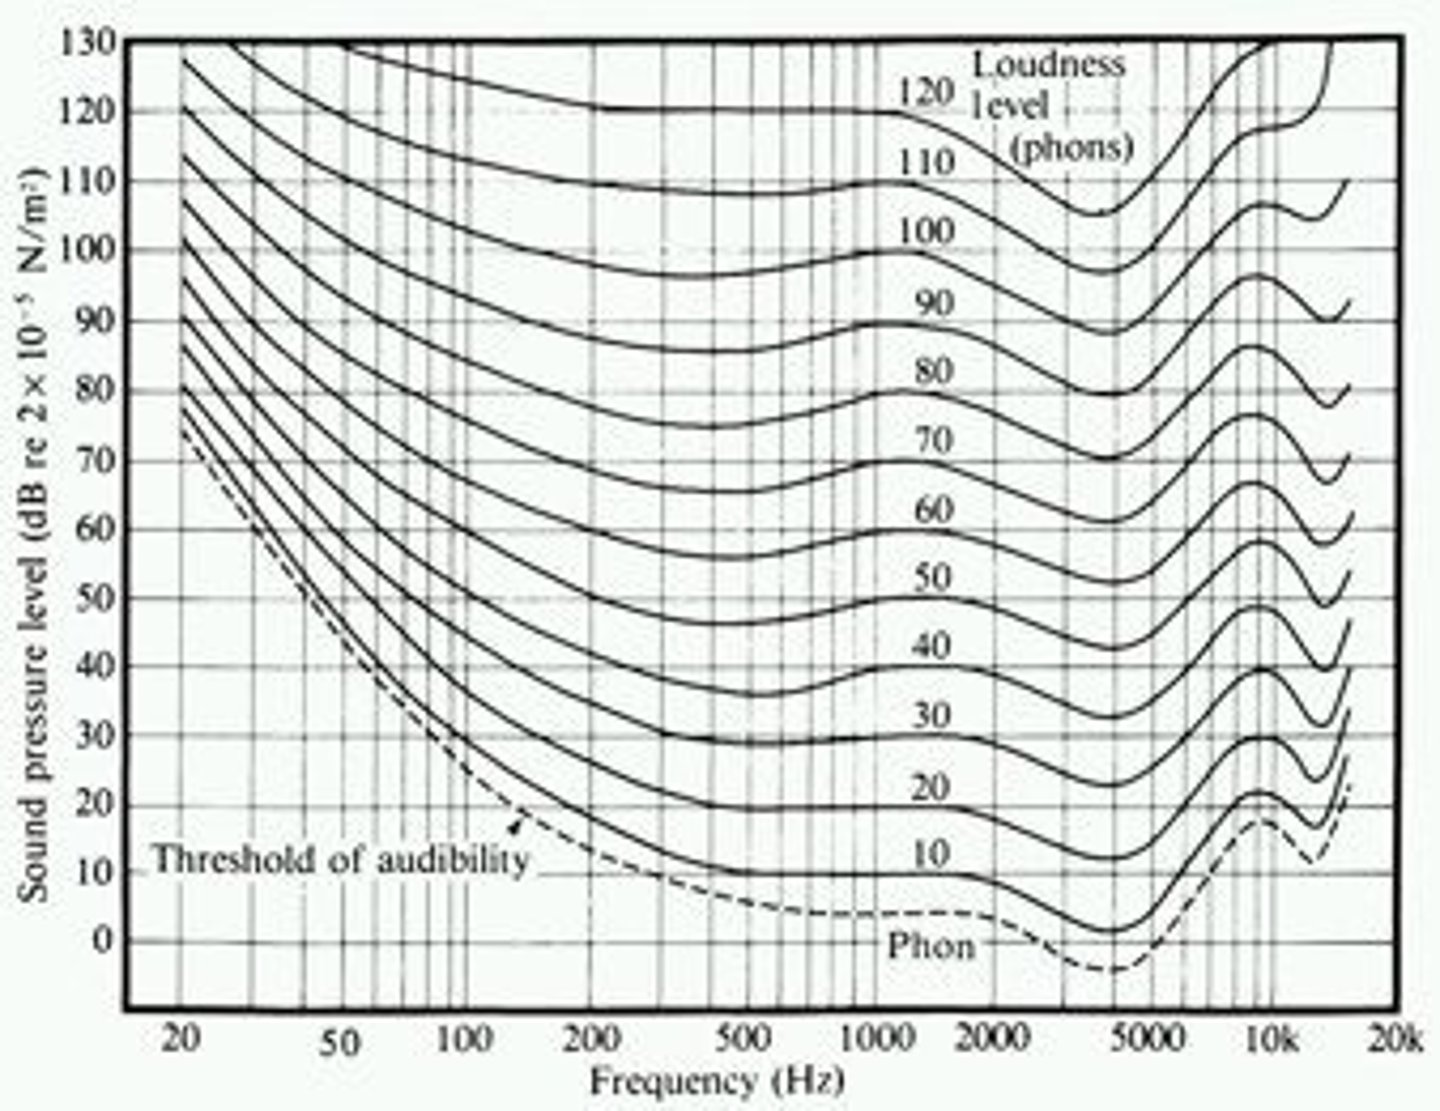
loudness growth function
describes how our perception of loudness changes as the intensity (level) of a sound increases
Scaling method
listeners are asked to scale the loudness level of the target sound relative to the loudness of the reference sound
scaling method reference sound
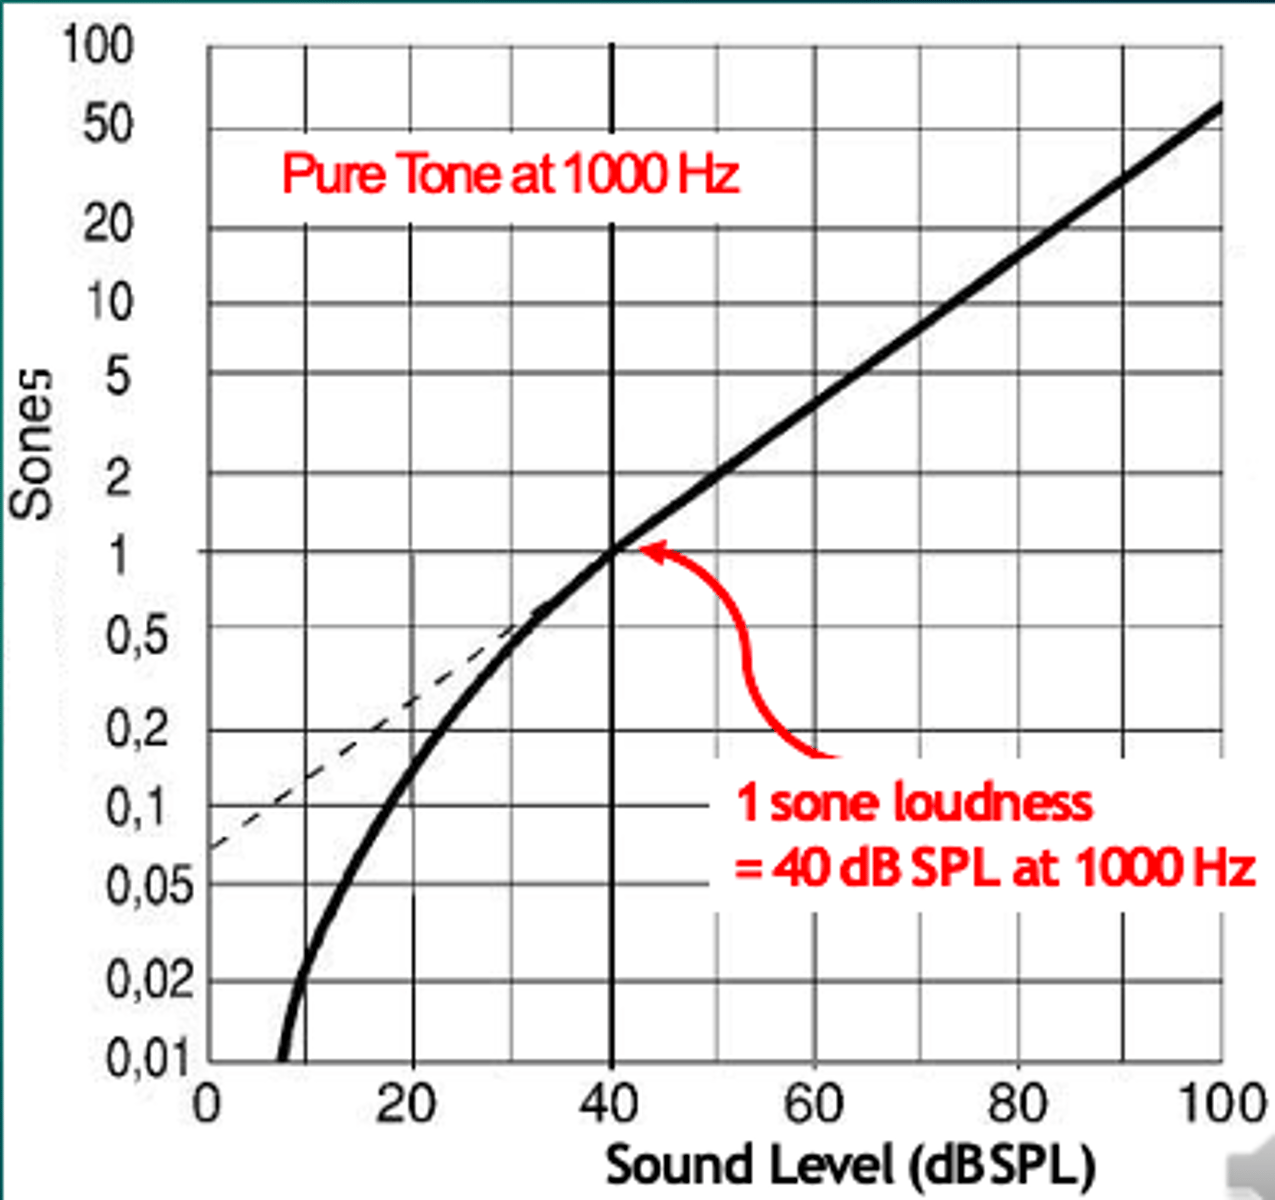
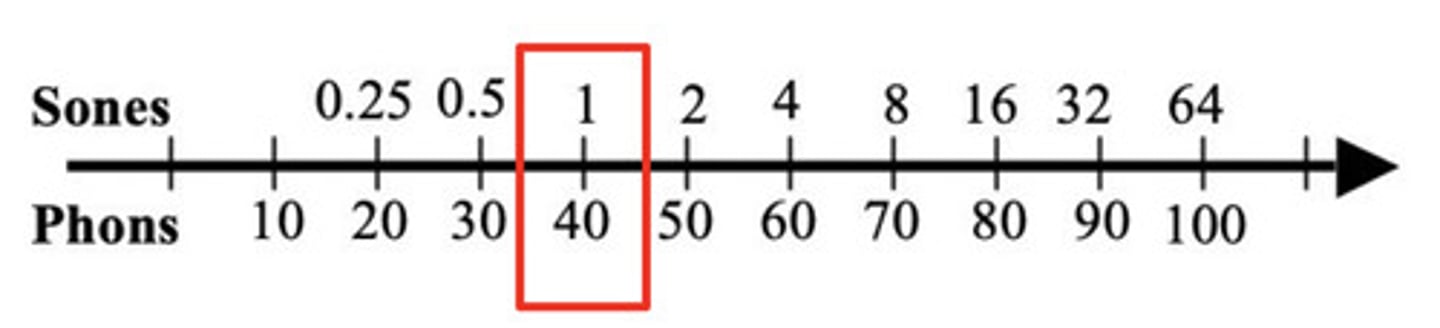
1 kHz tone at 40 dB SPL defined as 1 sone
sone
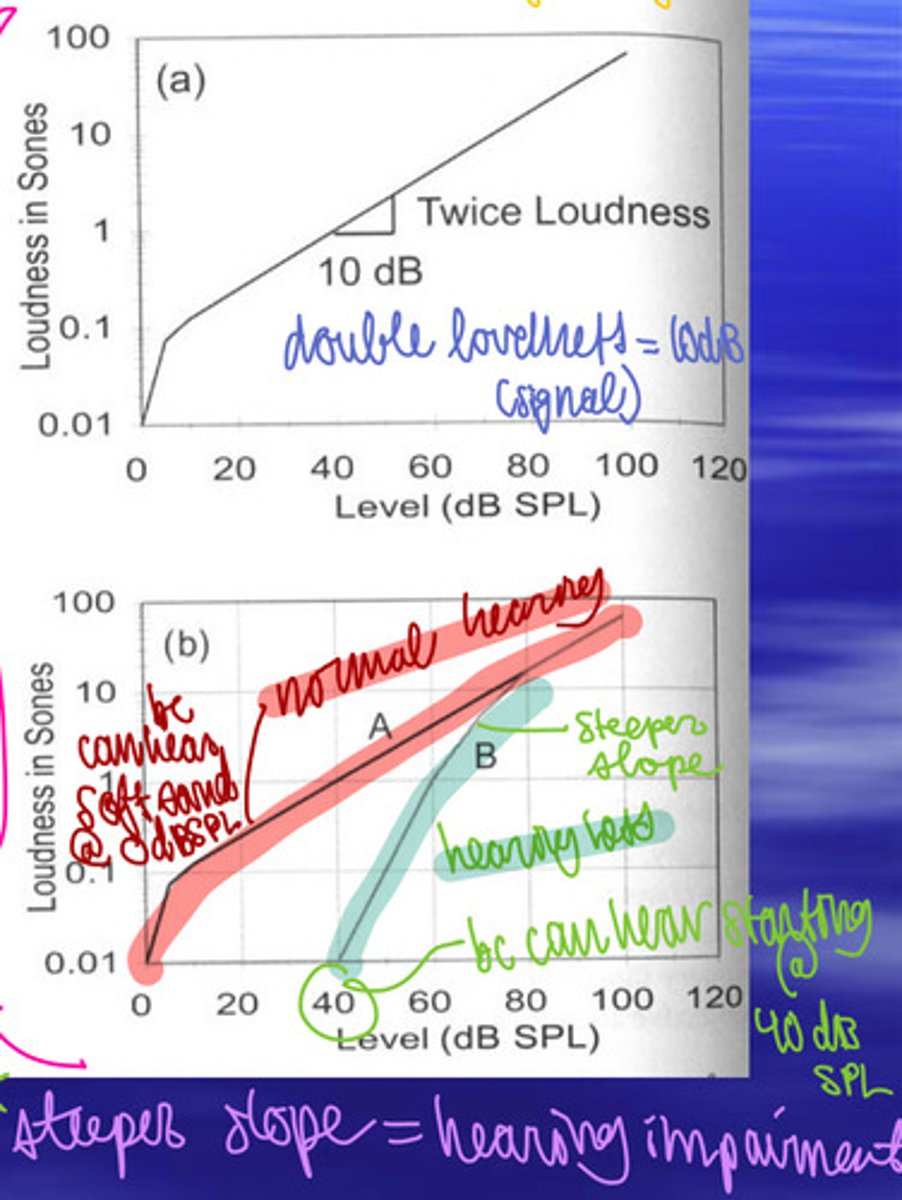
everytime you increase the sound db by 10 it will double the sone (40db →50db →60db = 1sone→2sone→4 sone)
loudness growth function
For sounds above 40 dB, loudness doubles when the sound level is increased by 10 dB
loudness recruitment
for those with hearing loss, the increase of volume is much steeper (increases of 10dB might be perceived as 8 times louder for someone with hearing loss)
factors affecting loudness
intensity, frequency, bandwidth, duration
loudness summation
the phenomenon where the perceived loudness of a sound increases when heard with both ears (binaural) compared to a single ear (monaural), or when the bandwidth of a sound stimulus is increased while its power is held constant (spectral)
pitch definition
attribute of auditory sensation in terms of which sounds may be ordered on a musical scale
how to measure pitch
matching and scale methods
pitch matching method
reference sound: a tonal sound
Listeners are asked to adjust the frequency of the reference sound to match the pitch of the target sound
pitch scaling method
Listeners are asked to scale the pitch value of the target sound relative to the pitch value of the reference sound (1 kHz)
pitch scaling method reference sound
1 kHz tone defined to have a pitch at 1000 mel
scaling method results are hard to measure due to
the complexity of pitch
pitch of complex sounds
- missing fundamentals - complex tones
listeners can perceive a pitch for complete tones that do not have any spectral components at the perceived pitch
two theories of complex sound pitch
envelope-periodicity theory (temporal periodicity) and spectral location theory
envelope periodicity theory
periodicity of the complex sound waveform
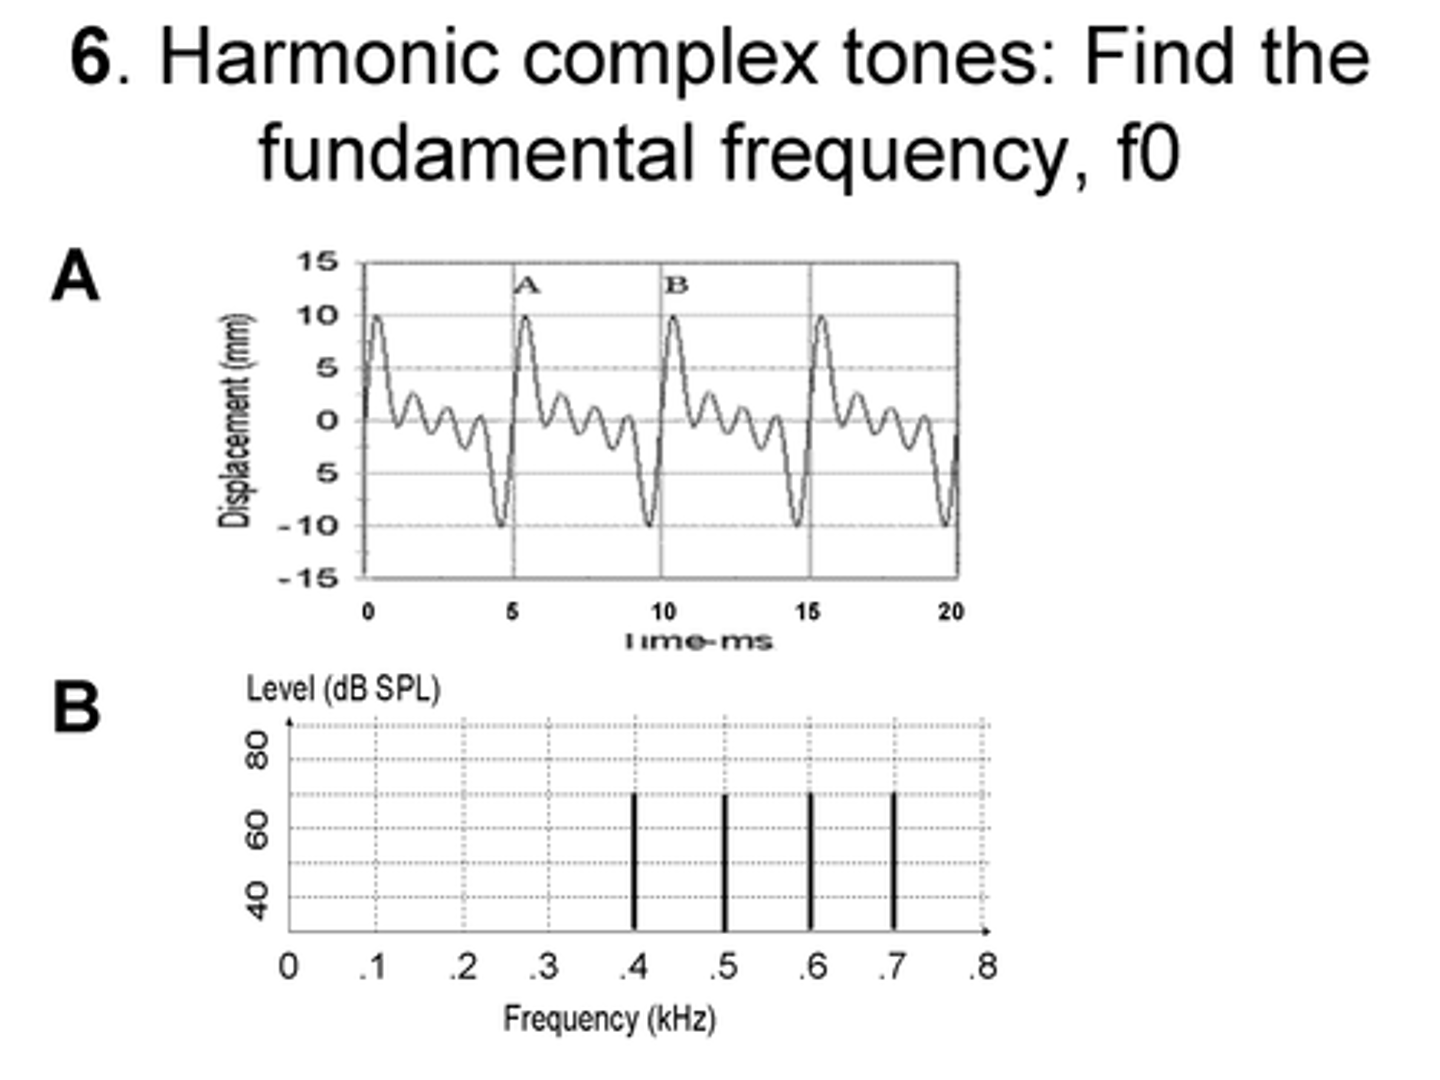
Spectral-location theory
spectral distance between tones
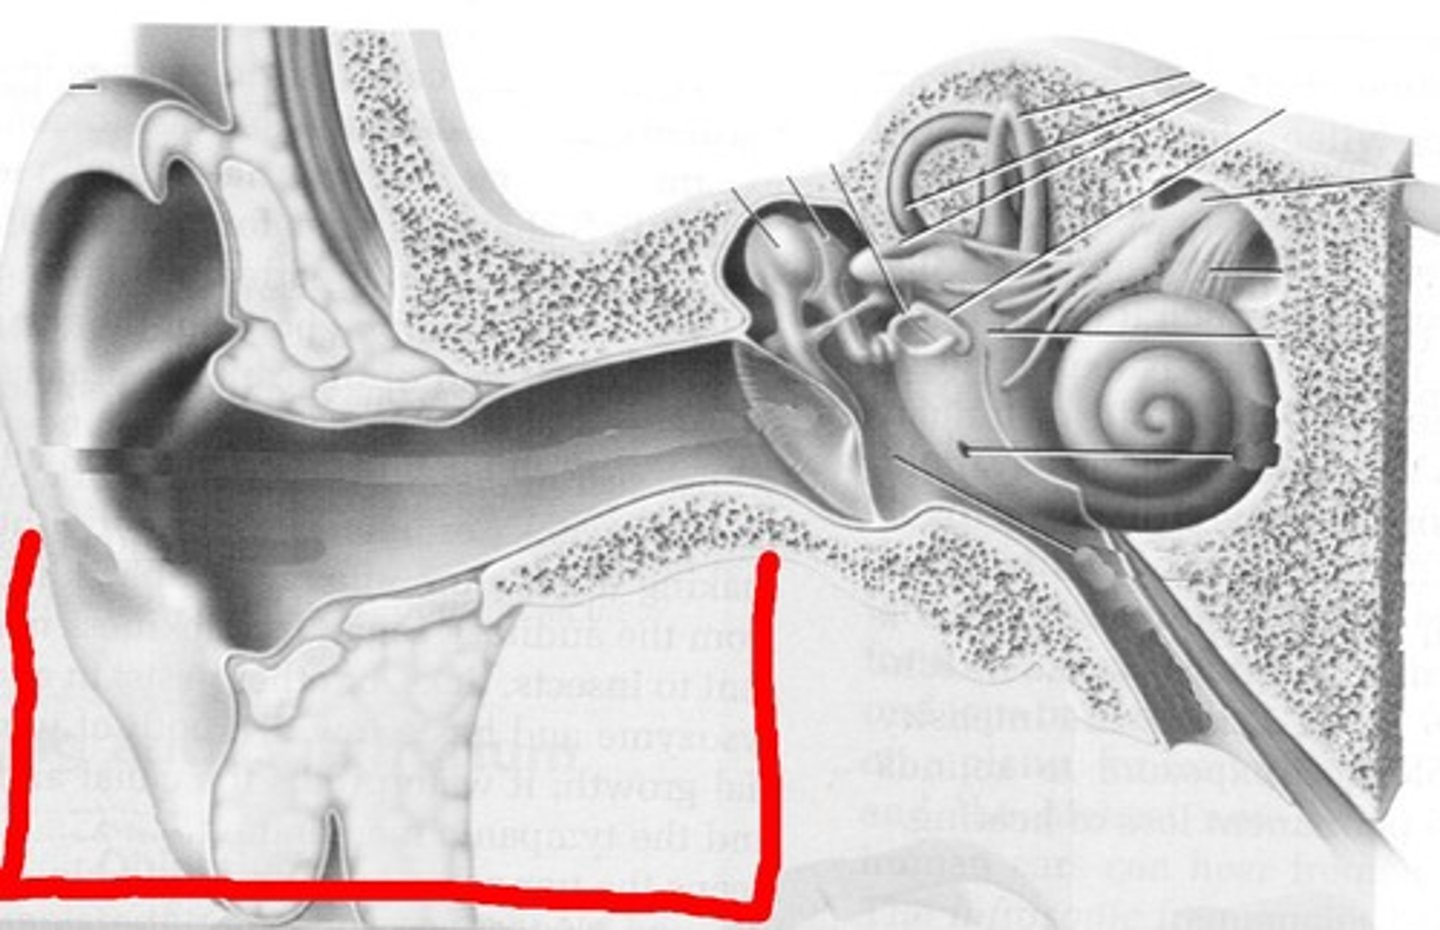
2 components of the auditory system
peripheral auditory system (outer, middle, inner ear)
central auditory system (auditory brainstem and auditory forebrain)
3 components of the peripheral auditory system
Outer ear, middle ear, and inner ear
Anatomy of the outer ear
pinna and external ear canal
Physiology of the outer ear (4 functions)
i. Collect sound
ii. Sound pressure gain (amply middle frequencies 1-5 kHz)
iii. Sound localization
iv. Protection of the tympanic membrane
Sound pressure gain
peaked around 2.5 kHz
primary contribution from the concha and the outer ear
This gain is crucial for hearing sensitivity in the speech frequency range.
What is sound localization?
The process by which the location of sound is determined.
What cues are used for localizing sound?
Intensity and phase (time) difference.
pinna anatomy
visable, cartiligenous part of the ear
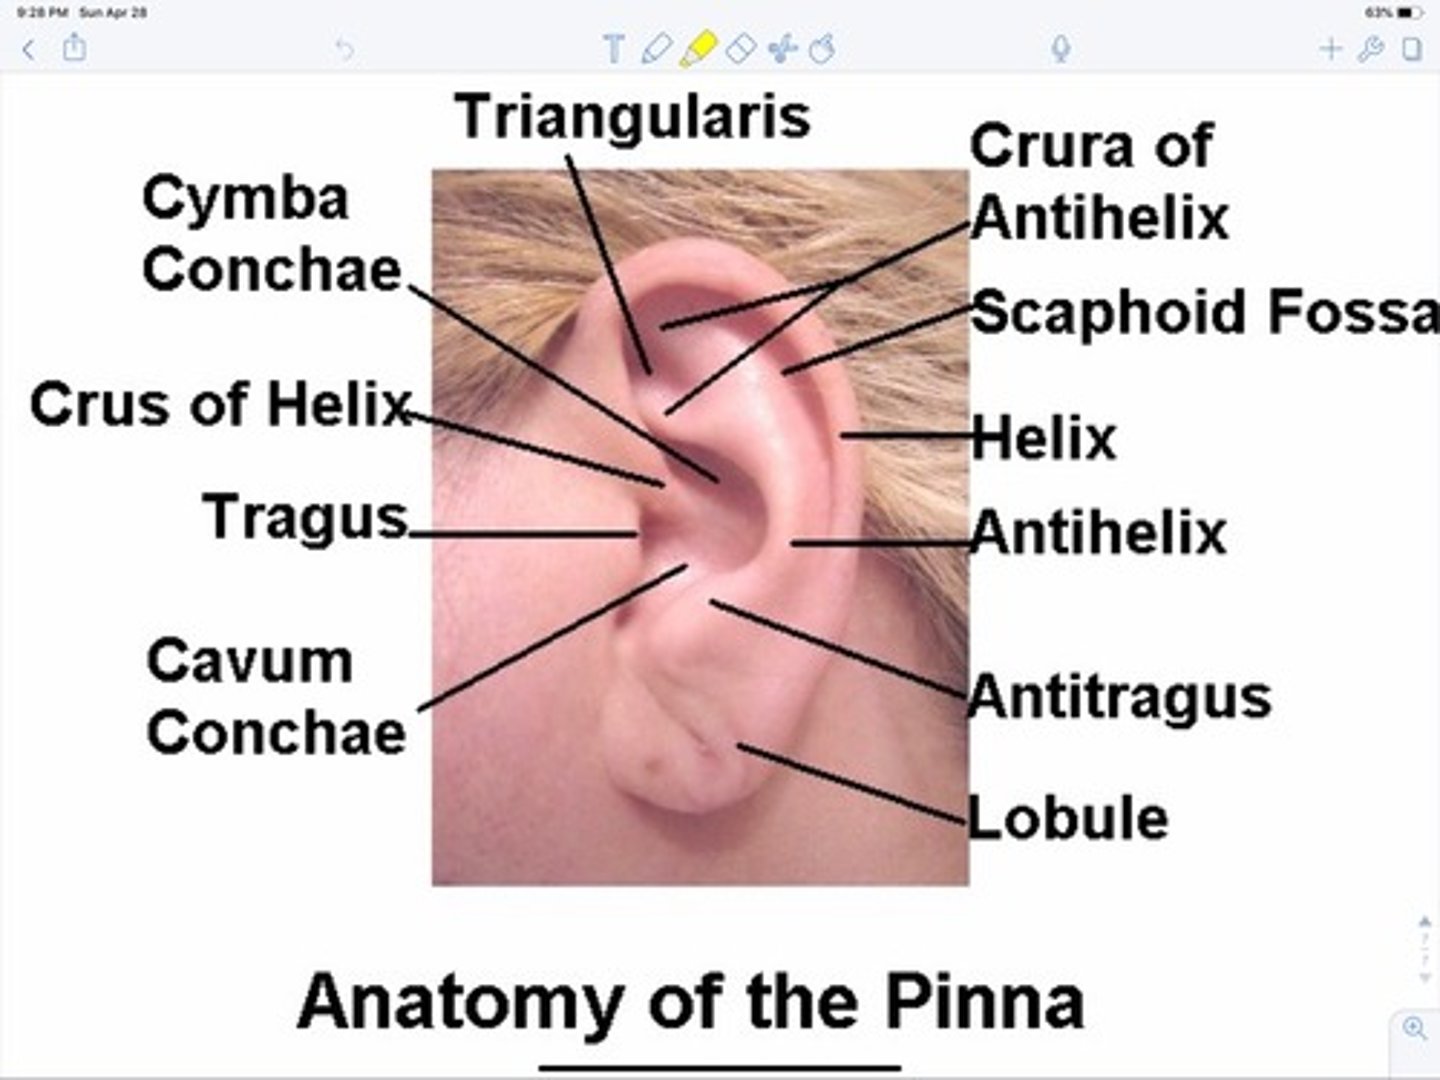
pinna physiology
sound localization in the midplane
acts as a funnel to direct sound waves towards the ear canal
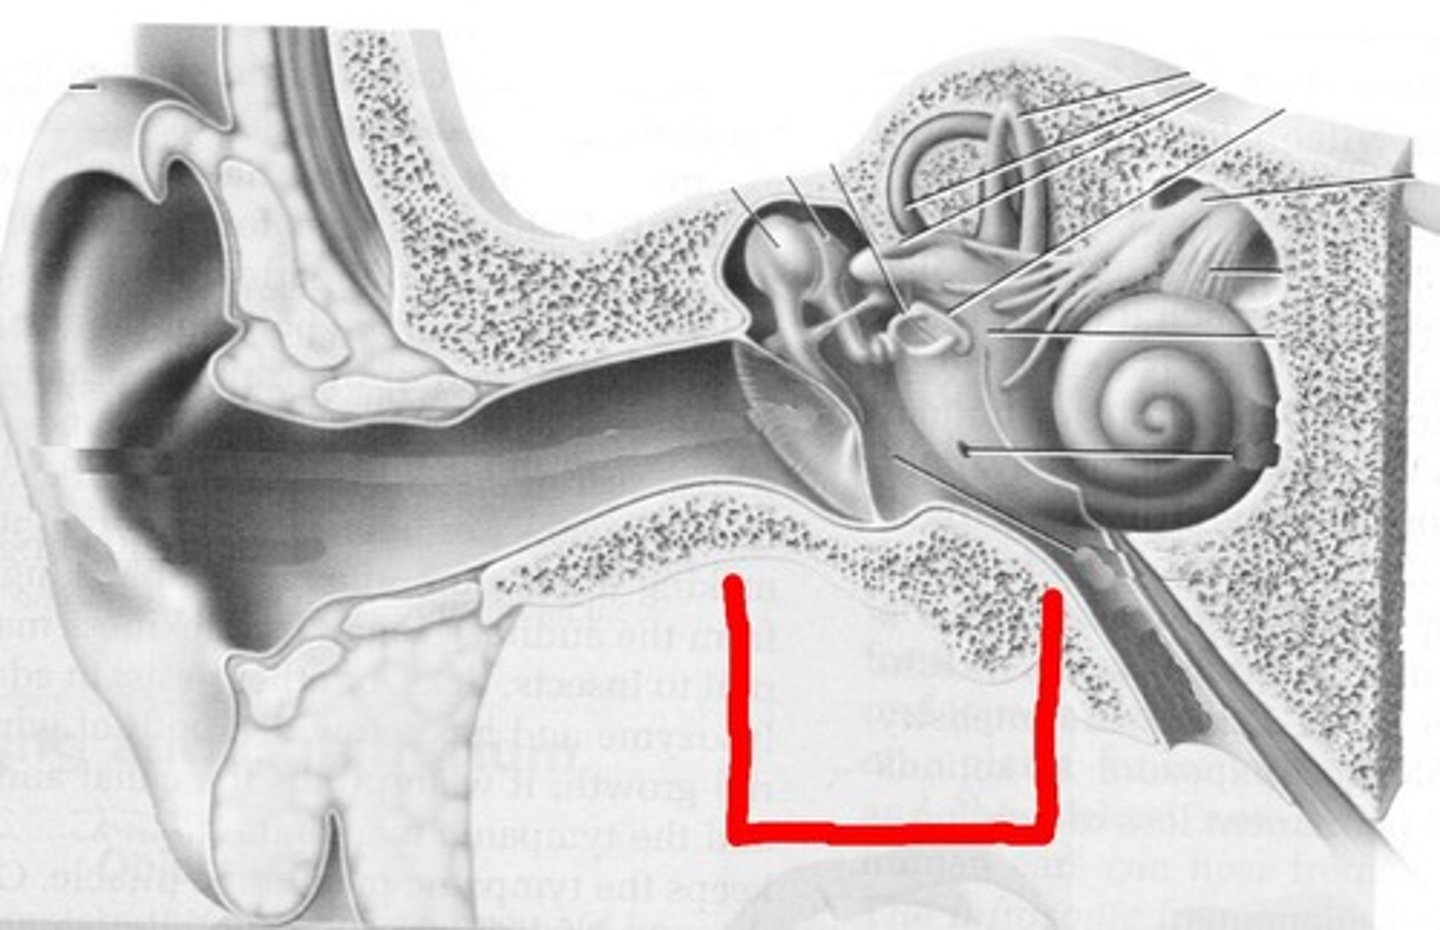
external ear canal anatomy
a tube leading to the eardrum
external ear canal physiology
Provides an acoustic resonance effect, leading to sound pressure gain (peaking around 2.5 kHz)
middle ear anatomy
tympanic membrane
tympanic muscles
auditory ossicles
eustachian tube
Middle Ear Physiology
sound transmission and protection of hearing
tympanic membrane anatomy
eardrum
tympanic membrane physiology
Transduces acoustic energy signals (air molecule vibration) into mechanical motion.
auditory ossicles anatomy
malleus, incus, stapes
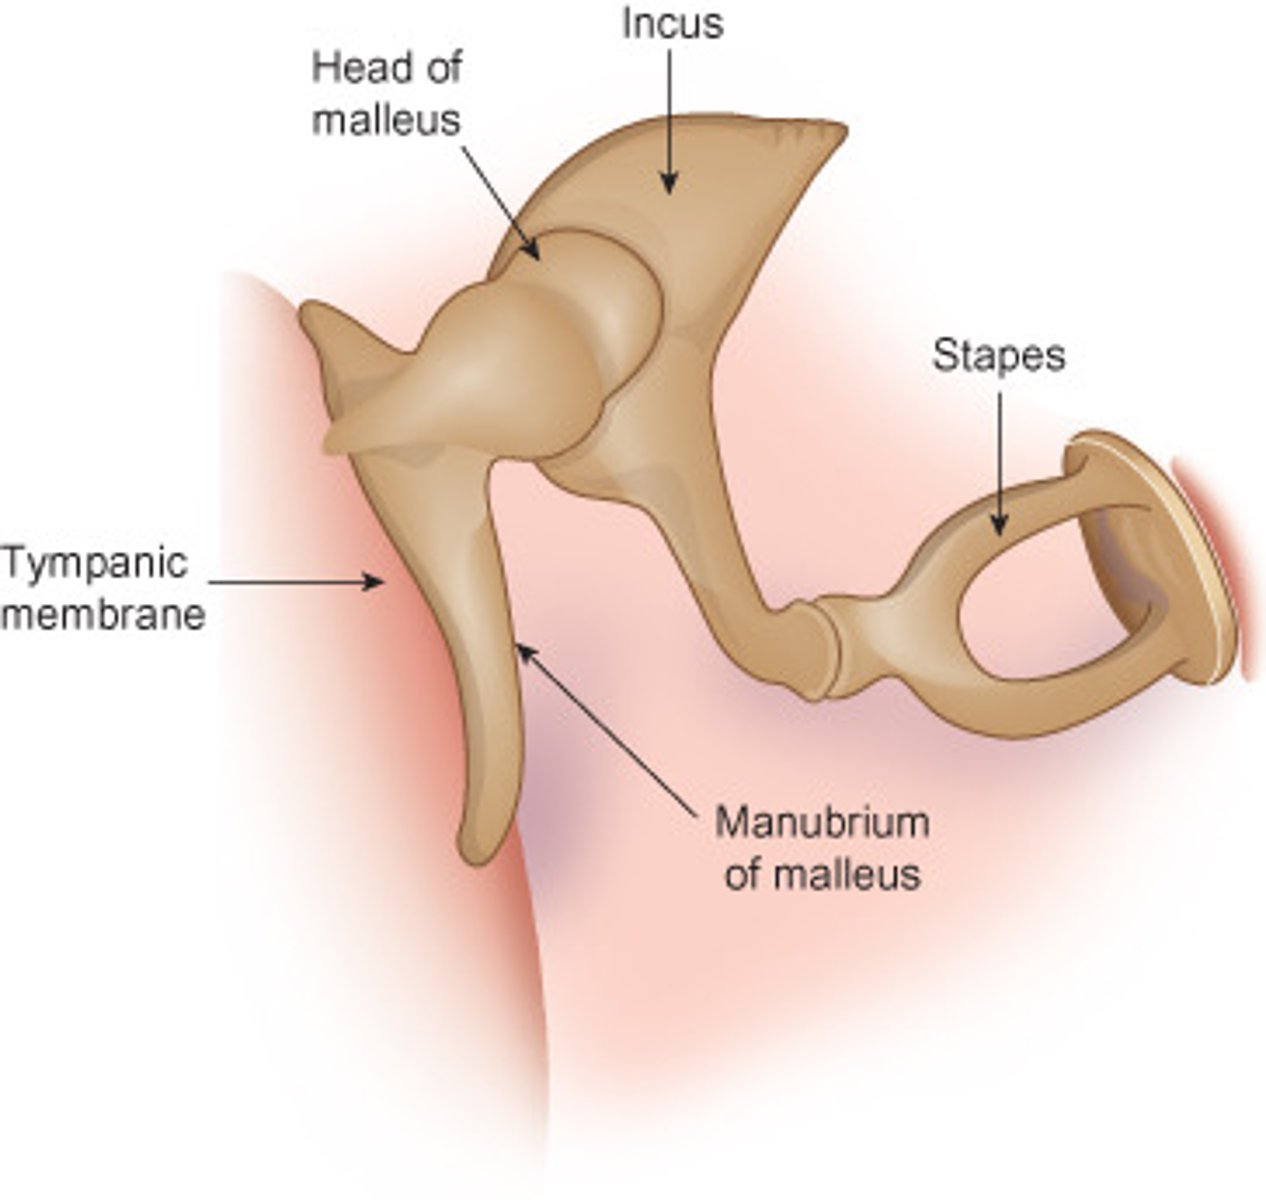
auditory ossicles physiology
Transduces the mechanical motion of the TM to fluid motion in the cochlea
Amplifies sound intensity across frequencies
At what frequency do the auditory ossicles provide peak amplification?
1000 Hz
How do the auditory ossicles transduce sound?
through transducing the mechanical motion of the ossicles to fluid motion in the cochlea (from the stapes moving in and out of the oval window)
Sound transfer functions of the middle ear
sound intensity amplified across frequencies with peaked amplification at 1000 Hz
Problem of sound transmission - What happens when vibration of sound wave transfers from the tympanic membrane in the air to fluid-filled cochlea?
Most of the acoustic energy will be reflected because the difference of acoustic impedance between the two sound media.
Solutions to the sound transmission problem
impedance mismatch problem - increase pressure/force at the oval window
sound mismatch issue
During the change between the ear drum and the fluid motion of the cochlea, the two mediums cause impedance mismatching. The sounds are mostly reflected (bouncing off an oval window).
Three mechanisms for impedance mismatch problem
area ratio, lever system, buckling of eardrum
Area Ratio (hydraulic affect)
Sound vibrates the large eardrum, but this force is concentrated onto the much smaller stapes footplate, greatly increasing pressure (approx. 18x gain)
lever system
The malleus and incus act as a lever, multiplying the force by about 2.1 times.
Buckling of ear drum
buckling motion increases the force transmitted to the middle ear's ossicles, effectively amplifying the sound pressure
acoustic reflexes
stapedius and tensor tympani (middle ear muscles) contract to lower sound transmission in the middle ear after receiving intense sounds
acoustic reflexes purpose
protects inner ear from intense sounds