graphs and evaluation2
1/38
There's no tags or description
Looks like no tags are added yet.
Name | Mastery | Learn | Test | Matching | Spaced | Call with Kai |
|---|
No analytics yet
Send a link to your students to track their progress
39 Terms
accurate
how close the measurement is to the true value
precise
the closeness of repeated measurements to each other
valid
The suitability of an experiment to truly answer the original scientific question
repeatable
when the same person does an experiment again and gets similar results
reproducible
when a different person follows a method and achieves the same findings
anomalous
A result that does not fit the pattern of the other data.
average
a value that represents a typical or central amount in a set of numbers
range bars
lines on a graph showing the highest and lowest values of repeats
evaluation
A critical look at an experiment to identify its strengths and weaknesses
hypothesis
A scientific explanation or prediction that can be tested through an investigation.
apparatus
The collective set of tools, equipment, or machinery needed for an experiment
method
A set of step-by-step instructions describing how to perform an investigation
reliable
the measurements and results are consistent and repeatable
confirmation bias
occurs when a scientist unintentionally ignores data that contradicts their original hypothesis
How can we define precise for a lone measurement
how specific, exact, or finely measured something is
independent variable
the variable you change
dependent variable
the variable you measure
continuous
a variable that can have any number value
discontinuous
a variable that is a word or group
discrete
a variable that has whole number values
control
what you keep the same
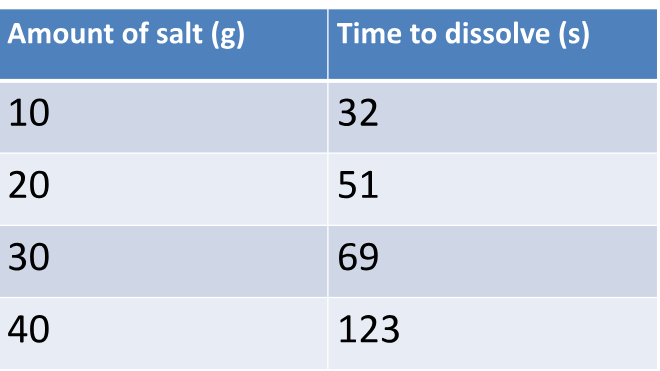
if the independent variable is a number you should draw…
a line graph
if the independent variable is a word i should draw…
a bar graph
the independent variable goes on the…
x- axis
the dependent variable goes on the..
y-axis
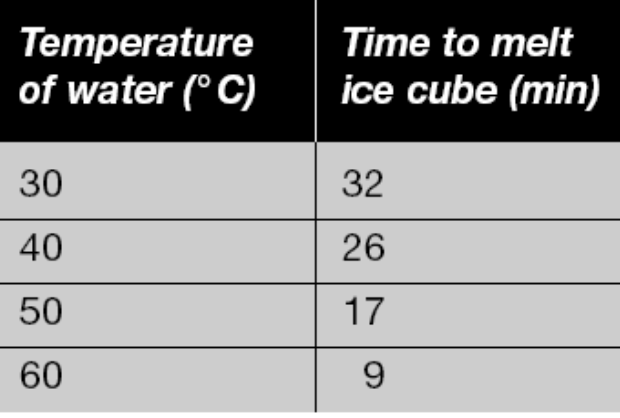
what graph?
line graph
what graph?
line graph
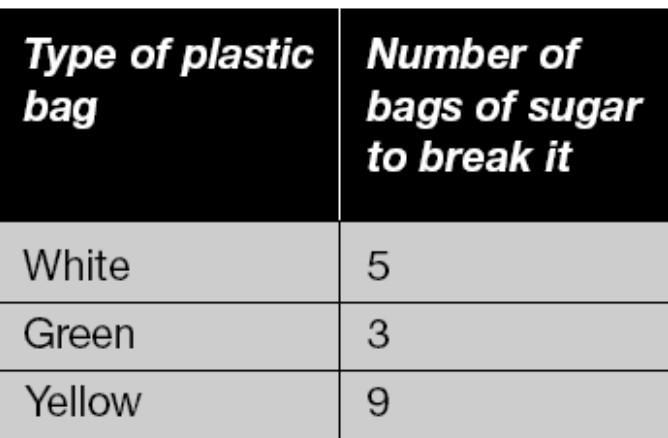
what graph?
bar graph
if the independent variable is a number then you should draw..
line graph
if your independent variable is a word you should draw..
bar graph
what does the line of best fit do?
It shows us the trend or pattern of our results
A line graph should be used when…
the independent and dependent variables are continuous
A bar graph should be used when..
when the independent variable is categoric
What are the components of a conclusion?
Describe the patterns, make a summary, was your prediction correct?Answer the question. Explain the conclusion- find science to explain the conclusion, could you extend? Evidence? Observation.How and why the evidence supports the claim. Comparing to other results.
what is correlation?
The relationship between two sets of data. Usually described as positive or negative.
what is positive correlation
as one variable increases, so does the other variable.
what is negative correlation?
as one variable increases, the other variable decreases.
what is no correlation
no connection between the two variables.