GEO 011 Midterm 2 Study Guide
1/92
There's no tags or description
Looks like no tags are added yet.
Name | Mastery | Learn | Test | Matching | Spaced | Call with Kai |
|---|
No analytics yet
Send a link to your students to track their progress
93 Terms
Will sea level rise happen everywhere over the globe?
No. While sea level is rising globally, some regions (like eastern Canada) see a relative drop. This is due to the slow rebound of the coastline as the Earth's crust rises after being weighed down by heavy ice sheets during the last ice age.
What is "climate sensitivity"?
amount of warming that we expect to occur when there is a change in the factors that control climate (e.g., an increase in GHGs).
- Expressed in terms of how much surface warming will
occur in response to a doubling of CO2 from
preindustrial levels (280 ppm)
What the best estimate of climate sensitivity?
3.0 degrees Celsius (5.4 F). The Earth will eventually warm by this amount if CO2 levels reach 560 ppm, which is expected to occur midway through the 21st century (though the full warming may not be realized until at least 2100 due to delayed ocean warming).
Accordingly to IPCC AR5, what is the range of climate sensitivity?
1.5 to 4.5 degrees Celsius
If CO2 doubles, what is our best estimate of how much the Earth will eventually warm?
A. 1°C
B. 2°C
C. 3°C
D. 4°C
E. 5°C
C. 3°C
Where do estimates of climate sensitivity come from?
Modern Observations: Comparing climate models to actual temperature changes over the last 160 years.
Proxy Data (Past Centuries): Using tree rings and ice cores to see how temperatures responded to natural factors like volcanic eruptions and solar changes.
Deep Time (Paleoclimate): Analyzing the Last Glacial Maximum and ancient geological records to see how Earth warmed or cooled when $CO_2$ levels were naturally higher or lower
What causes the delay in warming in response to a doubling of CO2?
caused by delayed ocean warming. Because the oceans are so vast and deep, they take much longer to heat up than the atmosphere, meaning the full temperature increase from greenhouse gases isn't felt for many decades.
Why are future projections of climate change uncertain? Or more specifically, what are the two main sources of uncertainty? What is meant by climate change uncertainty"? How can scientists draw certain conclusions?
The two sources are unknown future GHG emissions and uncertain climate response (how much the Earth warms from those emissions). Uncertainty means there is a range of possible outcomes—varying from mild to catastrophic—rather than one single predicted temperature.
Scientists rely on best-guess scenarios of fossil fuel use and the average projections of many different climate models.
How are sunspots related to solar intensity? In modern climate, are there more sunspots (a brighter sun) than those (that) in the Little Ice Age?
More sunspots = brighter sun/warmer
Fewer sunspots = less sun/less warm
There are more sunspots in the modern age than during the Maunder Minimum and Dalton Minimum eras
How was the Last Glacial Maximum (LGM) different than today? Why is the LGM cooler than today?
The LGM was 3-8°C colder, with sea levels significantly lower than today. It was cooler because GHG concentrations were much lower (CO2 was only ~50%), vast ice sheets covered North America and Europe (increasing reflectivity), and Earth’s orbital configuration reduced summer sunlight, preventing snow from melting.
How were atmospheric concentrations of greenhouse gases (GHGs) different during the LGM? Sea level? Ice sheets?
CO2 was at 180 ppm (half of what it is today), methane was about 1/5 what it is today, nitrous oxide about 1/3 what it is today.
The global sea level was 120m lower.
Ice sheets covered what is today Canada, northern USA, Scandinavia, and Europe and half of cooling during the LGM was due to ice sheet albedo (how much sunlight is reflected back into space by large masses of ice.)
How has CO2 varied over geologic time scales? Has it varied a lot, or a little?
CO2 has varied a lot, reaching levels as high as 1500 ppm (much higher than today). There was a carbon maximum 500 MYA, which fell 300 MYA at the height of the Permo-Carboniferous glaciations on Gondwana.
Then there was another maximum 175 MYA in the late Triassic period
What do fossil-fuel emissions scenarios consider?
They consider how human consumption of fossil fuels and land-use practices will evolve. The driving forces include population growth, per-capita energy demand, economic growth, and technological advances that can accelerate consumption or shift it to neutral sources.
Emissions Scenarios are Based on?
A. Population growth
B. Per capita energy demand
C. Economic growth
D. Technological advances
E. All of the above
E. All of the above
The recent "pause" in global warming is...
A. Related to human factors
B. Related to a series of La Niña events
C. Simulated by most model simulations
D. All of the above
D. All of the above
How are Representative Concentration Pathways (RCPs) defined? What is meant by a "business-as-usual" scenario? A conservation/mitigation scenario? What is RCP8.5? RCP2.6?
RCPs are defined by the total amount of warming (radiative forcing) by the year 2100. Business-as-usual (RCP 8.5) assumes a future of increasing fossil fuel use, while mitigation (RCP 2.6) assumes a major reduction in emissions. Uncertainty in these projections exists because we do not know future human behavior or exactly how sensitive the climate is to those gases.
What is the "faux pause"? Can it be simulated by most model simulations? What caused it? Is it truly indicative of a pause in global warming?
refers to a decade where temperatures didn’t rise as fast as before, leading to a false notion that global warming stopped. It is not simulated by most models because it was caused by natural factors like volcanic activity, a drop in solar output, and La Niña events. It is not a true pause because ocean heat and Arctic ice loss show warming is actually proceeding on or ahead of schedule.
Warming is Associated with _______ of the Hydrological Cycle, and this Includes ______ in Precipitation Intensity and _______ in Dry Spell Length for Many Regions
A. weakening/decreases/decreases
B. weakening/increases/increases
C. strengthening/increases/increases
D. strengthening/increases/decreases
E. none of the above
C. strengthening/increases/increases
All stabilization targets require sharp __________ in CO2 emissions following the peak, with the lower stabilization targets requiring ________ peak emissions
A. decreases/sooner
B. decreases/later
C. increases/sooner
D. increases/later
E. none of the above
A. decreases/sooner
How well did past IPCC projections do? Does IPCC overstate the effects of climate change?
Critics accuse the IPCC of overstating effects, but the opposite appears to be true. The IPCC has often understated changes; for example, the observed decline in Arctic sea ice is much larger than model projections. The 2012 minimum (a 60% drop) was reached decades earlier than the IPCC predicted it would happen.
Under RCP8.5, how much warming does IPCC project by 2100? Under RCP2.6? Note the warming magnitude relative to 2000 and relative to preindustrial.
Under RCP2.6 (conservative), warming is 0.2-1.8°C relative to 2000 (1.2-2.8°C relative to preindustrial). Under RCP8.5 (business-as-usual), warming is 2.5-4.6°C relative to 2000 (3.8-6.8°C relative to preindustrial). Even RCP2.6 only gives a 50-50 chance of staying below the 2.0°C preindustrial threshold.
Is the surface warming spatially uniform? What are the warming patterns and reasons?
No, warming is not uniform. The greatest warming occurs over Northern Hemisphere polar latitudes due to positive ice-melting feedbacks. Warming is greater over land than over the ocean because water warms more slowly. There is weak warming in the North Atlantic due to changing ocean currents (weakening Thermohaline Circulation).
Which continent will see the most warming?
North America has the potential to see the most warming
How is precipitation projected to change? Why?
Precipitation will shift due to changes in air circulation. Polar and sub-polar regions will see increased winter precipitation as jet streams shift poleward. The subtropics will see decreased precipitation due to the expansion of the Hadley cell. Meanwhile, a warmer atmosphere will cause increased precipitation near the equator.
How are floods and droughts projected to change? Why?
Both will become more frequent. Droughts will increase due to decreased summer precipitation combined with increased evaporation from warmer temperatures. Simultaneously, there will be more floods and intense rainfall because more evaporation leads to a more vigorous cycling of water through the atmosphere.
What is El Nino Southern Oscillation (ENSO)?
natural irregular oscillation of the climate system. It involves interrelated changes in sea surface temperatures (SSTs), ocean currents, and winds across the tropical Pacific.
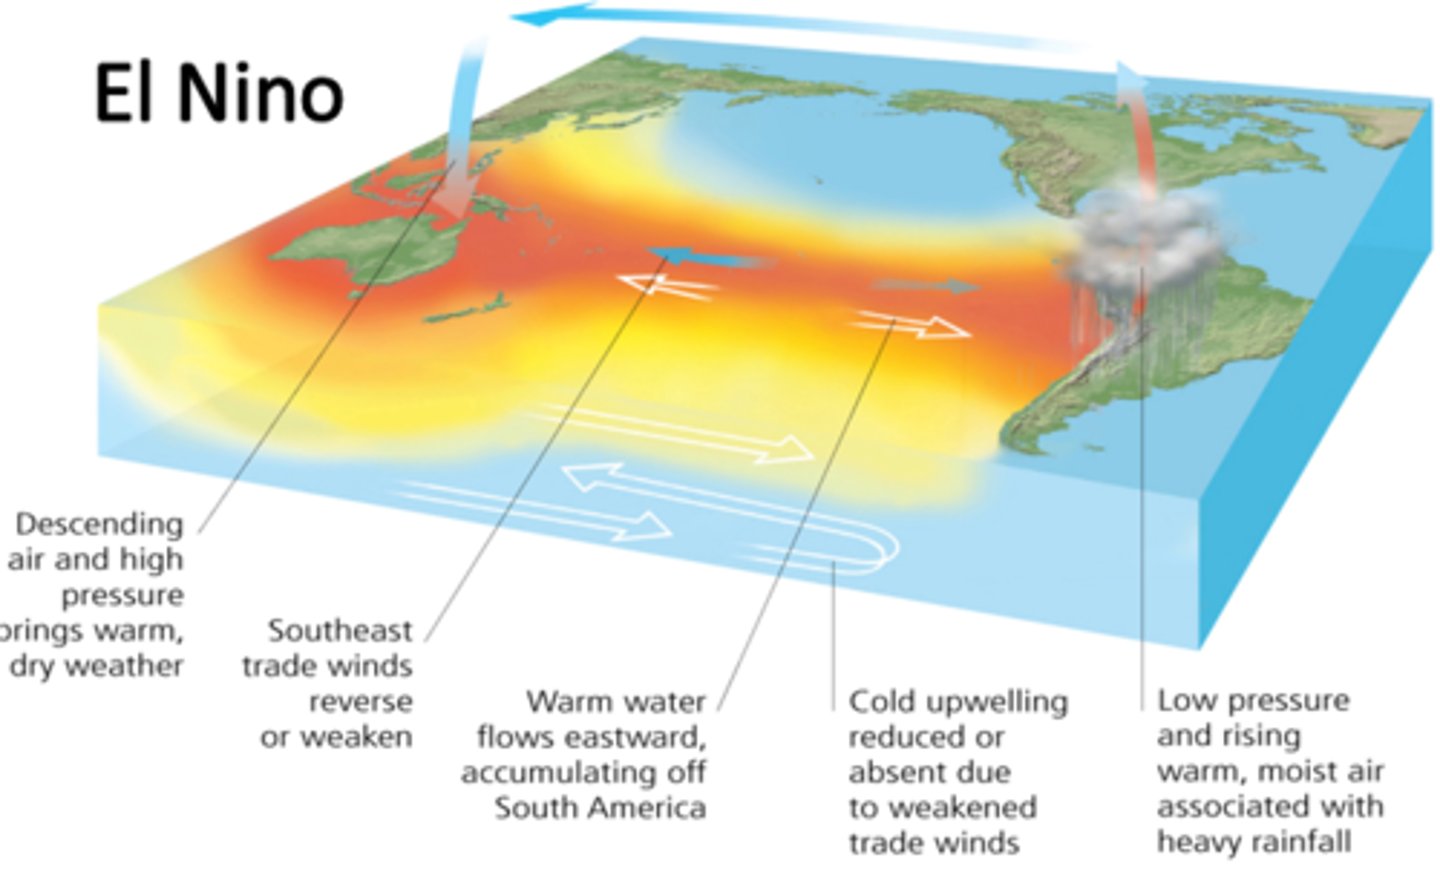
How does the tropical Pacific change during El Niño?
Southeast trade winds weaken or reverse, warm water flows eastward, accumulating at South American shores, and cold water upwelling is reduced due to weak winds. South America rains a lot.
How does the tropical Pacific change during La Niña?
Warm water accumulates around Australia, the southeast trade wind is far stronger than usual, upwelling of cold water, and cold sea surface temperatures in the eastern Pacific.
How long will it alternate between El Niño and La Niña?
It is an irregular oscillation that alternates between the two states every few years.
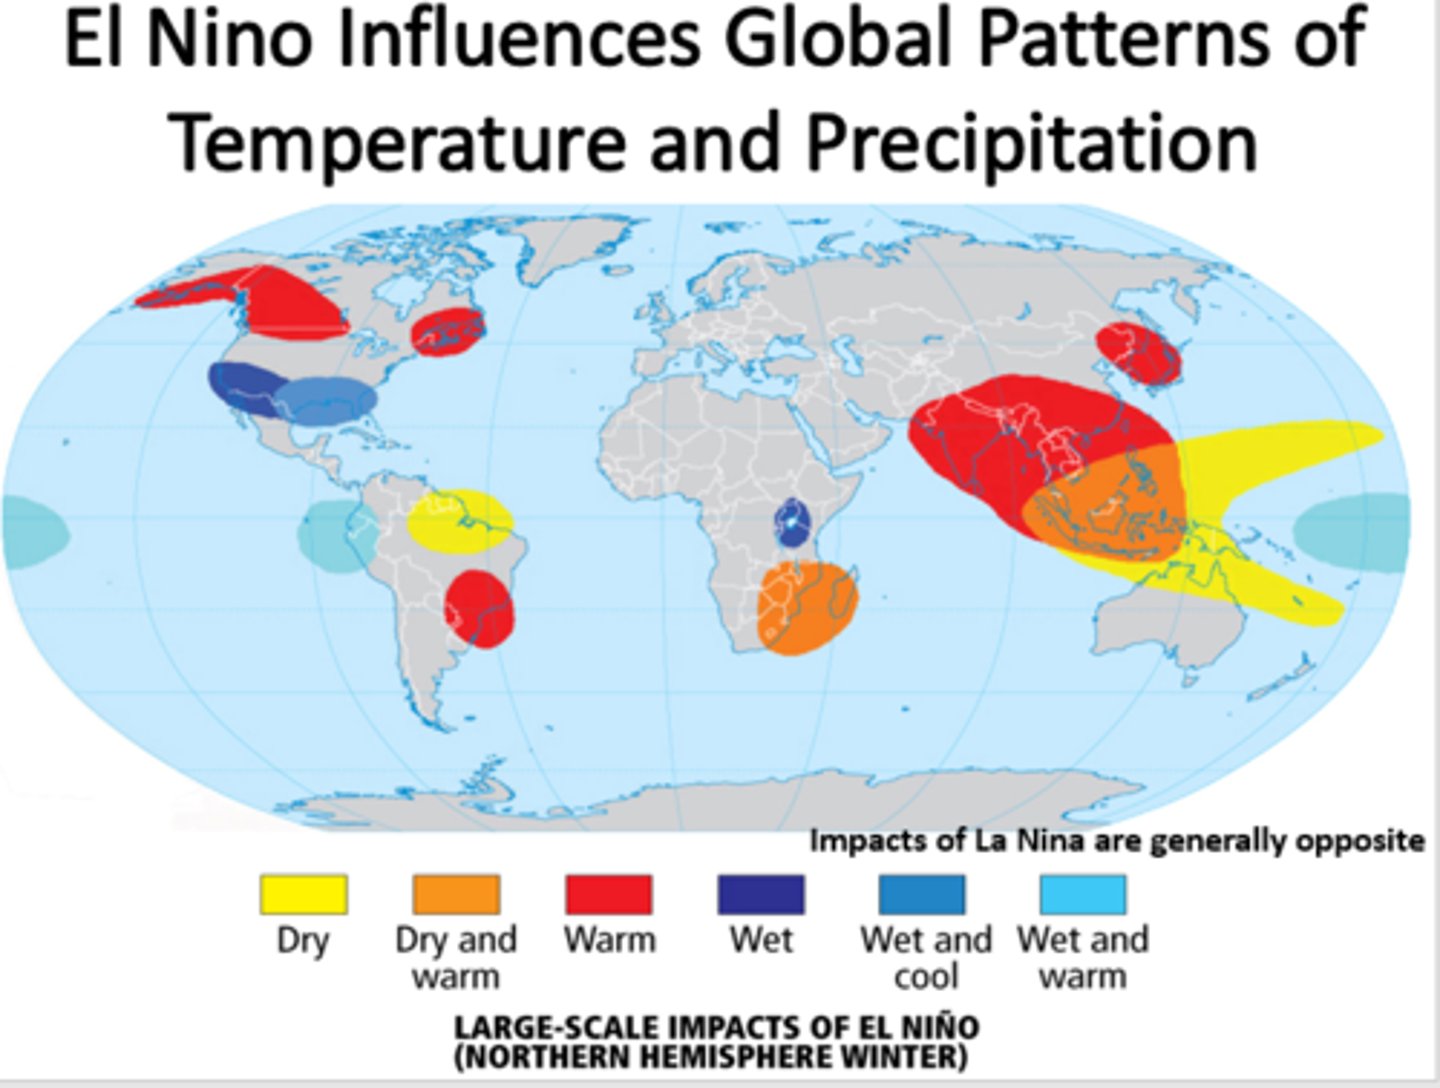
How will El Niño affect global patterns of temperature and precipitation?
the global average temperature increases. It causes significant shifts in weather, typically bringing wetter conditions to some regions (like the southern U.S.) and drier conditions/droughts to others (like Australia and Indonesia).
El Niño is associated with?
A. Weakening/reversal of the southeast
trade winds
B. Warmer water in the eastern
tropical Pacific
C. Reduction in cold upwelling off
coast of South America
D. Wetter conditions in the southern
United States
E. All of the above
E. All of the above
What are the characteristics of ENSO projections (climate overall? ENSO magnitude?) Are ENSO projections certain?
Projections are uncertain. Most models predict a more El Niño-like pattern, but there is an equal chance of an increase or decrease in ENSO magnitude. This uncertainty in winds and currents hampers precise regional climate projections.
What is a hysteresis loop? Be familiar with the case of ice sheets
A system with two stable states. If the climate warms past a threshold, changes (like ice sheet melting) become unstoppable. To restore the system, temperatures must drop substantially lower than where they started.
What are tipping points, and how are they related to "abrupt climate change"?
a threshold that, once passed, leads to rapid and irreversible changes. An example is West Antarctica, which may have already passed its tipping point; the ice has retreated off its seafloor ridge, removing friction and accelerating melting.
What are the main reservoirs of carbon and processes of carbon transfer in the carbon cycle? Is photosynthesis important?
Atmosphere, ocean, vegetation, soils, and detritus on land.
Carbon is moved through photosynthesis, respiration, ocean-atmosphere gas exchange, and ocean mixing.
Are photosynthesis and respiration important to the carbon cycle?
Yes. These are key biological processes used to transfer carbon between reservoirs. In diagrams of the carbon cycle, they are often represented by directional arrows showing the movement of CO2.
Does all of our CO2 emission stay in the atmosphere? If not, where does it go?
No. About 55% of the CO2 pumped into the atmosphere has “disappeared.” Much has dissolved into the ocean, and the rest was incorporated into living biomass via photosynthesis. Nature has responded to fossil fuel burning by reducing the human impact on climate, but we are beginning to push nature's limits.
What are positive feedbacks associated with the carbon cycle?
1. Land Biosphere Feedback: Warmer land -> increased growth and respiration of soil microorganisms -> carbon in soils becomes CO2 in the atmosphere
2. Ocean Carbon Cycle Feedback: A warmer ocean has less ability to absorb atmospheric CO2.
3. Biological Pump Feedback
- Loss of CaCO3 ballast (due to acidification) reduces the ocean’s ability to take up atmospheric CO2.
Ocean Circulation: Slowing of ocean circulation reduces the mixing of nutrients -> biological productivity slows and weakens the biological pump
Ocean carbon Feedbacks Include?
A. Warmer ocean -> absorbs less CO2
B. Ocean acidification -> reduces CaCO3 production -> absorbs more CO2
C. Ocean acidification -> reduces CaCO3 production -> weakens the biological pump -> absorbs less CO2
D. Decreased mixing of nutrients -> slows biological productivity -> weakens the biological pump -> absorbs less CO2
E. All of the above
E. All of the above
What are the negative feedbacks associated with the carbon cycle?
1. Land Biosphere Feedback: More CO2 -> plants absorb more CO2 -> more plants
2. Ocean Carbon Cycle Feedback: Ocean acidification reduces production of CaCO3 by organisms -> less CO2 production in the ocean -> more atmospheric CO2 absorption
3. Rock weathering
Which type of feedback dominates? What does this imply for future climate change?
Positive feedback prevails. This means warming is reducing nature’s ability to absorb atmospheric CO2.
The overall effect is a more rapid buildup of atmospheric CO2 and a warmer climate.
Be familiar with the seven types of carbon cycle feedback
1. Land Biosphere (+): Increased soil microorganism respiration.
2. Land Biosphere (-): CO2 Fertilization.
3. Ocean (+): Warmer ocean absorbs less CO2.
4. Ocean (-): Ocean acidification reduces CaCO3 production (increasing CO2 absorption).
5. Biological Pump (+): Loss of ballast reduces CO2 uptake.
6. Biological Pump (+): Slowing circulation/reduced nutrients weakens the pump.
7. Rock Weathering (-): Increased weathering removes atmospheric CO2
How is sea level projected to change by 2100? Why?
Sea level is predicted to rise between 0.5 and 1.2 m (1.6 and 3.9 ft) for two reasons:
Thermal Expansion: Water becomes less dense and expands as it warms, predicting a rise of 0.1-0.4 m (0.3-1.3 ft).
Melting of Continental Ice: Melting of mountain glaciers and permanent ice caps (not sea ice) adds ~0.5 m (1.6 ft).
How much will sea level rise with an eventual melting of Greenland / West Antarctic ice sheet?
While much uncertainty remains, the potential rise is significant:
Greenland ice sheet: 5-7 m (16-23 feet).
West Antarctic ice sheet: 5 m (16 ft).
What are some of the uncertainties associated with IPCC projections of future sea level rise
Models may underestimate sea level rise because they don't account for Crevices (Moulins). These fissures allow meltwater to penetrate deep into the ice sheet and lubricate the base, causing large pieces of ice to slide quickly into the ocean. This could lead to a far more rapid disintegration than currently predicted.
How does sea level rise affect land and Gross Domestic Product (GDP)?
ven a 1 m rise causes sizeable losses. These losses rise dramatically at 5 m (Greenland melt) and 10 m (West Antarctic melt), significantly impacting both available land and global GDP.
How is extreme weather projected to change?
As climate changes, it is likely that the frequency and intensity of extreme weather events will increase. These changes become more pronounced with more warming and vary regionally.
How are severe frosts projected to change?
The probability of frosts (nights below freezing) will decrease markedly. The greatest decrease is predicted for interior North America and Asia, where winters have traditionally been coldest.
How are heat waves projected to change?
are likely to become more intense, more frequent, and longer lasting. The greatest increases are predicted for the western US, North Africa, and the Middle East, where decreased soil moisture intensifies summer warmth.
How will intense rainfall events and flooding change?
Frequency will increase due to a more vigorous water cycle and more moisture in a warmer atmosphere. Even in regions becoming drier, individual rain/snow events will be more intense, separated by longer dry spells.
How will dry spells and droughts change?
For many regions, longer dry spells will separate intense precipitation events. This is due to a strengthening of the hydrological cycle, leading to increases in both precipitation intensity and dry spell length.
How are hurricanes projected to change?
Warmer sea surface temperatures (SSTs) are likely to fuel more intense hurricanes (Cat 4-5) with stronger winds. Combined with sea level rise, this creates a “double whammy” for damaging storm surges
Warming is Associated with _______ of the
Hydrological Cycle, and this Includes ______ in
Precipitation Intensity and _______ in Dry Spell
Length for Many Regions
A. weakening/decreases/decreases
B. weakening/increases/increases
C. strengthening/increases/increases
D. strengthening/increases/decreases
E. none of the above
C. strengthening/increases/increases
Under the Higher Emission Scenarios, the rate of Climate Change __________ the
Natural Migration Capacities of Most Plants and Animals.
A. Is smaller than
B. Is larger than
C. Equals
D. None of the above
B. Is larger than
All stabilization targets require sharp
__________ in CO2 emissions following
the peak, with the lower stabilization
targets requiring ________ peak
emissions
A. decreases/sooner
B. decreases/later
C. increases/sooner
D. increases/later
E. none of the above
A. decreases / sooner
What are required to achieve lower stabilization targets? To stabilize CO2 level at 450, 550, 750 ppm, by what year do we need to reach the emission peak?
We need sooner peak CO2 emissions followed by a sharp reduction of emissions afterwards.
450 ppm: 2020
550 ppm: 2040
750 ppm: 2080
Under climate change, what are the threats to coastal and low-lying regions (e.g., Bangladesh, Southern Florida, Netherlands)?
Rising sea levels, coastal erosion, and increased cyclone destruction threaten the 10% of the global population in low-lying areas, risking the total submergence of places like Southern Florida, Bangladesh, and the Netherlands.
With 6 meters of sea level rise, will most of New York City be submerged?
es. Most of New York City and Boston would be submerged with a 6 m rise. Even the current 0.3 m (1 ft) rise increased Hurricane Sandy's flooding by 65 km^2
What will be human loss in the coastal regions that are even not inundated by higher sea level?
Non-submerged regions will still face loss of human life, population displacement, and damage to infrastructure. This is driven by more intense storm surges, increased erosion, and saltwater intrusion that ruins freshwater supplies and water quality.
How does global warming affect air pollution? Why?
Warming increases tropospheric ozone (smog) by accelerating chemical reactions and causing air stagnation. This leads to respiratory illness and an estimated 20,000 extra deaths per 1°C of warming.
What is an ecosystem?
An interdependent community of living organisms and their environment, forming a complex whole usually defined by climate boundaries.
List ecosystem boundaries delineated by climate.
Desert, subtropics, tropical rain forest, ecosystems near equator, tundras (near the poles)
Why are ecosystems valuable?
Provides resources: Physical goods like food, wood, fiber, and medicine.
Environmental Regulation: Climate control, water purification, and protection from natural disasters/pests.
Cultural Benefits: Recreational activities and the appreciation of/interaction with nature.
How does climate change affect ecosystems? Biodiversity?
Climate change is affecting the climate faster than ecosystems can adapt, pushing ecosystem resilience, and may cause us to lose biodiversity
Human activity is already pushing ecosystem resilience and may lead to species extinction. If they cannot adapt or migrate fast enough.
According to the IPCC, what is the most vulnerable ecosystem? Why?
Coral reefs are the most vulnerable marine ecosystem with little scope for adaptation, as NOAA estimates 20% are damaged beyond recovery, and 50% are at risk of collapse. Loss of coral reefs from most sites is very likely by 2050.
Causes of coral decline
• Natural Stressors:
- Disease, predation, and overgrowth by damaging algae
• Human Activities:
- Overfishing, pollutant runoff from land, careless snorkelers
walking on delicate coral, fuel spills, fuel, and wastewater
discharge from boats, oil spills
What is "coral bleaching"?
The loss of algae that live in a symbiotic relationship with the coral & give it color —is linked to exceptionally hot ocean temperatures. Human-induced global warming will contribute to this.
Why are coral reefs and wetlands important?
important because they protect against natural disasters (floods, cyclones, tsunamis), filter pollutants from water, support immense biodiversity, and provide food and billions in tourism income.
Besides coral, what other animal species will be at particular risk of extinction under continued climate change?
Amphibians (like the extinct Golden Toad) are threatened by drying cloud forests and the chytrid fungus, while polar bears face starvation due to the loss of sea ice needed for hunting seals. ( particular stress on females who need to nurse during the winter).
Alo birds and reptiles are affected.
As the climate warms, trade winds rise up mountain slopes and condense at higher elevations, so the clouds no longer intersect with the forest floor, and forests are drier and nights are warmer.
As the climate has changed in the geologic past, ecosystems (plants, animals, microscopic organisms, etc.) have shifted in response. How is past climate change different from the projected future changes?
Past changes were slower, giving species time to shift; current human-induced change is so rapid it pushes ecosystem resilience to the limit, risking extinction for species that cannot migrate or adapt fast enough to avoid being "stranded."
How does the speed of past vs. future climate change impact species' migration rates?
Unlike slower past shifts, projected future change happens faster than most species can migrate—especially across flat areas (less mountains) where climate zones move most rapidly—risking ecosystem collapse.
What percentage of plant and animal species are at risk of extinction under 2 degrees Celsius vs 4 degrees Celsius of warming?
At 2 degrees Celsius of warming, 20–30% of species face increased extinction risk; at 4 degrees Celsius, the risk jumps to 40–70%, representing an irreversible loss of biodiversity.
What are MPAs? Are they effective at reducing fish and coral loss?
Marine Protected Areas (MPAs) are regions that restrict human activity for conservation; they are proven effective at staving off (preventing) coral and fish losses while providing great economic benefits.
Can MPA's protect coral from global warming? Ocean acidification? If not, then what needs to be done?
No, MPAs stop local stressors like overfishing but cannot prevent ocean warming or acidification caused by CO2 (which forms carbonic acid, stopping skeleton growth). To prevent total coral collapse, we must reduce/eliminate CO2 emissions or use carbon sequestration, as the biosphere has already absorbed 50% of human emissions.
How does climate change stress human societies regarding water pollution?
Warmer water, intense rainfall, and low river flows exacerbate pollution. This leads to more frequent toxic algae blooms (like the 2014 Lake Erie event that left 500,000 without tap water) and puts intense pressure on freshwater supplies as urbanization and population grow.
How does climate change stress human societies regarding fresh water supplies?
It creates unreliable supplies through shifting rain belts and melting glaciers (which 15% of the population depends on). It also increases water pollution (like toxic algae) and threatens energy resources by decreasing the water flow needed for hydroelectric and nuclear cooling.
How does climate change stress human societies regarding human health?
Climate change causes disproportionate illness and death among poor nations, children, and the elderly who lack infrastructure (AC/healthcare) to handle heatwaves, malnutrition from drought, and disease or PTSD from floods. While cold-related deaths decrease, all regions are warming—especially the Northwest—increasing overall risks from extreme weather and pollution.
What will happen when nations exceed their capacity to adapt to climate change?
A "perfect storm" of 9 billion people and dwindling water, land, and food resources will trigger violence and destabilization, leading to unprecedented levels of conflict both within nations and between them.
How might climate change affect environmental refuges? Why?
They are people fleeing homelands made inhospitable by sea-level rise, drought, and agricultural failure. With 25 million already displaced (e.g., the Sahel, India, China), this competition for habitable land affects everyone—even industrialized nations like the U.S. (e.g., Hurricane Katrina).
With modest warming (1-3 degrees Celsius), how will food production change by region? What happens at > 3 degrees Celsius?
Modest 1-3 degrees Celsius Global production may increase; high latitudes (US, Europe, Canada) benefit from longer seasons and CO2 fertilization, while tropical regions face immediate losses. High (>3 degrees Celcius) Negative impacts hit all major agricultural regions, worsened by forest fires, pests, and weakened ocean circulation (Thermohaline) affecting fisheries.
How does socioeconomic development affect the risk of famine by 2080?
Development can partially or completely offset food supply losses; however, under current "business-as-usual" paths, the number of undernourished people could soar to 1.3 billion (up from 820M). Socioeconomic success determines if that number drops to 100M or leads to a global food crisis.
How does climate change affect the spread of diseases like Malaria, Dengue, and West Nile Virus?
Climate change lifts temperature barriers, allowing vectors (mosquitoes, ticks, and rodents) to expand their range into higher latitudes and altitudes. Warmer extratropical regions allow mosquitoes to thrive and spread infectious diseases further than before, while also lengthening the pollen season for allergens like ragweed.
Are the health impacts associated with climate change uniformly distributed across the globe? Who is more susceptible? Why?
No, impacts are unequal. Poor nations are most susceptible due to inadequate access to AC, clean water, electricity, and healthcare. Within all countries, the children, elderly, urban poor, and coastal residents suffer disproportionately because they lack the resources or physical resilience to adapt to climate stresses.
How large are the rates of Arctic and landmasses in the Arctic of warming?
The Arctic is warming at twice (2x) the global rate, while landmasses in the Arctic are warming at five times (5x) the global rate. This rapid heating is accelerated by the loss of sea ice and snow, which exposes dark surfaces that absorb more solar radiation.
What is the projected change in Arctic sea ice?
Under the high-emission scenario (RCP8.5), the Arctic Ocean is projected to be ice-free in September later this century. Even under the low-emission scenario (RCP2.6), the smallest projected change is a 43% decline in year-round sea ice cover.
The impacts (polar bear, new northern coastlines for North American and Eurasian nations, new sea routes for international trade)?
Polar Bears: Loss of sea ice forces bears to land before rebuilding fat, threatening nursing females and cubs with starvation.
New Coastlines: North American and Eurasian nations must defend newly exposed northern borders as the Arctic Ocean opens.
Trade: The Northwest Passage opens, creating new international sea routes connecting the North Pacific and North Atlantic.
What is permafrost?
The permanently frozen soil is located below the Arctic’s upper layer of soil. It serves as a solid and impervious base for human settlements, supporting building foundations, roadbeds, and pipelines, while also containing sewage ponds and landfill leachate.
How is permafrost expected to change in a warmer world?
It is melting rapidly. By 2100, Northern Hemisphere permafrost is projected to be reduced by 37% (under RCP2.6) or as much as 81% (under RCP8.5). This process is expected to release up to 250 billion metric tons of carbon into the atmosphere.
What are the impacts of permafrost melting?
Infrastructure: Leads to bridge collapse, pipeline breakage, and roadway degradation.
Environment: Contamination of surrounding areas via the release of sewage and landfill leachate (water that collects contaminants as it trickles through waste).
Climate: Release of methane CH4 and CO2 trapped for millennia, which increases global warming.
Coastal and low-lying regions are particularly vulnerable to climate change because of
A. rising sea level
B. increased hurricane
destruction
C. increased coastal erosion
D. larger wave heights
E. all of the above
E. all of the above
Which of the Following are True Regarding Marine Protected Areas?
A. they restrict human activity for a conservation purpose
B. they protect natural or cultural resources
C. they can protect against ocean acidification
D. A+B
E. A+C
D. A+B
Under the Higher Emission Scenarios, the Rate of Climate Change_______the Natural Migration Capacities of Most Plants and Animals.
A. Is smaller than
B. Is larger than
C. Equals
D. None of the above
B. Is larger than
Food Production is Expected to _________ With Modest Warming (<3°C) in Some Regions (US, Europe, Canada), But _________ With More Warming (>3°C).
A. Increase/increase
B. Increase/decrease
C. Decrease/decrease
D. Decrease/increase
E. None of the above
B. Increase/decrease