OMIS 324 Exam 3 Study Guide
1/29
There's no tags or description
Looks like no tags are added yet.
Name | Mastery | Learn | Test | Matching | Spaced | Call with Kai |
|---|
No analytics yet
Send a link to your students to track their progress
30 Terms
Numpy
numerical python
- Core library for numerical computing in python
- Provides fast operations on large, multi-dimensional arrays
- Foundation of many data science libraries (pandas, scikit-kearn, etc)
- Foundation of many data science libraries
Sampling
makes analysis faster and more manageable
Statistical summary
helps us understand data quickly and objectively without looking at every individual observation
Measures of location
mean, median, mode
Measures of dispersion
variance, standard deviation
Measures of shape
skewness
Measures of association
correlation
Mean
Average, (it is sensitive to outliers [extreme values])
- Ex: df[“Income”].mean()
Median
Middle value when the data is arranged from least to greatest. Not sensitive to outliers
- Ex: df[“Income”].median()
Mode
most frequent value in dataset. Not sensitive to outliers
df.[“Income”].mode()
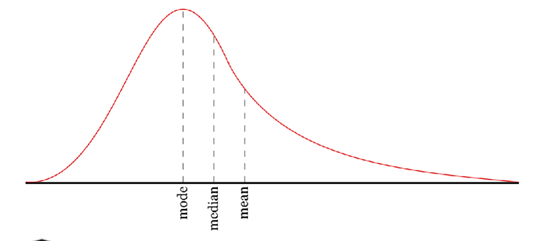
Mean, median, mode order
Variance
Measure variability / risk (spread from mean)
- Small variance -> data points are close to the mean
- Large variance -> data points are widely spread out
- Ex: df[“Income”].var()
Standard deviation
square root of the variance. Typical deviation from mean (risk measure)
- Ex: df[“Income”].std()
Variance / standard deviation is commonly used
to measure risk since variance measures risk by quantifying how much actual outcomes deviate from the expected return
Skewness
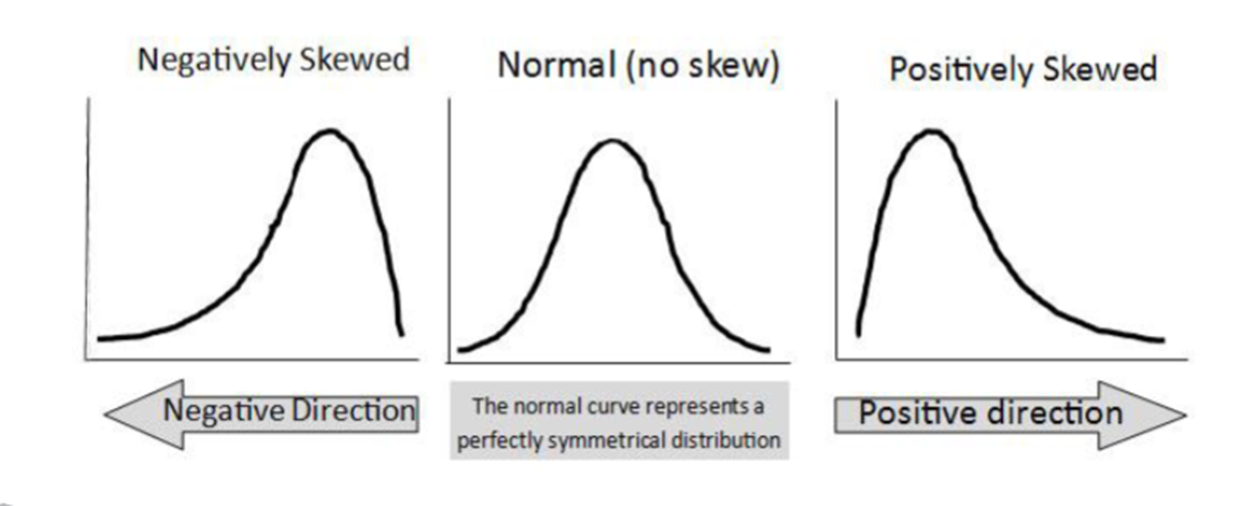
measures the asymmetry of a distribution. It tells us whether data is tilted more to the left (negative) or to the right (positive)
- Ex: df[“Income”].skew()
Correlation
(Two Vars) measures the strength and direction of the relationship between two variables.
df['col1'].corr(df['col2'])
- Ex: df[“Income”].corr(df[“YearsofExperience”])
Pd.crosstab()
pandas function used to create a cross tabulation (contingency table). It shows the frequency (count) of combinations between two or more categorical variables
groupby() -
method in Pandas used to:
Split the data into groups based on one or more categorical variables
Apply a function to each group
Then combine the results
Summarize data by groups (e.g., average by category) df.groupby(‘group_col’)[‘value_col’].mean()
Reinforcement learning
learn from the data environment using rewards and errors
Cross Tabulation
(Frequency Table) Generate count matrix for combinations of categorical variables • pd.crosstab(df['row_var'], df['col_var’]) • pd.crosstab([df['row_var1'], df['row_var2']], df['col_var'])
Artificial intelligence
any technique that enables computers to mimic human intelligence. It includes machine learning
Machine learning
a subset of AI that includes techniques that enable machines to improve tasks with experience. It includes deep learning
Parts of machine learning
Supervised learning - develop predictive models: output values are specified
Regression
Classification
Unsupervised learning- group and interpret data based only on input data
Clustering
Association rule mining
Anomaly detection
Reinforcement learning - learn from the data environment using rewards and errors
Deep learning
a subset of machine learning based on neural networks that permit a machine to train itself to perform a task
Supervised learning
develop predictive models: output values are specified
Labeled data (dependent variable y is known)
Use existing data for prediction
Unsupervised learning
group and interpret data based only on input data
Unlabeled data (there is no dependent variable y)
Describe existing data, find patterns
Linear regression -
a tool for building mathematical and statistical models that characterize relationships between a dependent (y) (ratio) variable and one or more independent or explanatory variables (x) (ratio or categorical) all of which are numerical
Simple linear regression
involves a single independent variable
Y = β0 + β1X1
Multiple linear regression
involves two or more independent variables
Y = B0 + β1X1 + β2X2 + … + βkXk
Market value
a + b * square feet
Numerous possible lines could pass through the data points
We want to determine the best regression line