7 - Basic ECG Review
1/40
Earn XP
Description and Tags
Info from 'Clinical Assessment in Respiratory Care' 9th edition
Name | Mastery | Learn | Test | Matching | Spaced | Call with Kai |
|---|
No analytics yet
Send a link to your students to track their progress
41 Terms
indications for ECGs
cardiac disorders (MI, ventricular hypotrophy, dysrhythmias)
pre-op as screening tool
pacemaker sites
sinoatrial (SA) node (60-100 bpm)
atrioventricular (AV) junction: AV node + bundle of His (40-60 bpm)
bundle branches (30-40 bpm)
Purkinje fibers (30-40 bpm)
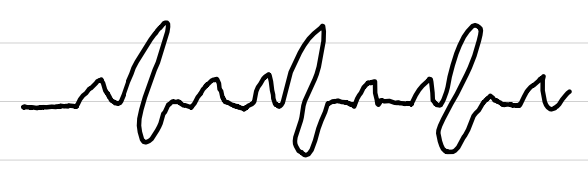
P wave
[1]
little bump on ECG that represents atrial depolarization; sudden loss of negative charge in polarized cells (K+ out, Na+ in)
![<p>[1]</p><p>little bump on ECG that represents atrial depolarization; sudden loss of negative charge in polarized cells (K<sup>+</sup> out, Na<sup>+</sup> in)</p>](https://knowt-user-attachments.s3.amazonaws.com/ca5cd164-b4c9-4b65-ad5a-16ae919733dc.png)
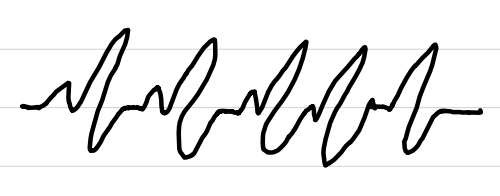
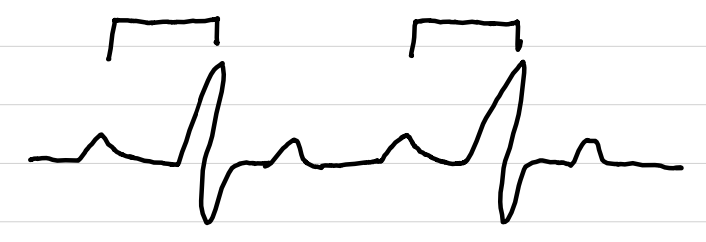
PR interval
[1+2]
section on ECG from beginning of P wave to beginning of QRS complex; represents delay of AV node to allow filling of ventricles
![<p>[1+2]</p><p>section on ECG from beginning of P wave to beginning of QRS complex; represents delay of AV node to allow filling of ventricles</p>](https://knowt-user-attachments.s3.amazonaws.com/e5235009-2448-4b34-b7df-c80cfab65d4d.png)
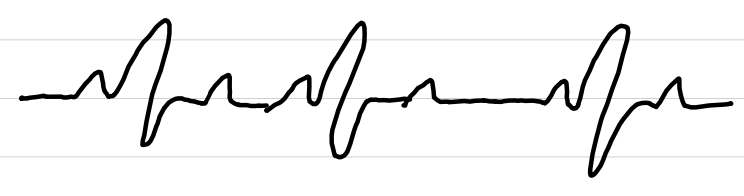
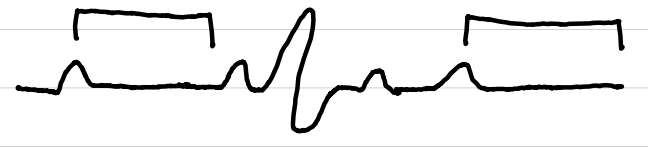
QRS complex
[3]
jagged line on ECG that represents ventricular depolarization
![<p>[3]</p><p>jagged line on ECG that represents ventricular depolarization</p>](https://knowt-user-attachments.s3.amazonaws.com/de8844d3-b1a8-4e7e-850f-05bbd84ba86b.png)
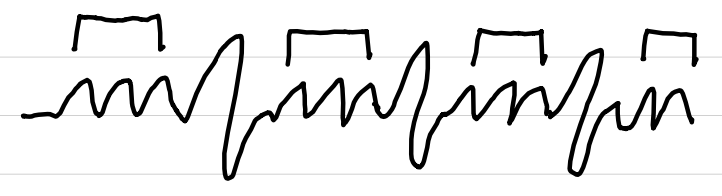
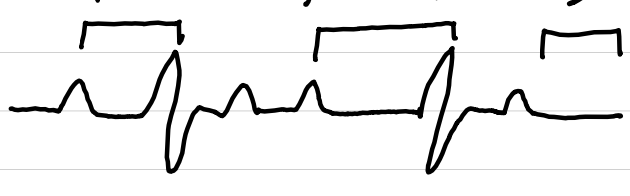
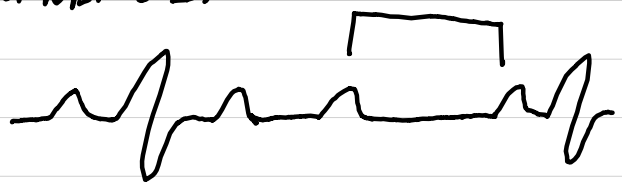
ST segment
[4]
section on ECG from end of QRS complex to beginning of T wave; represents beginning of ventricular repolarization
![<p>[4]</p><p>section on ECG from end of QRS complex to beginning of T wave; represents beginning of ventricular repolarization</p>](https://knowt-user-attachments.s3.amazonaws.com/96c1d5ac-f8ab-4583-baea-4c4312c578d5.png)
T wave
[5]
big bump on ECG that represents ventricular repolarization (Na+ out, K+ in)
![<p>[5]</p><p>big bump on ECG that represents ventricular repolarization (Na<sup>+</sup> out, K<sup>+</sup> in)</p>](https://knowt-user-attachments.s3.amazonaws.com/885c3e12-62f6-4783-b50d-76bc71831ac7.png)
length of time for 5 consecutive big boxes on ECG strip
1 second
length of time for one big box on ECG strip
0.20 seconds
length of time for one small box on ECG strip
0.04 seconds
6-second method
method of counting rate on ECG strip if HR is irregular
count number of QRS complexes in 6-second strip
multiply number by 10
large boxes method
method of counting rate on ECG strip if HR is regular
count number of large boxes (0.2 sec each) between QRS complexes
divide number into 300 (300 ÷ x) to find ventricular rate
repeat above for atrial rate using P waves
small boxes method
method for counting rate on ECG strip if HR is regular
count number of small boxes (0.04 sec each) between QRS complexes
divide number into 1500 (1500 ÷ x) to find ventricular rate
repeat above for atrial rate using P waves
ECG leads
6 limb leads
4 electrodes
I, II, III, aVR, aVL, aVF
view heart on frontal plane to find axis
6 chest leads
6 electrodes
V1-V6
view heart on horizontal plane
overlie right ventricle (V1-V2), ventricular septum (V3-V4), left ventricle (V5-V6)
3- and 5-lead placement
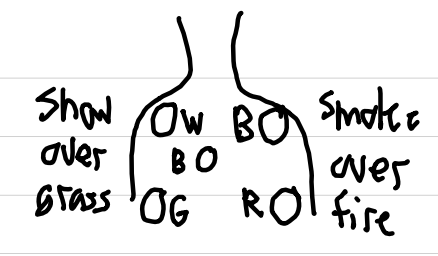
white → RA
right arm / right upper chest below right clavicle
black → LA
left arm / left upper chest below left clavicle
red → LL
left leg / left lower chest above and left of umbilicus
green → RL
right leg / right lower chest above and right of umbilicus
brown → any precordial lead
4th intercostal space, right sternal border
white, black, red = I, II, III
all = I, II, III, aVR, aVL, aVF, V
normal direction of QRS axis
left and down (→↓) and -35° to +90°
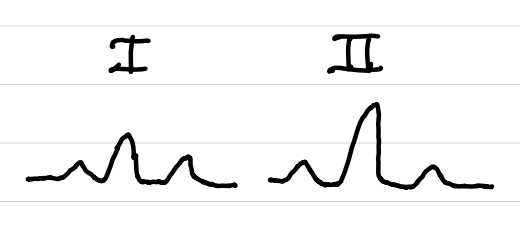
axis determination
I positive, II positive → normal
I positive, II negative → left deviation
I negative, II positive → right deviation
I negative, II negative → extreme right deviation
causes of right axis deviation
left ventricular infarction
right ventricular hypertrophy
chronic obstructive lung disease
acute pulmonary embolism
infants ≤ 1 year old (normal)
biventricular hypertrophy
left posterior fascicular
causes of left axis deviation
right ventricular infarction
left ventricular hypertrophy
abdominal obesity
ascites / large abdomen
third-trimester pregnancy
left anterior fascicular block
ECG interpretation
evaluate patient’s overall condition
identify HR
is rate regular or irregular?
evaluate P waves
measure PR interval (normal: 0.12-0.20 sec)
evaluate QRS complex (normal: <0.10 sec)
inspect ST segment
normal sinus rhythm (NSR)
rate: 60-100 bpm
rhythm: regular
P waves: normal
PR interval: 0.12-0.20 sec
QRS complexes: <0.10 sec
ST segments: normal
sinus bradycardia (SB)
rate: <60 bpm
rhythm: regular
P waves: normal
PR interval: 0.12-0.20 sec
QRS complexes: <0.10 sec
ST segments: normal
sinus tachycardia (ST)
rate: 100-150 bpm
rhythm: regular
P waves: normal
PR interval: 0.12-0.20 sec
QRS complexes: <0.10 sec
ST segments: normal
supraventricular tachycardia (SVT)
rate: >150 bpm
rhythm: regular
P waves: not seen
PR interval: not measurable
QRS complexes: <0.10 sec
ST segments: not seen
sinus dysrhythmia (SD)
rate: <60-100 bpm
rhythm: irregular
P waves: normal
PR interval: 0.12-0.20 sec
QRS complexes: <0.10 sec
ST segments: normal
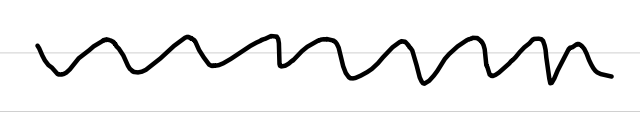
atrial flutter (AF)
rate: atrial 180-400 bpm, ventricular slower
rhythm: regular
P waves: sawtooth, uniform
PR interval: not measurable
QRS complexes: <0.10 sec
ST segments: may not be seen
atrial fibrillation (A-Fib)
rate: variable
rhythm: irregularly irregular
P waves: variable
PR interval: not measurable
QRS complexes: <0.10 sec
ST segments: may not be seen
premature atrial contractions (PAC)
rate: any
rhythm: any (usually irregular)
P waves: early
PR interval: 0.12-0.20 sec
QRS complexes: <0.10 sec
ST segments: normal
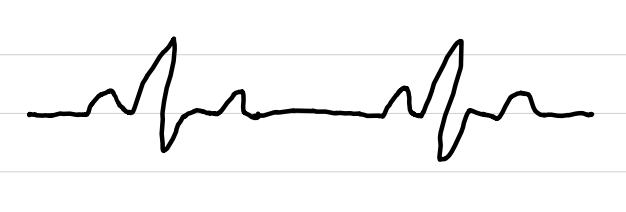
premature ventricular contractions (PVC)
rate: variable
rhythm: regular until interrupted
P waves: not associated
PR interval: not measurable
QRS complexes: >0.12 sec, premature, abnormal, followed by compensatory pause
ST segments: not seen after abnormal QRS
subtypes: unifocal, multifocal, couplets, R-on-T
ventricular tachycardia (VT, V-Tach)
rate: 140-300 bpm
rhythm: regular
P waves: not seen
PR interval: not measurable
QRS complexes: abnormal, >0.10 sec
ST segments: not seen
subtype: Torsades de Pointe (party streamer shaped)
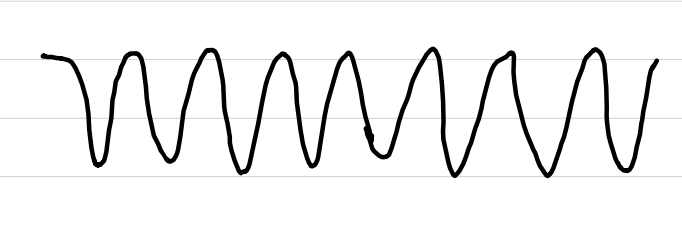
ventricular fibrillation (V-Fib)
rate: none
rhythm: irregular
P waves: absent
PR interval: absent
QRS complexes: absent or low-amp
ST segments: absent
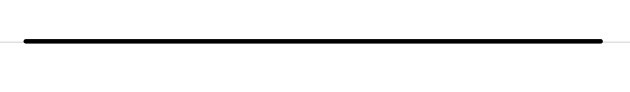
asystole (flatline)
rate: none
rhythm: none
P waves: none
PR interval: none
QRS complexes: none
ST segments: none
first-degree AV block (first-degree heart block)
rate: any
rhythm: any
P waves: normal
PR interval: >0.20 sec
QRS complexes: <0.10 sec
ST segments: normal
second-degree AV block type I (Mobite I, Wenckebach)
rate: varies (ventricular < atrial)
rhythm: irregular
P waves: normal
PR interval: varies, lengthens, then none
QRS complexes: <0.10 sec
ST segments: normal
second-degree AV block type II (Mobite II)
rate: any (ventricular < atrial)
rhythm: atrial regular, ventricular regular/irregular
P waves: normal
PR interval: normal or prolonged
QRS complexes: <0.10 sec or absent
ST segments: normal
third-degree AV block (complete heart block)
rate: slow (ventricular < atrial)
rhythm: regular
P waves: normal
PR interval: varies, no relation to QRS
QRS complexes: usually >0.10 sec
ST segments: normal
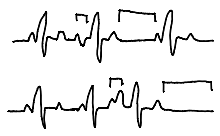
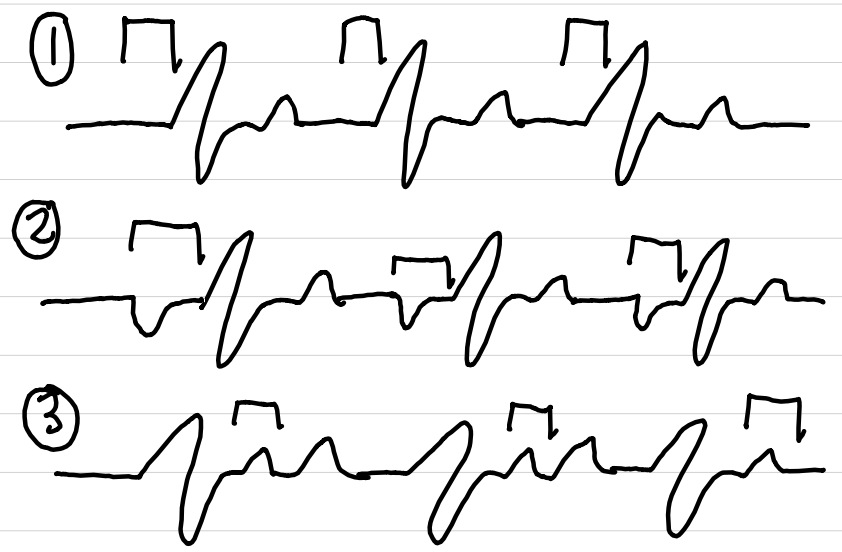
junctional rhythm (JR)
AV junction is pacemaker
P wave may be absent (1), inverted (2), or after QRS (3)
QRS normal
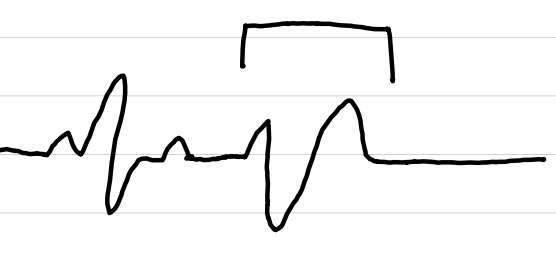
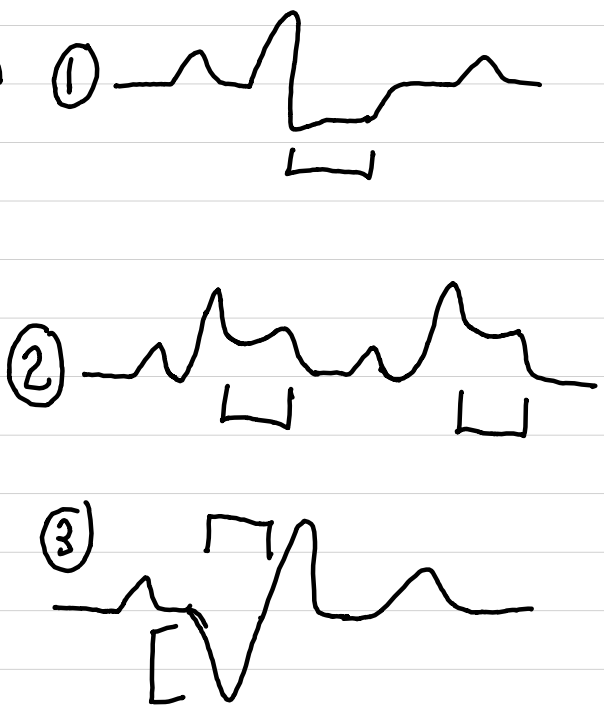
evidence of cardiac ischemia, injury, or infarction
ischemia (1)
depressed ST segment (≥1 mm below baseline) or inverted T wave
injury potentially reversible
acute myocardial injury (2)
elevated ST segment
ST returns to normal with restored perfusion
MI (3)
elevated ST segment and T wave changes in early stages
later, pathologic Q waves
appear hours to days after event
usually remain for rest of patient’s life
pulseless electrical activity (PEA)
electrical activity in the heart with no pulse
causes of dysrhythmias
hypoxia
ischemia
sympathetic stimulation
drugs
electrolyte imbalance
hypertrophy
rate
stretch
ECG patterns with chronic lung disease
severe COPD
right axis deviation
P waves large due to right atrial enlargement (leads II, III, aVF)
prominent and negative P wave in lead I
cor pulmonale
increased R wave size on leads V1-V3
reduced size of QRS in leads I-III, V5-V6