Hydrospheric Sciences, Drought Monitoring
 Call Kai
 Learn
Learn Practice Test
 Spaced Repetition
 Match
Match Flashcards
 Knowt Play
1/15

There's no tags or description
Looks like no tags are added yet.
Name | Mastery | Learn | Test | Matching | Spaced | Call with Kai | Chat |
|---|
No analytics yet
Send a link to your students to track their progress
16 Terms
Percentage of Ocean water percentage by surface area and volume
SA: 94
Vol. 97
How are spectral properties of water determined?
Volume scattering, not surface reflection
Determined by transmittance, not just surface characteristics
Effects of turbidity on spectral properties of water
large particles in water mean wavelength of maximum scattering shifts from blue to green region
Rather than clear water that absorbs NIR
Effects of roughness on spectral properties of water
water looks brighter with rougher water since light scatters in more directions; directs a portion of the solar beam directly to the sensor
calm water only reflects volume radiation to sensor
where is penetration greatest with Multispectral Bathymetry? Which wavelengths for pure water scatter the most?
In the blue-green region, penetration is greater and therefore the opportunity for recording features on the bottom of the water body is greatest
Additionally, for pure water, scattering by particles smaller than wavelength causes shorter wavelengths to be scattered the most – like Rayleigh scattering
Describe SeaWIFS scanning frequency
Approximately 90% of the ocean surface was scanned every 2 days. Active from 1997-2010.
just something to note i dont feel like making this a flashcard
Band Wavelength (nm) Primary use
1 412 (violet) Dissolved organic matter
2 443 (blue) Chlorophyll absorption
3 490 (blue-green) Pigment absorption
4 510 (blue-green) Chlorophyll absorption
5 555 (green) Pigments, sediments
6 670 (red) Atmospheric correction
7 765 (near IR) Atmospheric correction, aerosol
8 865 (near IR) Atmospheric correction, aerosol
Describe SeaSat Mission
To provide timely oceanographic data to scientists studying marine phenomena, and to users of the oceans as a resource (ocean shippers, fishermen, marine geologists, etc)
Frequency: L band
Swath width: 100 km
Name 4 methods of Lidar Bathymetry
Scanning Hydrographic Operation Airborne Lidar Survey (SHOALS)
Compact Hydrographic Airborne Rapid Total Survey (CHARTS)
Laser Airborne Depth Sounder (LADS)
Experimental Advanced Airborne Research LiDAR (EEARL)
Describe El Nino
El Nino is the warming of sea temperature in tropical pacific, occurs every 2-7 years, affects to the rainfall pattern and drought, and flooding
El Niño favors warmer than average conditions for Alaska and the northern tier of the continental U.S., and cooler than average conditions for much of the southern tier of the U.S.
Name 3 advantages for RS for drought monitoring
1. Spatial continuous measurements across large geographic areas.
Important in locations where weather stations or other ground observations (human) are sparse or non-existent.
2. Frequent revisit time for image acquisition
Several satellites acquire image data every 1-2 days or a 1-2 week basis for same location.
3. Historical record of conditions
Several instruments (AVHRR and Landsat) provide 20+ years of information with some newer sensors (MODIS) approaching 15+ years of observations. Ability to acquire data about important variables e.g.. vegetation, moisture, climatic
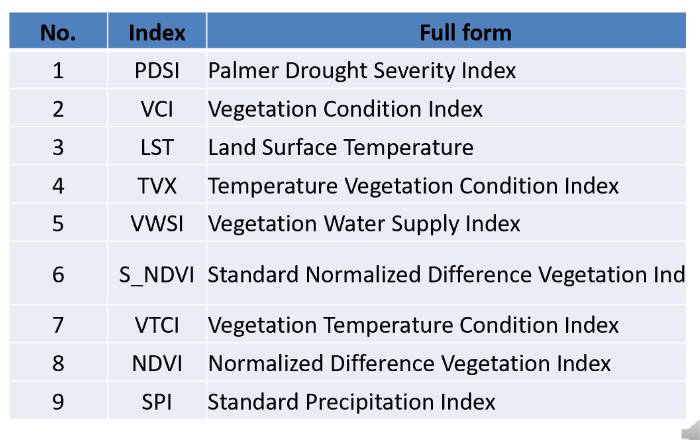
9 Drought indicators
Operational data production
routinely produce the same data products at a certain time interval.
ideal data for drought monitoring
Anomaly, Percent of Normal, Change, or Ranking Maps
Provide historical context of how current conditions compare to the historical conditions for a specific location and time during the year.
ideal data for drought monitoring
Name 4 ideal data for drought monitoring
Operational data production
Anomaly, Percent of Normal, Change, or Ranking Maps
•Data easy accessible and in multiple formats
•Evaluation of the Informational Accuracy for your Local Area - Expert opinion, local feedback
Name USGS site for early warning and environmental monitoring program
USGS FEWS NET