Research Methods
1/25
There's no tags or description
Looks like no tags are added yet.
Name | Mastery | Learn | Test | Matching | Spaced | Call with Kai |
|---|
No analytics yet
Send a link to your students to track their progress
26 Terms
What is meant by a construct and its operational definition?
A construct, like happiness, is a hypothetical psychological mechanism that cannot be observed.
So how can you measure it in research?
You can measure smiling behaviour. It is something you can observe and measure, and we theorise it indicates the presence of happiness, but it isn’t happiness itself. You cannot investigate a construct directly, only indirectly through observing behaviour or experiences.
What are the different types of research questions?
Questions of association: is happiness related to sunshine?
Question of difference: are arts students happier than science students?
Questions of prediction: does happiness lead to increased academic performance?
What are aspects of a hypothesis?
Hypothesis should be informed by your LR.
More narrow and specific than research question.
Should be testable.
Should be refutable.
Should state or predict something will happen. Never hypothesize that nothing happens or will not happen.
Describe continuous and discrete variables.
Continuous variables allow for decimal or fractional values to be obtained between points on a scale when measures.
Distance, weight, time.
Discrete variables: no decimals or fractions,
The number of people in a family.
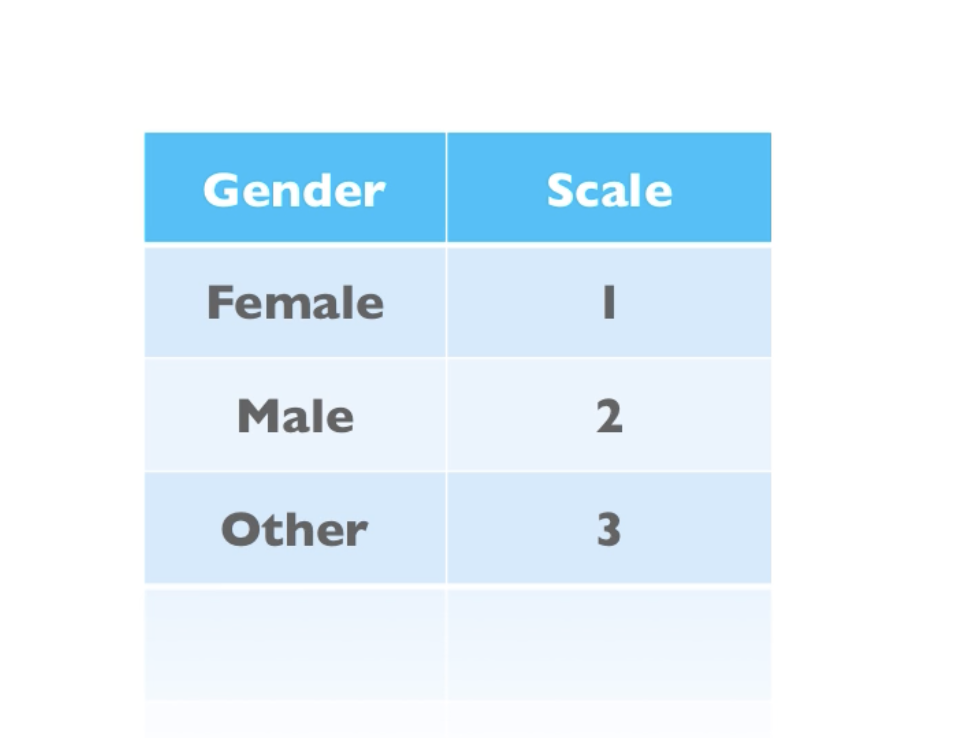
Describe nominal scale.
Measurement based on a set of categories, hence sometimes called categorical scales.
There is no intrinsic order (no ranking). Intrinsic order is something like pain level: mild<moderate<severe or education level primary<high<uni.
Examples: blood type, eye colour.
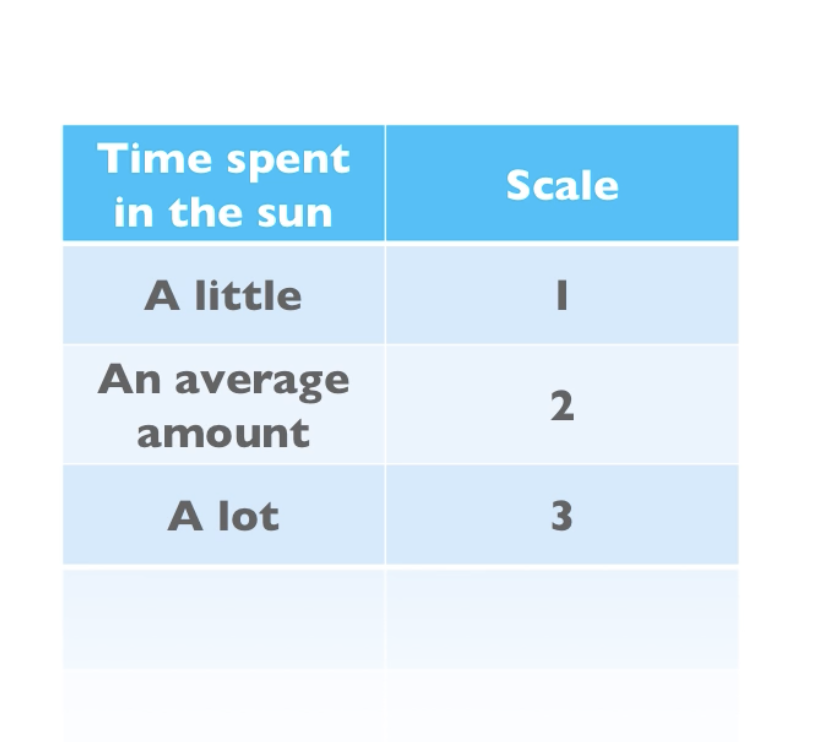
Describe ordinal scale.
Assigned to indicate an order.
Does not tell us the magnitude of the points.
Running race: 1st, 2nd, 3rd, but doesn’t tell us time of runners.
Describe an interval scale.
Numbers indicate an actual amount of something, with equal units of measurement, but no real zero. Essentailly, zero does not mean complete absence of something, example temperature at 0ºC means something.
Describe a ratio scale.
Comprised of an actual amount of something with equal units of measurement, but has a real zero point.
Describe descriptive research design.
Concerned with description and measurement of the natural state of individual variables as they are expereinced by people.
No experimental manipulation, and the focus is only on observation. Then you describe results.
Investigate typical height of class using measuring tape or finding how many have colds in winter.
Describe correlational research design.
Concerned with the relationship between variables.
Test the presence of association, no experimental manipulation, just observation.
Each participant must at least provide two pieces of data for each variable being tested, to determine relationship.
Relationship between exercising and happiness.
No cause and effect.
There could however be a third variable that partially explains the cause and effect. People who exercise more, socialise more, hence more happy.
Describe experimental research design.
Determine cause and effect between variables.
Invovle manipulation of IV, and controlled experimental conditions to increase internal validity.
Should have a control group (the CG can act as the IV: treatment, no treatment).
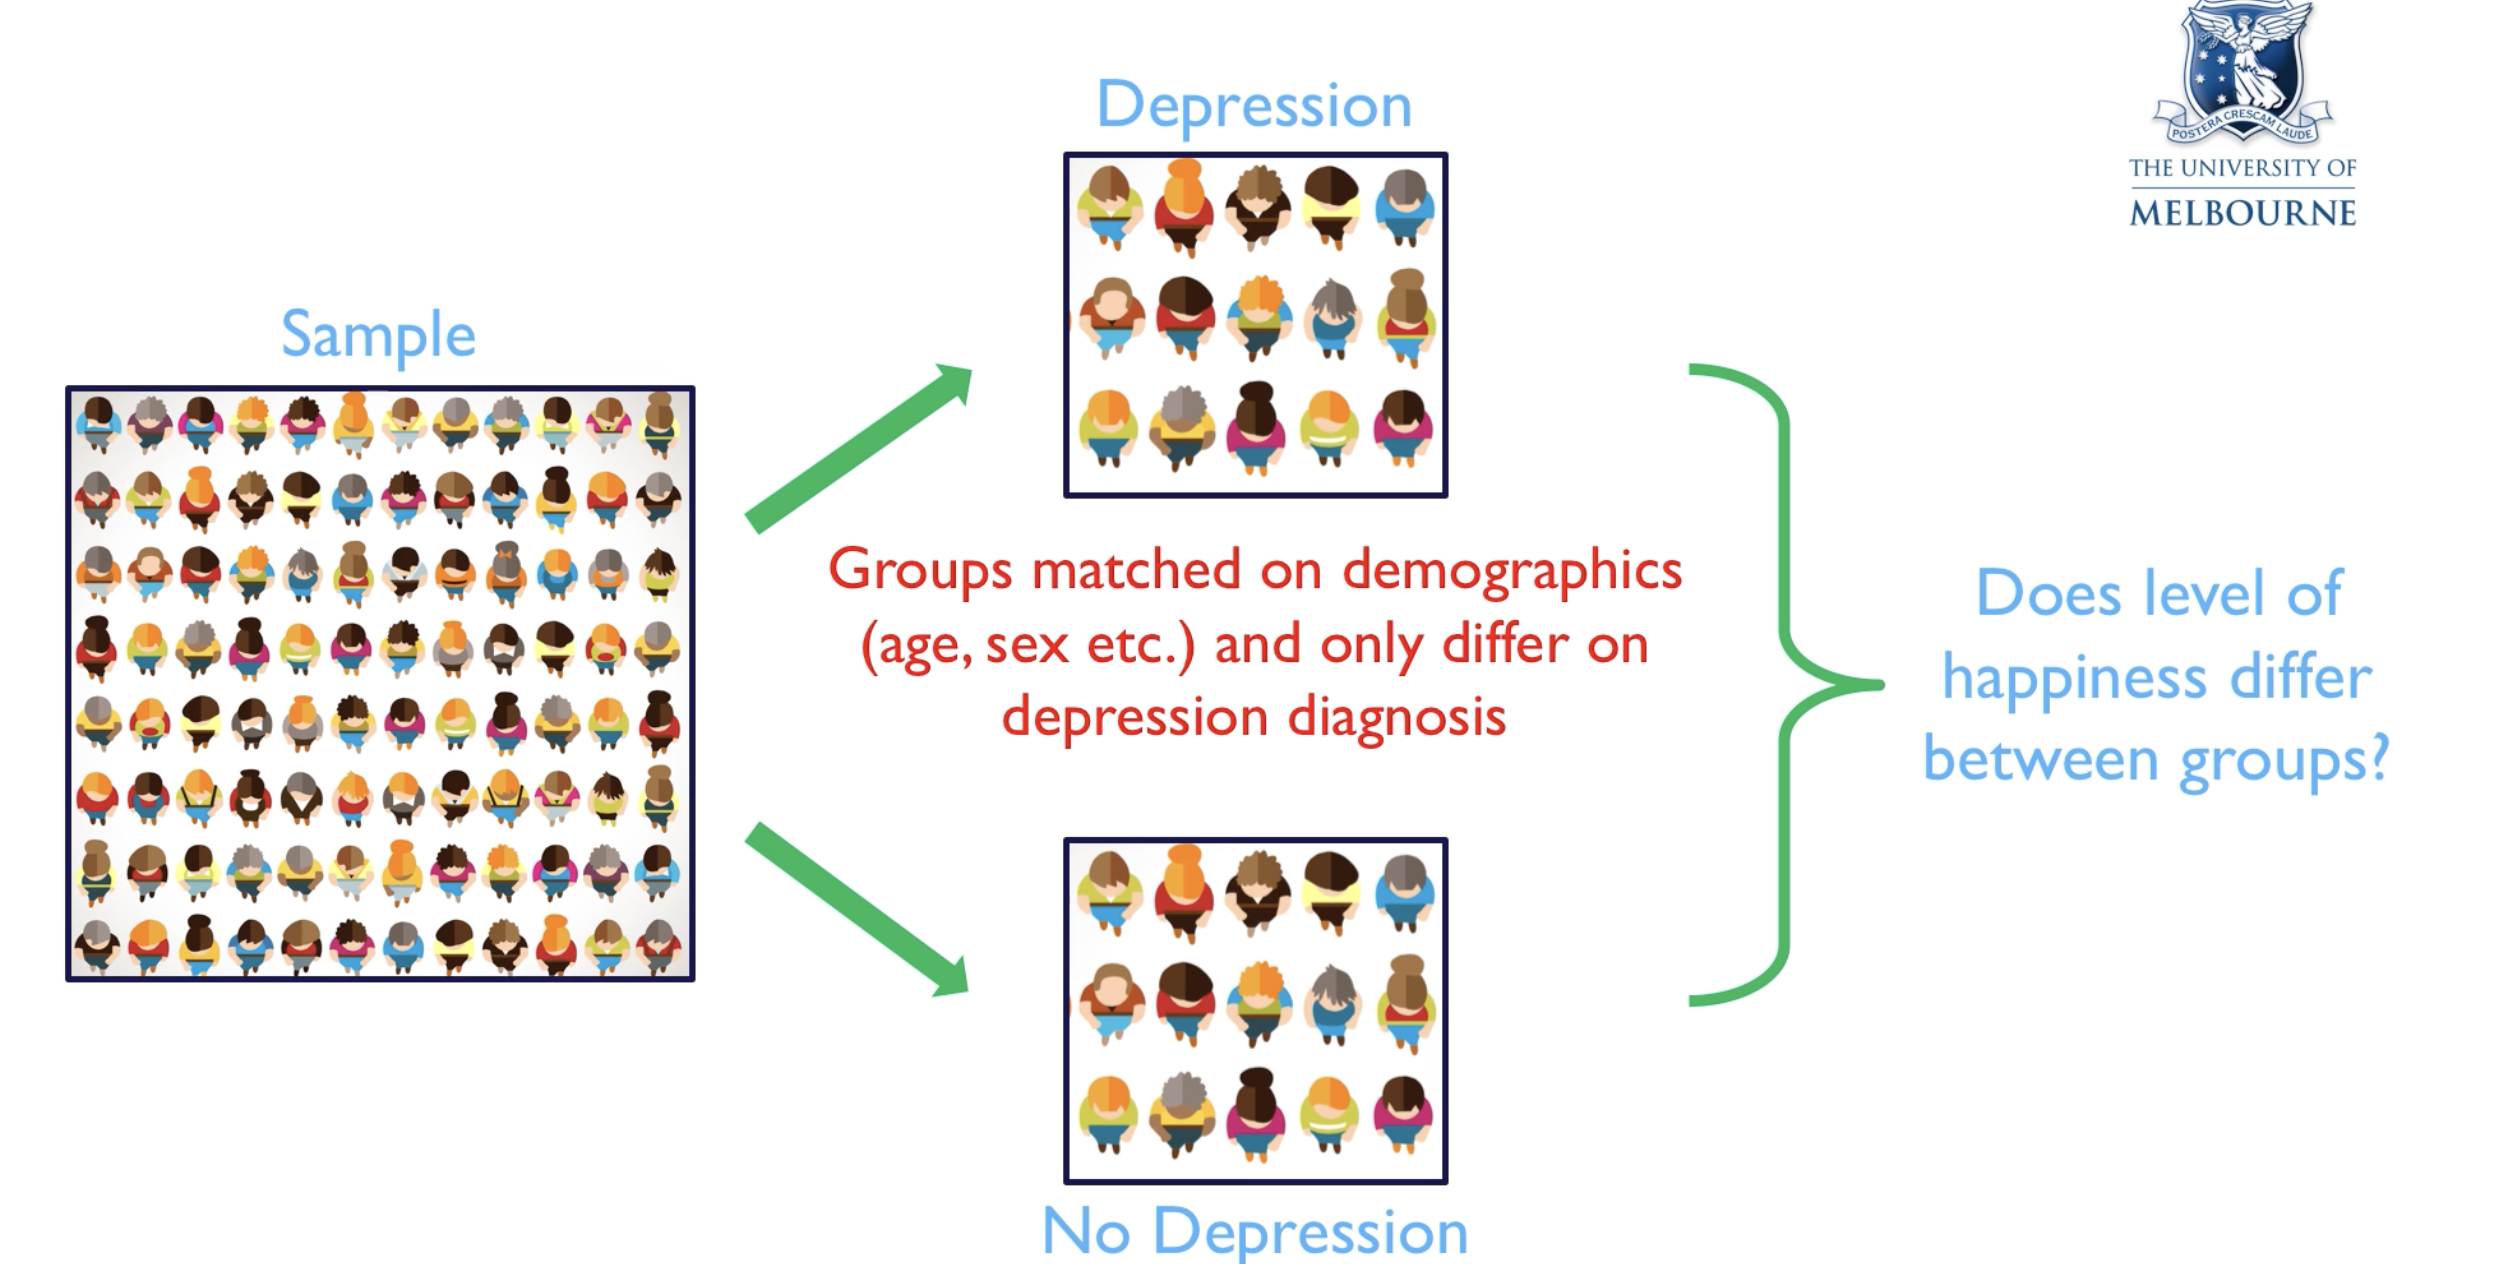
Describe Quasi-Experimental Design.
Seek to find cause and effect.
Has controls, but they are less stringent that experimental design, leading to less thorough evidence for cause and effect.
They usually do not involve random assignment into random participant groups. Example: might compare people with and without depression on happiness via a survey. The two groups only differ by a depression diagnosis.
Describe non-experimental designs.
Similar to correlational, in that concerned with demonstrating a relationship between variables, but don’t attempt to explain C and E.
Correlational involves observation of a group of people and 2 variables per person.
Non-eperimental involves 2 or more groups of people and one variable.
Example: test arts and science students IQ, and then determine which is smarter.
Describe population and sample.
Everyone of relevance to a research study.
For example, in a study involving schizophrenia, the population would be everyone with schizophrenia. However, it isn’t possible to investigate everyone with schizophrenia, hence the people who participate in the study are the sample.
You try to make an inference of the population from the sample. Your sample must be representative or as close as to the population.
Describe simple random sampling.
Form of probability sampling where each individual in a population has equal probability for being selected for the study.
Strength: free of selection bias
Cons: does not guarantee sample will be representative of population.
Probability sampling is not commonly used in psychological research, due to the cons. The con of non-probability sampling is that it is prone to selection bias.
Describe convenience sampling.
Non-prob sampling,
Sample comprised of individuals that are easily or convenient to recruit.
Example: for people with schitz, recruitment may take place in hospitals.
Without careful control, research may be biased in some way so that you cannot generalise findings to wider population.
To contorl this is through the use of quotas.
Example: identify subgroups within the population, then setting recruitment quotas to ensure they are equally represented in the sample. If pop has 60% 0-25 year olds, 25%25-50, 15% 50+, that is your quota.
Must be transparent.
Describe merit.
Research that has justified benefit to humanity.
Know the other bio concepts: integrity, justice, etc.
Must submit research proposal plan to ethics committee which will scrutinize such plan.
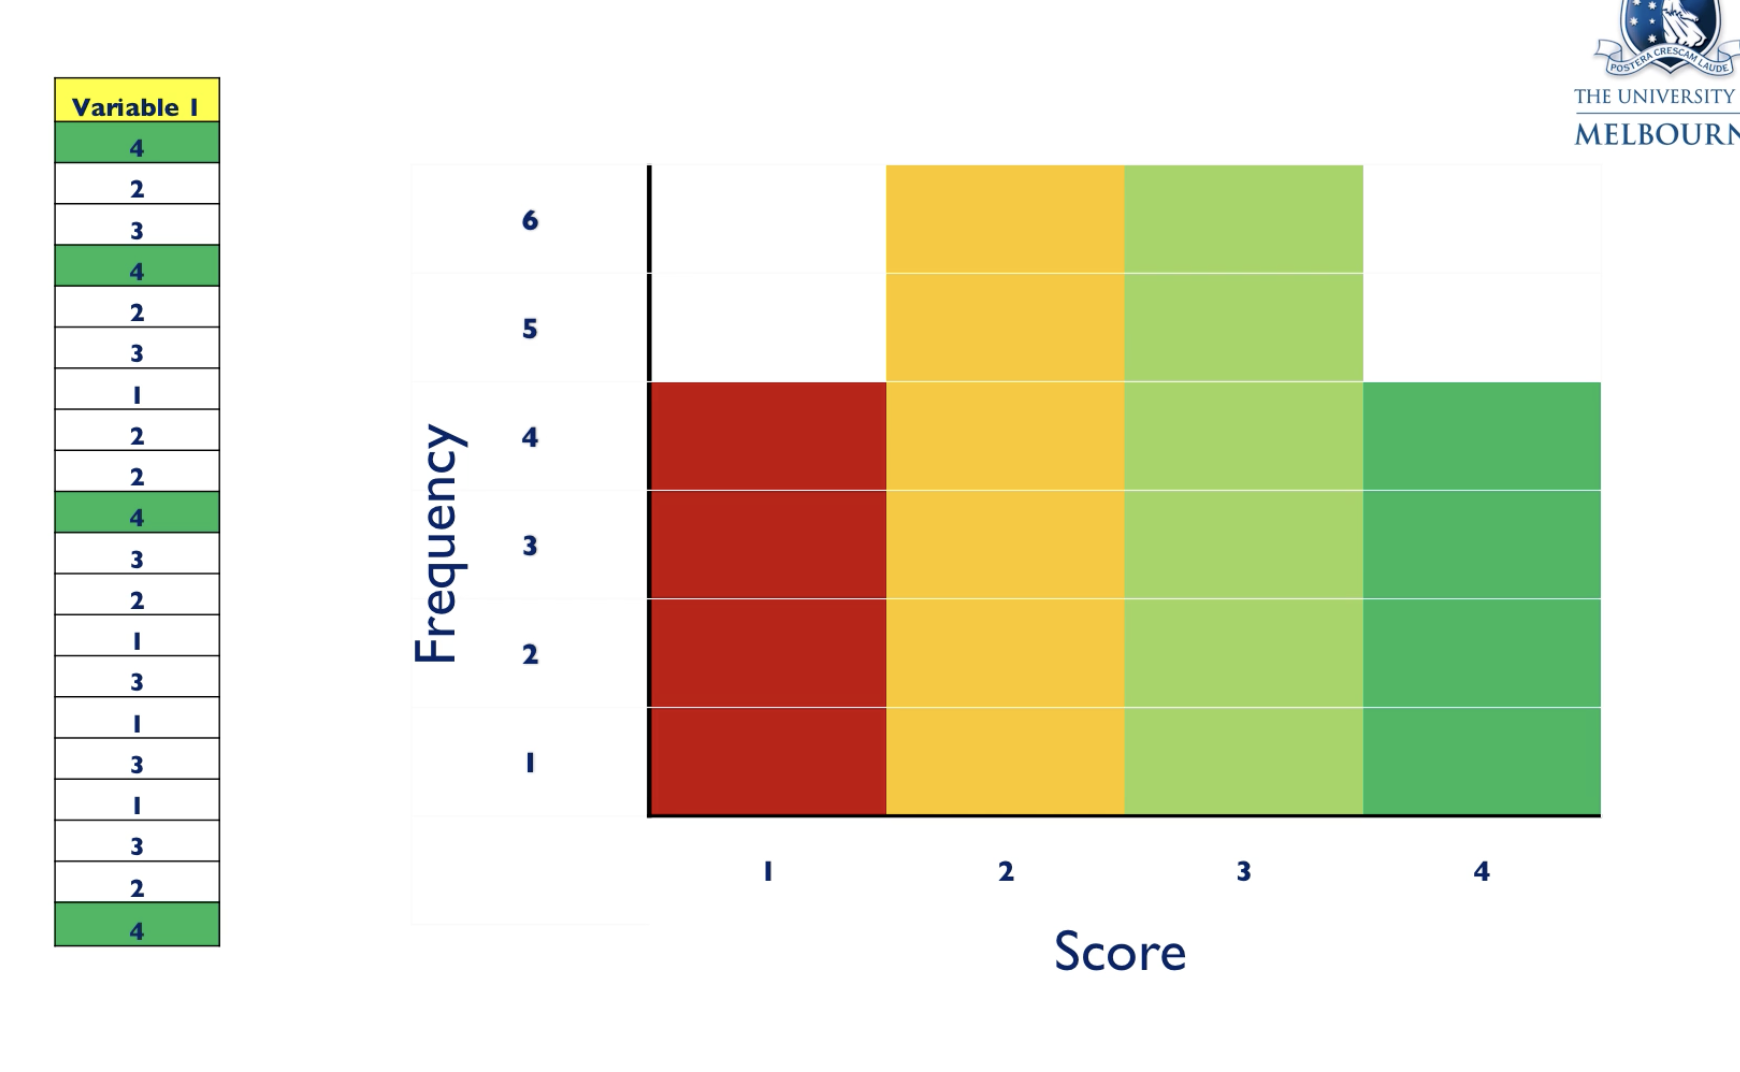
Describe a frequency histogram.
Frequency distribution.
In this case, data is distributed normally, highest freq in the middle (bell curve).
Positive skew where majority of scores are low.
Negative skew where majority scores are high.
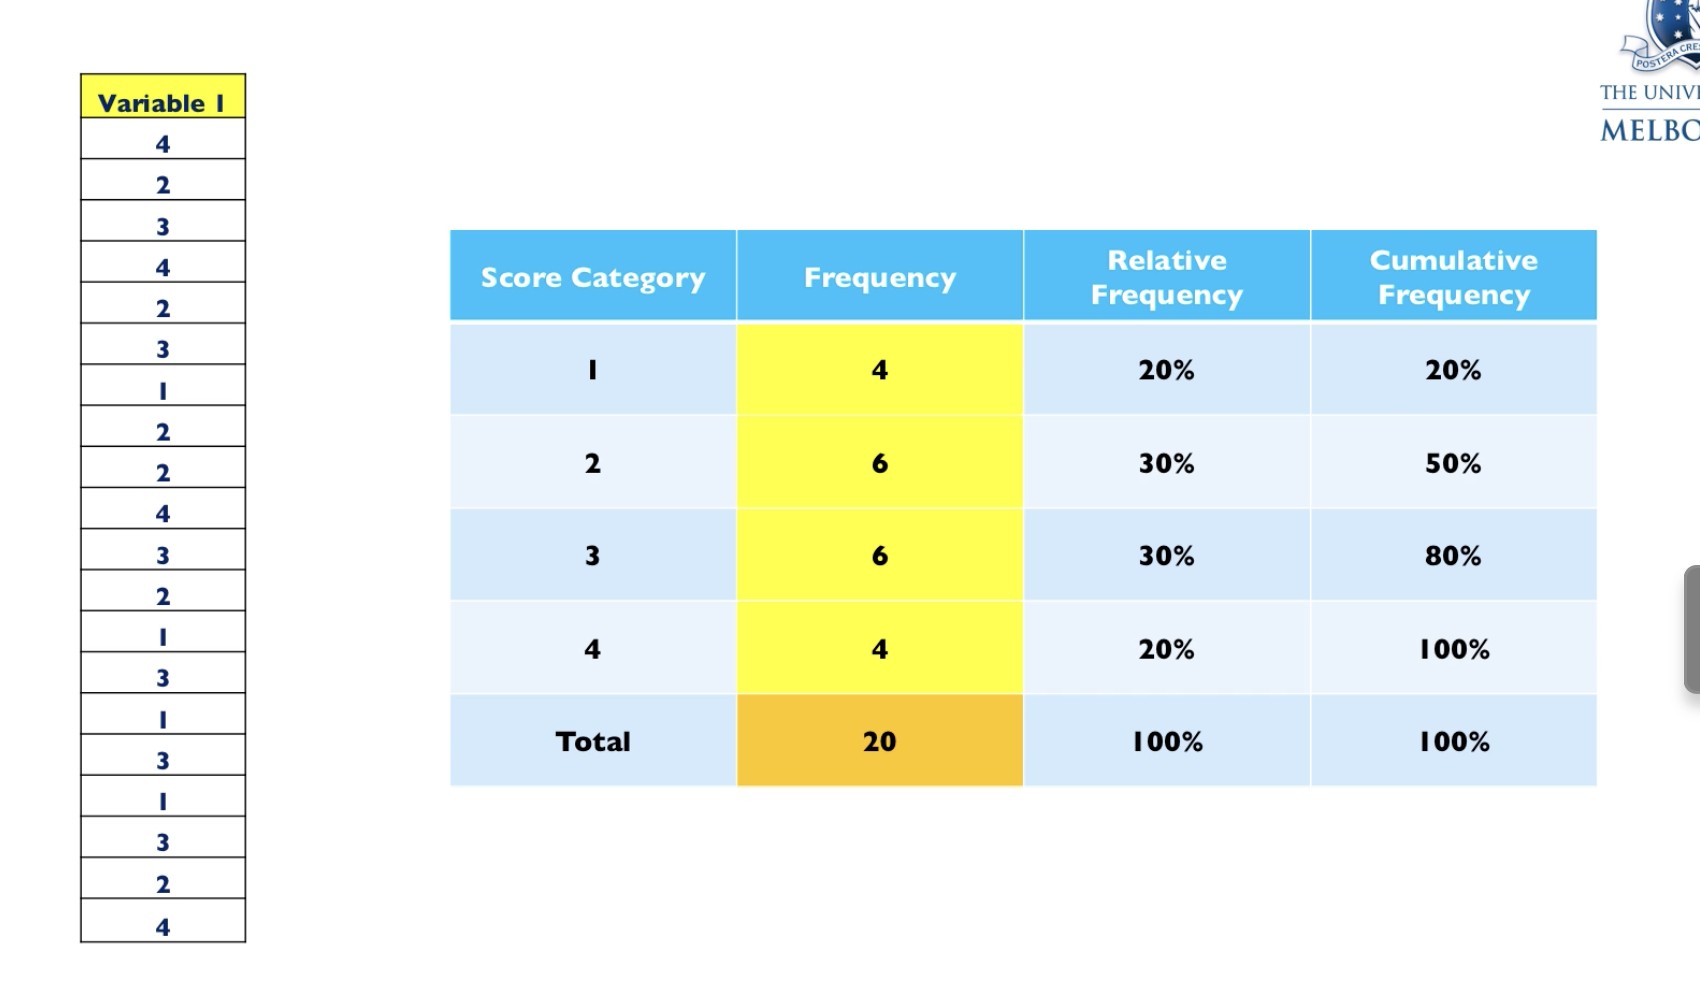
Describe a frequency table.
Relative freq: freq/total.
Cumulative frequency: adding all the relative freq.
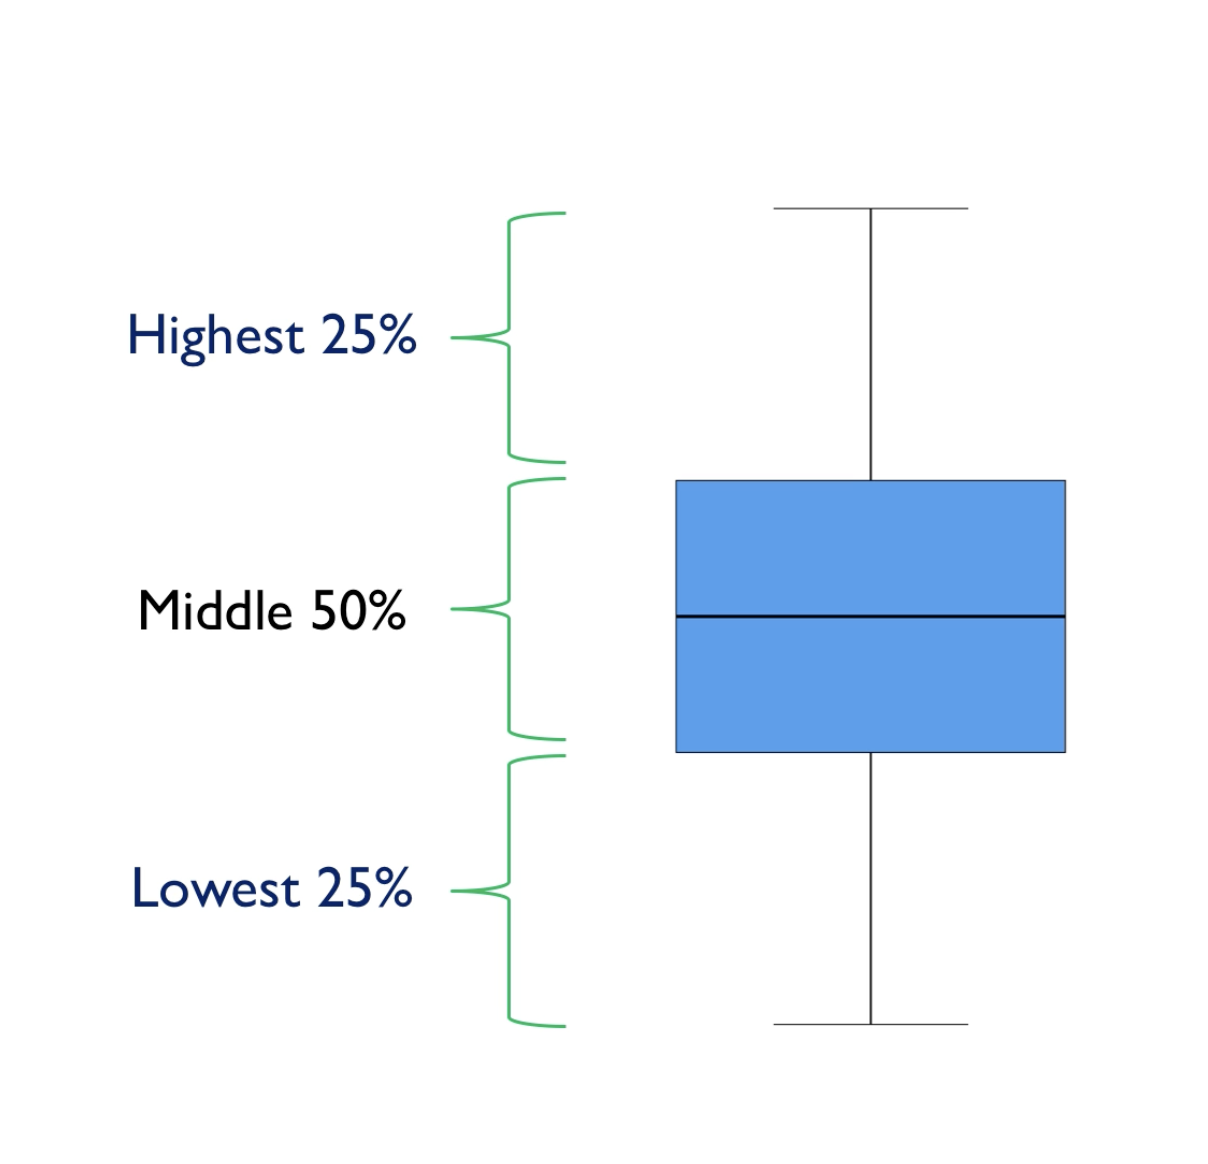
Describe structure of boxplot.
The whiskers (the horizontal lines).
If data is outliers, they are above or below the whiskers.
What is central tendency?
What is most typical in data.
Mean, median and mode.
Mean is appropriate to use with interval and ratio data, and normal distributions. If data has skewed, it might compromise the central tendency.
Median is unaffected by outliers and used for ordinal data.
Mode is used with discrete data and nominal scales.
What does low variability mean?
If scores are tightly packed around mean, variability is low. Mean is good reperesentative score for distribution.
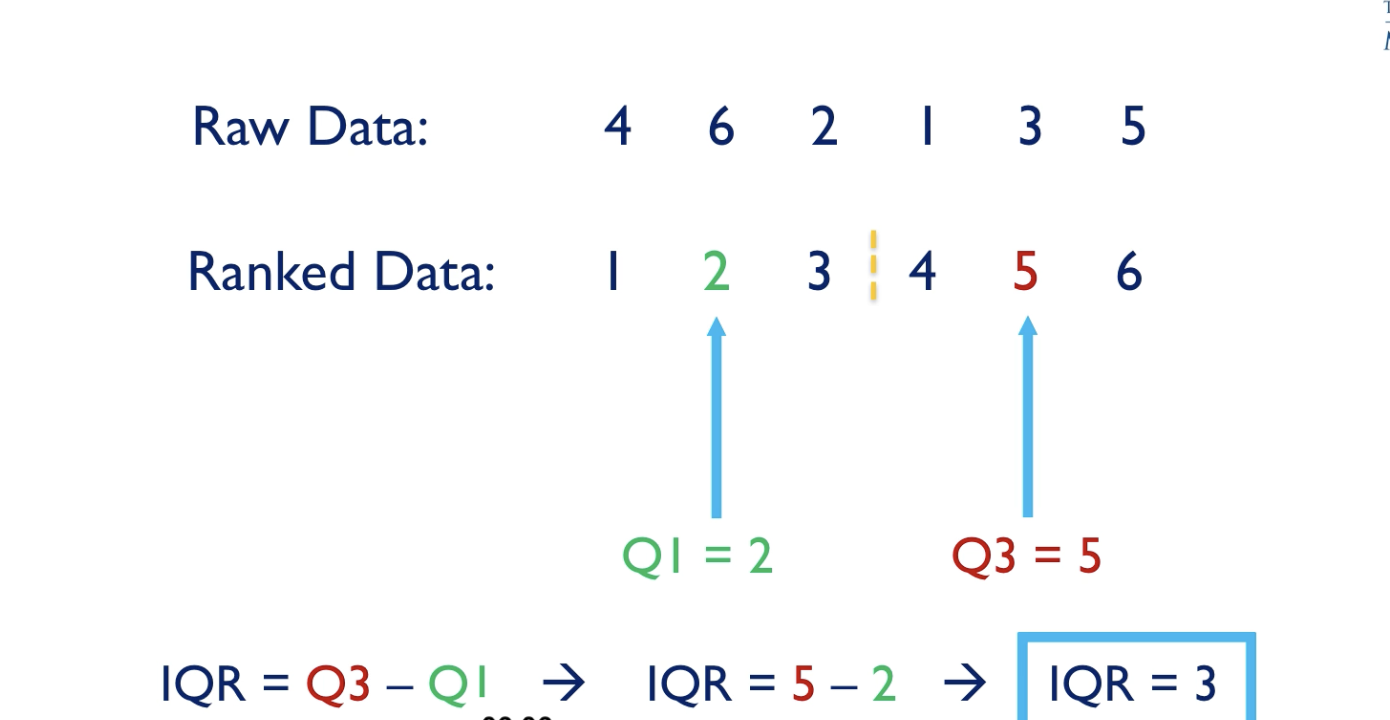
Describe range, IQR.
Largest score - smallest score.
IQR = 75th percentile - 25th percentile. Q3-Q1.
Describe standard deviation.
Average amount that scores deviate from the mean.
Find deviation score: if above the mean you do score - mean. Lets say mean is 5 and a score above the mean is 7, do 7-5, giving deviation score of 2.
If below mean, you square negative numbers.
You do a sum of squared deviation scores, then you divide by n-1 (variance).
sd is square of variance.
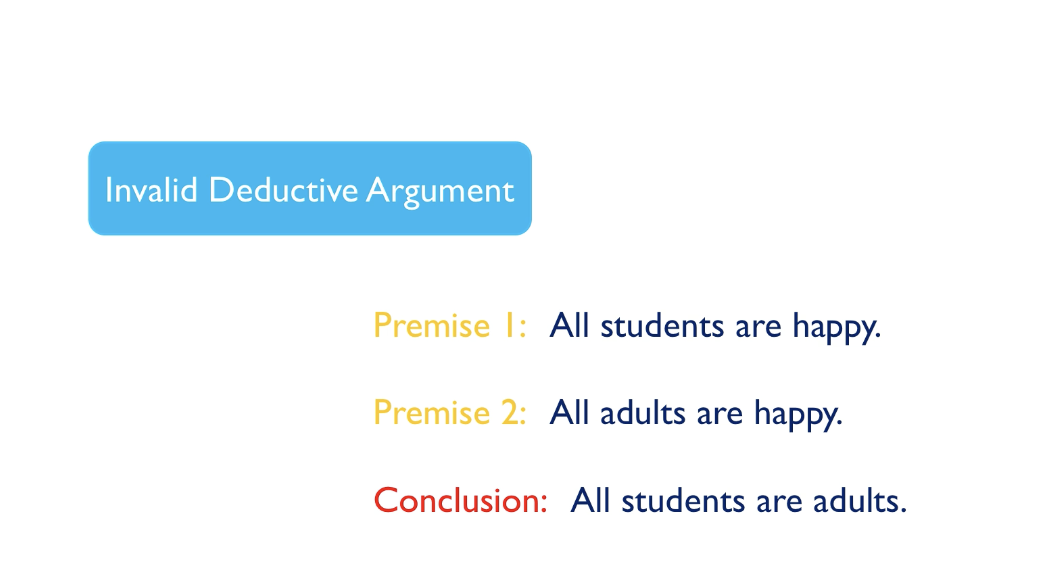
Describe deductive reasoning.
It is an argument where if the premises are true and the reasoning is valid, the conclusion must be true.
Start general. General rule → specific conclusion.
Example
-all humans are mortal → Socrates is humans → Therefore, Socrates is mortal.
You can have a valid deductive argument which is not true in real life. A sound deductive argument is a true deductive argument.
All Australians live Vegemite → Francis is Australian → He must live Vegemite.
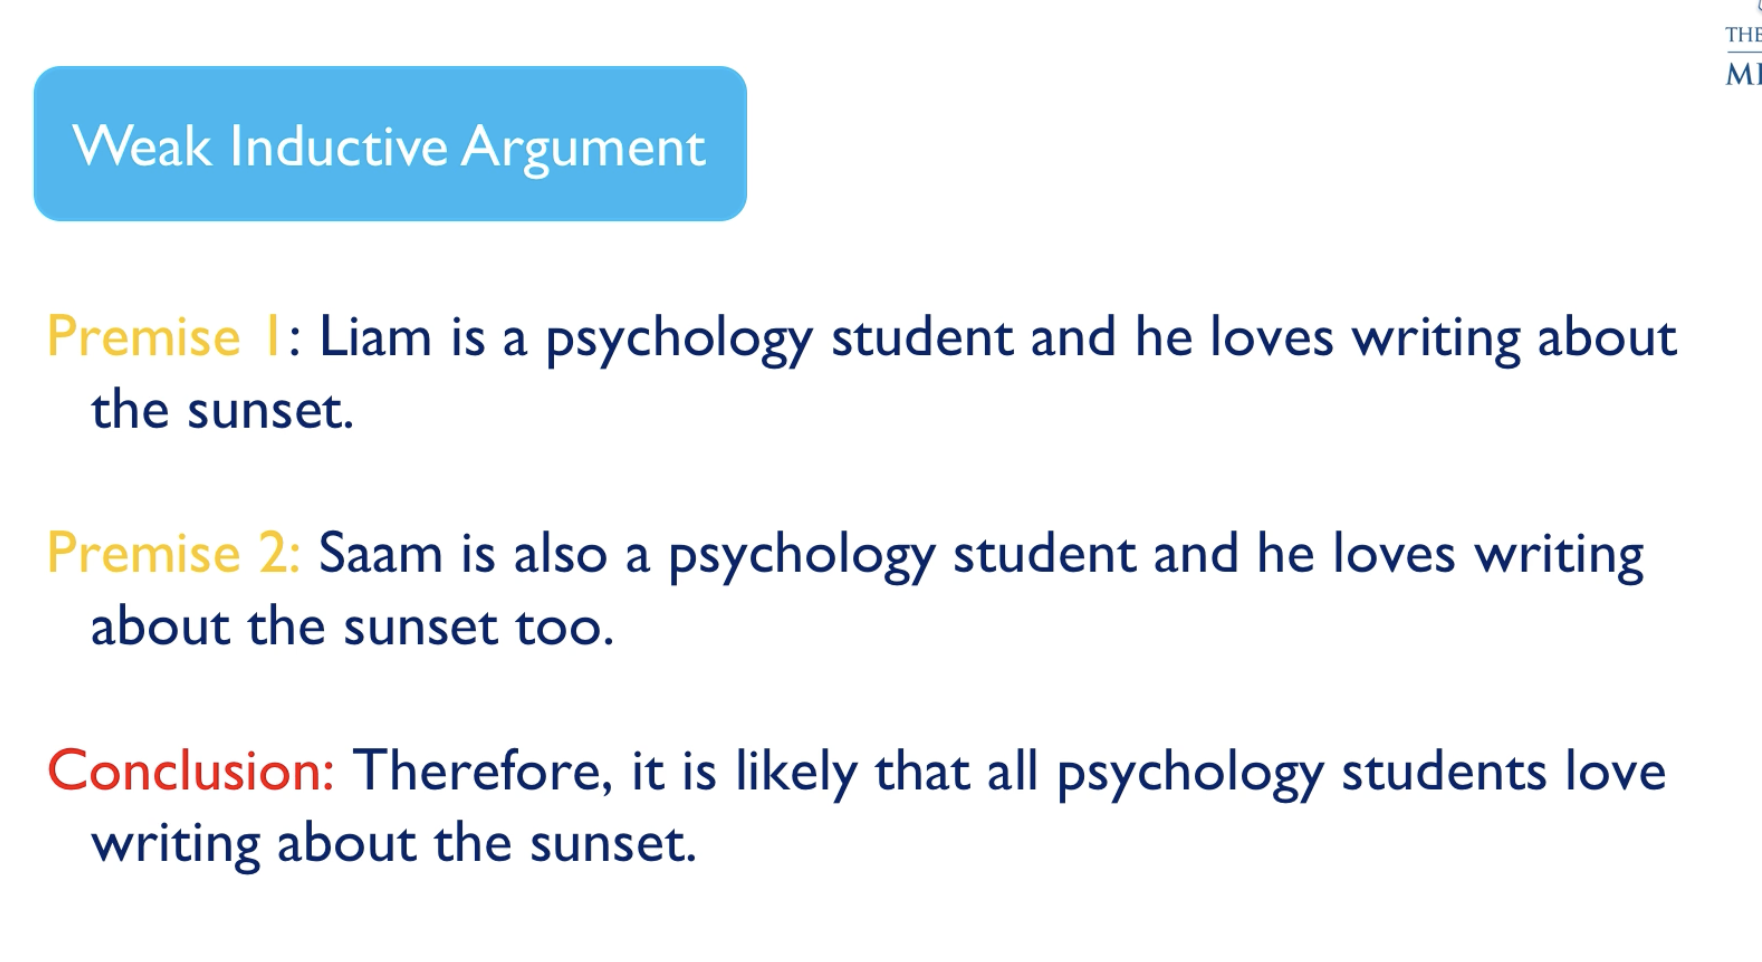
Describe inductive argument.
An argument where the premises make the conclusion likely, but do not guarantee it.
Usually starts with a specific observation, then forms a general conclusion.
Specific observation → general conclusion.
Swan 1 is white, 2 is white, 3 is white, so all swans are probs white.
The sun has risen everyday in the past, hence will probs rise tmr.
Can have strong or weak inductive argument.