EXAM -economics
1/41
There's no tags or description
Looks like no tags are added yet.
Name | Mastery | Learn | Test | Matching | Spaced | Call with Kai |
|---|
No analytics yet
Send a link to your students to track their progress
42 Terms
what does the leftward shift of the aggregate demand curve show?
the relationship between inflation and the quantity of aggregate output demanded by households, firms, the government and the rest of the world
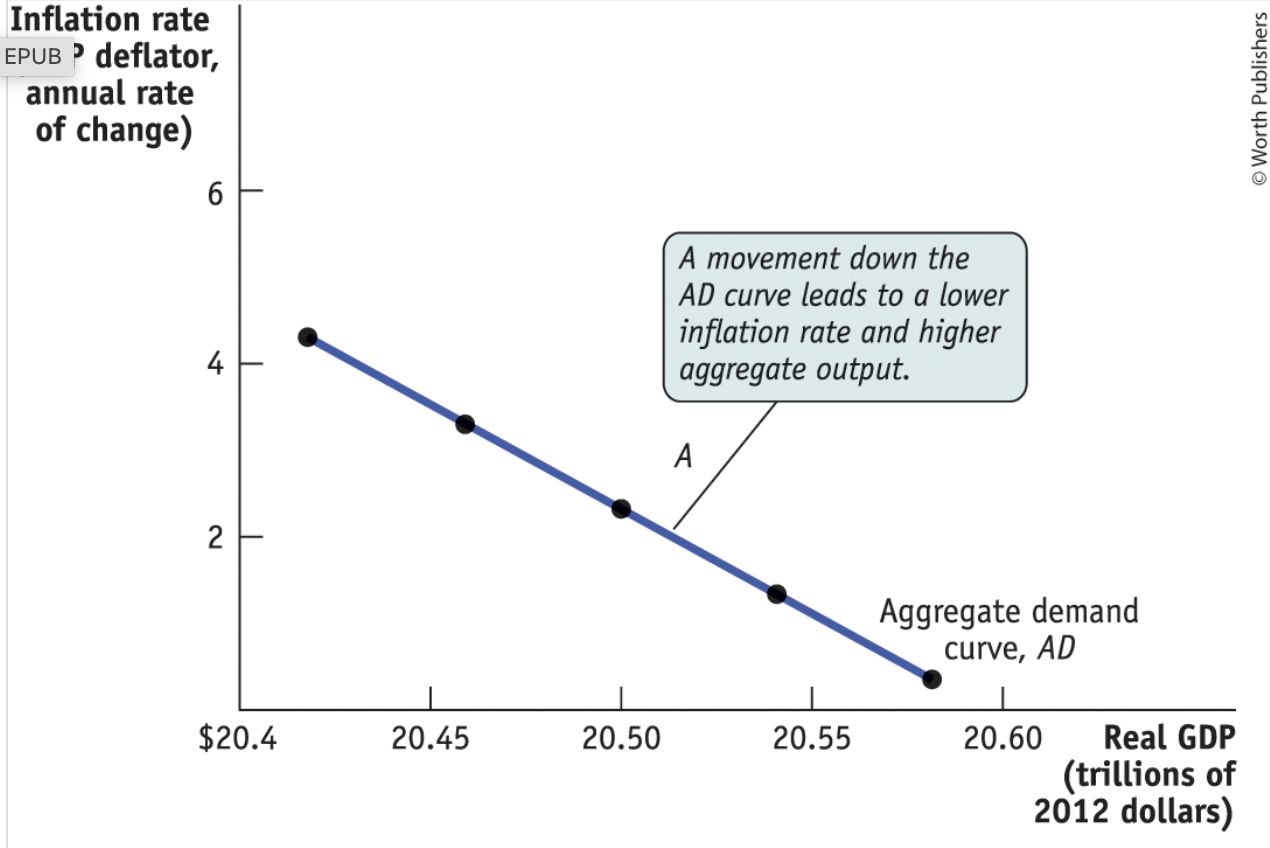
what does a movement down the AD curve lead to?
lower inflation rate and higher aggregate output
what does a AD graph look like? what are the axes?
what does inflation rate lead to in terms of the Aggregate output?
reduces the quantity of aggregate output demanded when high inflation
why is the AD curve sloping downwards?
Formula for national income accounting: GDP = C + I + G + (X-IM)
Understanding this formula as it is a measure of the final goods and services domestically produced in an economy
what are we considering in relation to movements up and down the aggregate demand curve?
a simultaneous change in the prices of all final goods and services
why does a rise in the inflation rate lead to a fall in the quantitiy of all domestically produced final goods and services demanded?
lies in the interest rate effect of higher overall prices, which depends on the special role money plays in the economy
who controls the money supply in the economy?
central banks
monetary authorities
what does a rise in interest rates do?
reduces investment spending
increases the cost of borrowing
reduces consumer spending, as households save more of their disposable income
Therefore effects GDP
What does high interest rates do to IM and X?
tends to indirectly reduce them
what is the income expenditure model?
is is where aggregate price level is fixed = inflation is fixed
The model shows what aggregate spending would be at any given inflation rate
what does a fall in inflation do to the income expenditure model?
leads to higher planned aggregate spending at any given level of real GDP, further higher aggregate spending leads to a multiplier process that move income expenditure upwards
What does a fall in inflation do to the AE planned curve and how does that effect GDP
?
AEplanned curve shifts upwards and rises in teh real GDP level
what do economists usually use the income expenditure model for?
analyse the short-run economic fluctuations
what are the main reasons for the AD curve to shift?
changes in expectations
changes in wealth
changes in the size of the existing stock of physical capital
fiscal and monetary policy
For a shift in the AD curve, how does changes in expectations (consumers becoming optimistic) effect the AD curve?
Aggregate demand increases
what happens to the AD curve when the real value of household assets increases?
aggregate demand increases
what happens to AD when the existing stock of physical capital is realtively small?
AD increases beause businesses need to invest more and spend more on new capital goods to build their productive capacity. This leads to investment in C + I + G + (X-IM) increasing
what happens to the AD curve when the government increase spending or cut taxes?
AD curve will shift outwards and increase, as an effect on spending is direct and an effect on taxes is indirect as it is an effect on disposable income. As it effects the G in GDP formula and increases the final goods and services in that economy
what happens to AD when the central bank takes a softer position on inflation?
aggregate demand increases as consumers are spending more due to a higher disposable income, further companies borrow more and invest more as the cost of capital is lower
what is the definiton of aggregate supply?
shows the relationship between the economy inflation rate and the quantity of final goods and services produced, or aggregate output, that producers are willing to produce
what is the relationship in the SR aggergate supply curve?
A rise in inflation is associated to a rise in the quantity of output supplied
what is the equation for profit per unit of output?
prices per unit of output - producion cost per unit of output
what is the behviour of producers in perfectly competitive markets?
They take price as given
when inflation falls, the price revieved by the producer of a final good or service is lower than they were expecting
As many production costs are fixed in the SR, production cost per unit of output doesn’t fall by the same proportion as the unexpected lower price recieved by the firm, so the profit per unit of output declines, leading perfectly competitive producers to reduced the quantitiy supplied in the SR
What happens if there is a rise in the demand in an imperfectly competitive market?
The producer will be able to sell more at any given price, as they set their own prices.
stronger demand = increased prices as well as its output, as a way of increasing profit per unit of output
what do both responses, either a fall or rise in production, equal?
an upward sloping relationship between aggregate output and the inflation rate, which is illustrated by the SR aggregate supply curve
draw a aggregate supply curve in the short run?
In the SRAS curve what do producers base their decisions on?
profit per unit of output
what does the SRAC illustrate the relationship between?
The positive relationship between inflation and aggregate output in the short run
what causes shifts in the SRAS curve?
changes in commodities
changes in expectations
changes in productivity
changes in wages
what happens in the long run aggregate supply curve in terms of inflation?
a rise in inflation leads to a rise in aggregate output, because many wages and prices are sticky in the short run
what happens in the LRAS when production costs are fully flexible?
As a result, the level of inflation does not change the quantity of aggregate output supplied. That’s because changes in the inflation rate, which is composed of prices of final goods and services, will be accompanied by equal proportional changes in all input prices, including nominal wages.
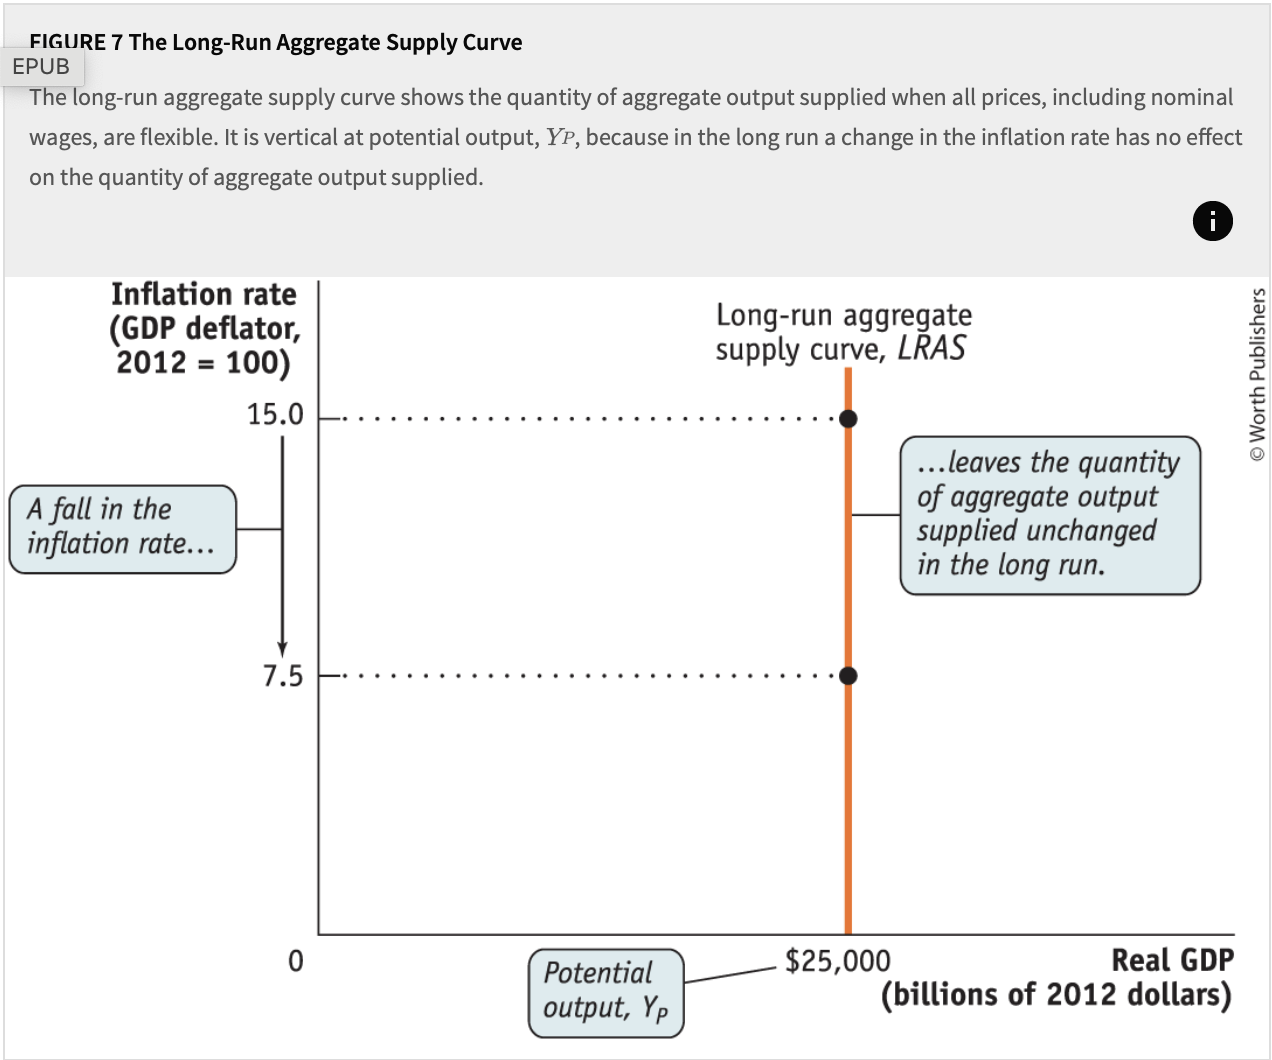
what does the LRAS show the relationship between?
Inflation and the quantity of aggregate output supplied that holds when all prices, including nominal wages, are fully flexible.
why is the LRAS verticle?
because when prices are fully flexible inflation has no effect on aggregate output
illustrate a drawing of the LRAS?
what do we do to understand the behviour of the economy?
put the aggregate supply and the aggregate demand curve together = AD-AS model
what is the short run macroeconomic equilibrium Esr?
the point at which the quantity of aggregate output supplied is equal to the quantity demanded by domestic households, businesses, the government, and the rest of the world
if inflation is above its equilibrium price what happens?
the quantity of aggregate output supplied exceeds the quantity of aggregate output demanded. This leads to a fall in the inflation rate and pushes it toward its equilibrium level.
what happens if inflation is below its equilibrium price?
the quantity of aggregate output supplied is less than the quantity of aggregate output demanded. This leads to a rise in the inflation rate, again pushing it toward its equilibrium level.
when change in expectations or wealth, the effect of the size of the existing stock of physical capital, or the use of fiscal or monetary policy, what is this called?
demand shock
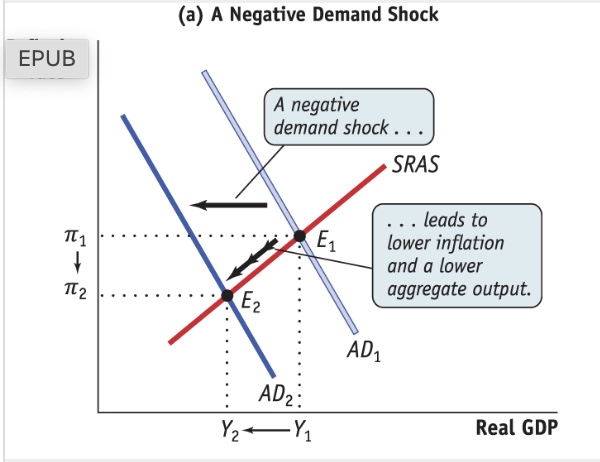
what happens in a negative demand shock?
shifts the aggregate demand curve, AD, to the left, from AD1 to AD2, as shown in panel (a). The economy moves down along the SRAS curve from E1 to E2, leading to lower short-run equilibrium aggregate output and a lower short-run equilibrium inflation rate.