AP Chem Unit 3: Properties of Substances and Mixtures Part 3
1/14
Earn XP
Description and Tags
Chromatography, Spectroscopy, Light & Wavelengths, Absorbance, Beer-Lambert Law
Name | Mastery | Learn | Test | Matching | Spaced | Call with Kai |
|---|
No analytics yet
Send a link to your students to track their progress
15 Terms
What is chromatography? Name the three types.
a method of separating a mixture of solutions based on polarity differences/solubility
Paper chromatography
Thin layer chromatography
Column chromatography
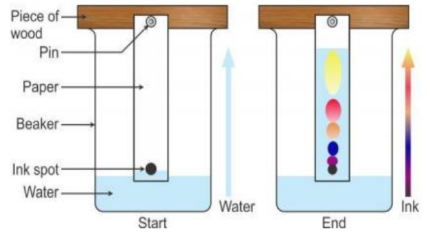
Paper Chromatography Methodology (5 Steps) + Analysis
A line is drawn (typically in pencil) near the end of a paper strip.
A drop of the sample is placed on the line.
The paper is placed in an, ideally, sealed container with a shallow layer of solvent. The solvent should touch the bottom of the paper but not the line. The stationary phase is the paper and the mobile phase is the solvent.
The solvent and dyes will separate as time passes. Remove the paper before the solvent reaches the top of the paper.
Measure the height of the leading edges of the solvent and each dye.
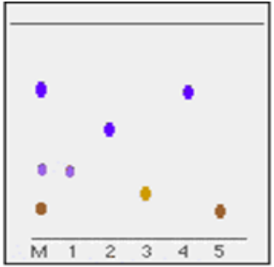
The more similarity in polarity that the sample is to the solvent, the farther it travels. With a polar solvent, polar samples travel farther than nonpolar samples. With a nonpolar solvent, nonpolar samples travel farther than polar samples.
The retention factor Rf is (distance traveled by sample/distance traveled by solvent). The sample can be identified by comparing Rf values (comparing distances is unreliable).
Thin Layer Chromatography Methodology + Analysis
Used for samples that are not colored to the naked eye (eg. amino acids).
The same as paper chromatography except instead of paper, it uses a thin layer of silica or alumina (typically, since these are extremely polar) on a sheet of plastic.
Use a solvent that flouresces under UV light.
Typically, nonpolar samples travel farther than polar samples. Sample is identified by comparing Rf values.
Column Chromatography Methodology + Analysis
Steel wool is placed at the bottom of a burette to prevent the gel from escaping. The burette is usually filled with (very polar) silica or alumina gel.
The mixture is placed at the top of the burette and flushed repeatedly with (usually) nonpolar solvent.
The mixture will separate and each phase is collected in a beaker or flask one at a time. (After one part is collected, a new solvent can be used to speed up the movement of the other parts.)
Nonpolar parts usually travel faster than polar parts.
This method is used more for separation than for analysis.
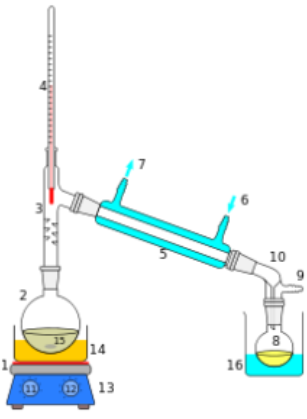
Distillation
physically separates mixtures based on differences in boiling point and intermolecular forces
If the boiling points are close together, use fractional distillation which allows the vapor to condense and revaporize several times for better purification.
Distillation can be used to distill fermented beverages, desalinate salt water, and separate crude oil into fuels and other petroleum products (often through fractional distillation).
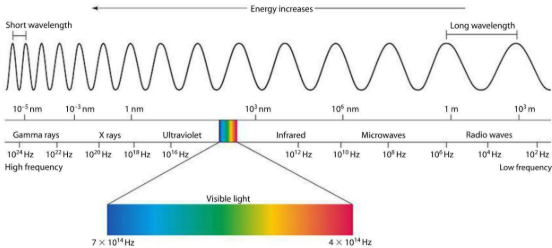
Spectroscopy
the study of how matter interacts with electromagnetic radiation
Electromagnetic radiation is classified into different types based on wavelength or frequency of the radiation.
Different Types of Molecular Movement
Translational: moving from place to place
Rotational: spinning in place
Vibration: moving in place (includes internal movements of atoms within the molecule like bending and stretching)
Molecular Movement and Spectroscopy
Microwave Rotational Spectroscopy: Microwave radiation causes molecules to rotate
Infrared Vibrational Spectroscopy: Infrared radiation causes molecules to vibrate
Ultraviolet - Visible Light Spectroscopy: Ultraviolet/visible radiation causes electrons to move from ground state to excited state. The sample solution being observed should have color.
In terms of energy from lowest to highest: microwave < infrared < visible light
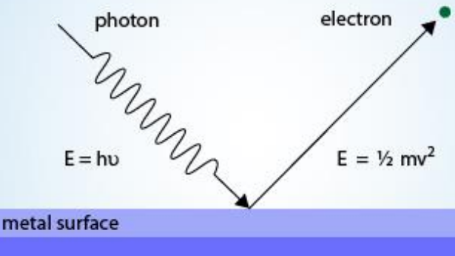
Photoelectric Effect
when light shines on the surface of metal and causes electrons to be ejected from the surface
When a photon is absorbed/emitted, the energy of the atom is increased/decreased by the same amount of energy.
The threshold wavelength is the longest wavelength that will still eject an electron. The total energy of a photon is the binding energy plus the kinetic energy (KE = ½mv2) of the ejected electron.
Binding Energy
The energy needed to remove a particle such as an electron
Higher binding energy indicates that the electrons are closer to the nucleus or that the nucleus has a higher charge.
Planck’s Equation
E = hv
E: energy of the photon in joules
h: Planck’s constant, 6.626 × 10⁻³⁴ J*s
v: frequency in Hz or s-1
Wavelength and energy have an inversely proportional relationship.
Electromagnetic Wave Equation
c = λν
c: speed of light, 3.0 × 10⁸ m/s
λ: wavelength in m or nm
ν: frequency in Hz or s-1
Wavelength and frequency have an inversely proportional relationship.
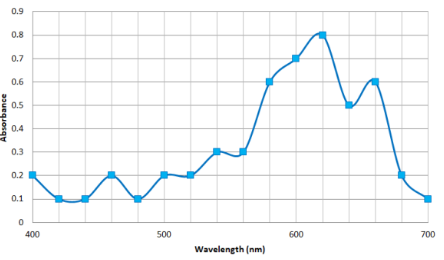
Absorbance
the measure of the light that is stopped/absorbed by a solution
It can be measured by using a spectrophotometer or a colorimeter, which compare the amount of light passing through a solution to the amount that can pass through a pure solvent.
Solutions absorb certain wavelengths of light and will appear as the complementary color to the color they absorb. You should measure the complementary color to the color of the solution. (Red and green are complementary colors, so for a red solution, you should measure the amount of green light.)
When given an absorption spectrum graph, the best wavelength for accurate measurements is the wavelength of maximum absorbance λmax where the absorbance is closest to 1 (though it should not exceed 1).
Spectrophotometer
The spectrophotometer must first be calibrated by using a blank that only contains solvent.
Then, using standard solution concentrations and their corresponding absorbance value, create a calibration graph to determine the molar absorptivity constant.
Lastly, use the spectrophotometer to measure the absorbance for the unknown sample. Determine the concentration from the calibration graph.
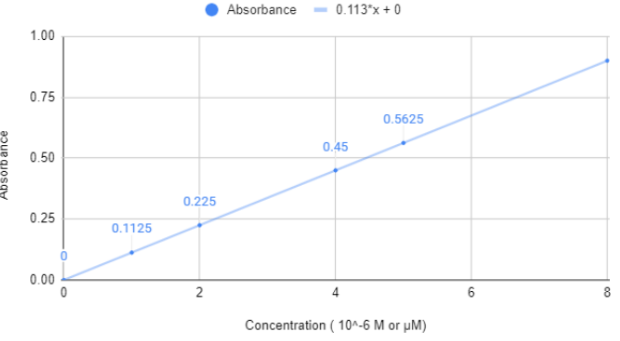
Beer-Lambert Law
the quantity of light absorbed by a substance is directly proportional to its concentration (path length and wavelength are usually held constant so that absorbance is directly proportional to concentration)
A = Ɛbc
A: absorbance
Ɛ: molar absorptivity constant
b: path length, or the width of the cuvette that the sample is placed in
c: concentration