Semester 2 - EA (macro)
1/44
There's no tags or description
Looks like no tags are added yet.
Name | Mastery | Learn | Test | Matching | Spaced | Call with Kai |
|---|
No analytics yet
Send a link to your students to track their progress
45 Terms
GDP & CIRCULAR FLOW OF INCOME
GDP & CIRCULAR FLOW OF INCOME
What is macroeconomics?
Focuses on performance of national economy
And gov. policies used to try and improve performance of that country
What are the 4 main topics covered?
Economic growth - long run (GDP)
Economic growth - short run (business cycles, e.g. recession, depression, boom, recovery)
Inflation & unemployment (short/long run)
Macroeconomic policy (fiscal & monetary)
What is GDP?
GDP = market value of all final goods & services produced in a country in a given time period
e.g.
a car = counts as GDP
tires, steering wheel = intermediate good (NOT GDP)
What is GNP?
GNP = British firm producing in a foreign country (e.g. British firm producing in Japan)
gross = before depreciation (of capital)
net = after depreciation (of capital)
depreciation = decrease in value of a firm’s capital due to wear/tear & obsolesce
gross = before depreciation (of capital)
net = after depreciation (of capital)
depreciation = decrease in value of a firm’s capital due to wear/tear & obsolesce
Describe the 2 ways to measure GDP:
Expenditure approach - aggregate expenditure
Income approach - aggregate income
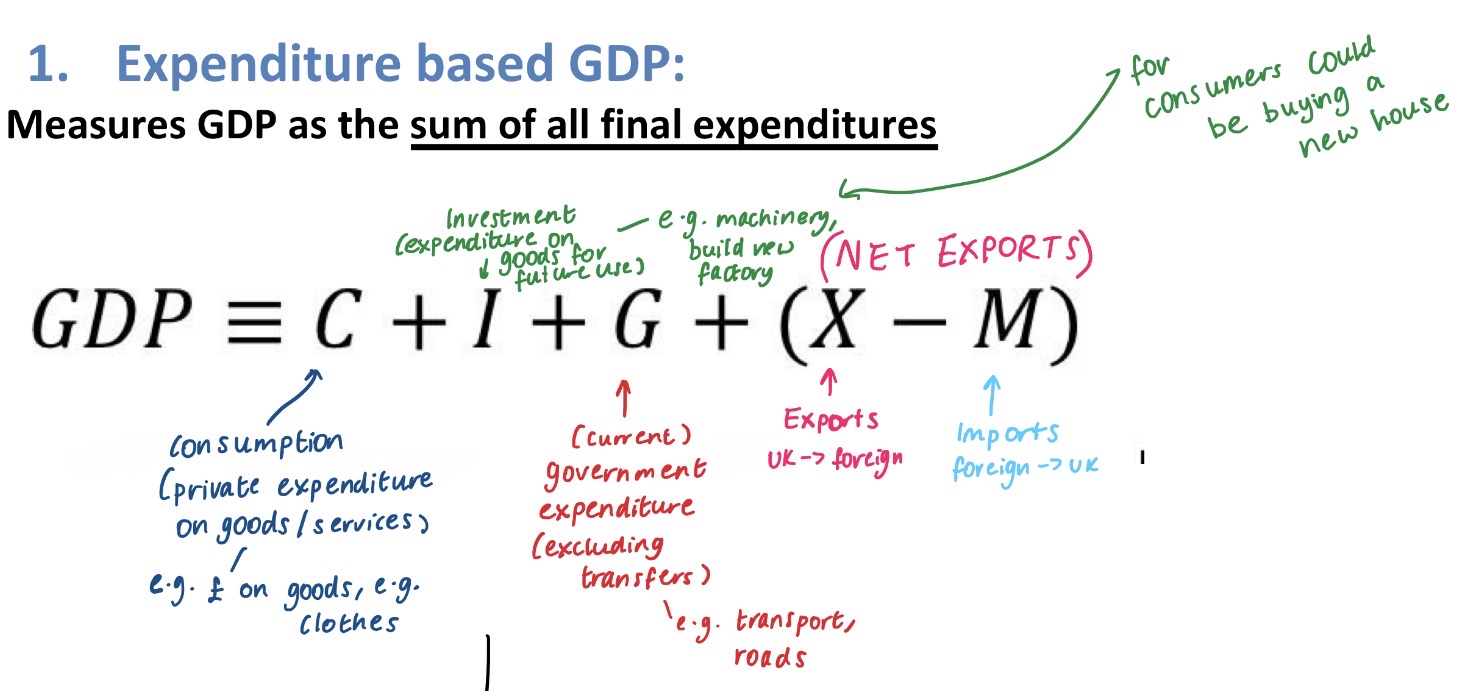
Expenditure approach = sum of all final expenditures
Income approach = sum of incomes firms pay to households for the FOP they hire - indirect taxes/subsidies:
Compensation of employees (wages to households, FOP = labour)
Gross operating surpluses (profits of firms, FOP = entrepreneurship)
Mixed incomes (income from self-employment or rental income, FOP = land, capital)
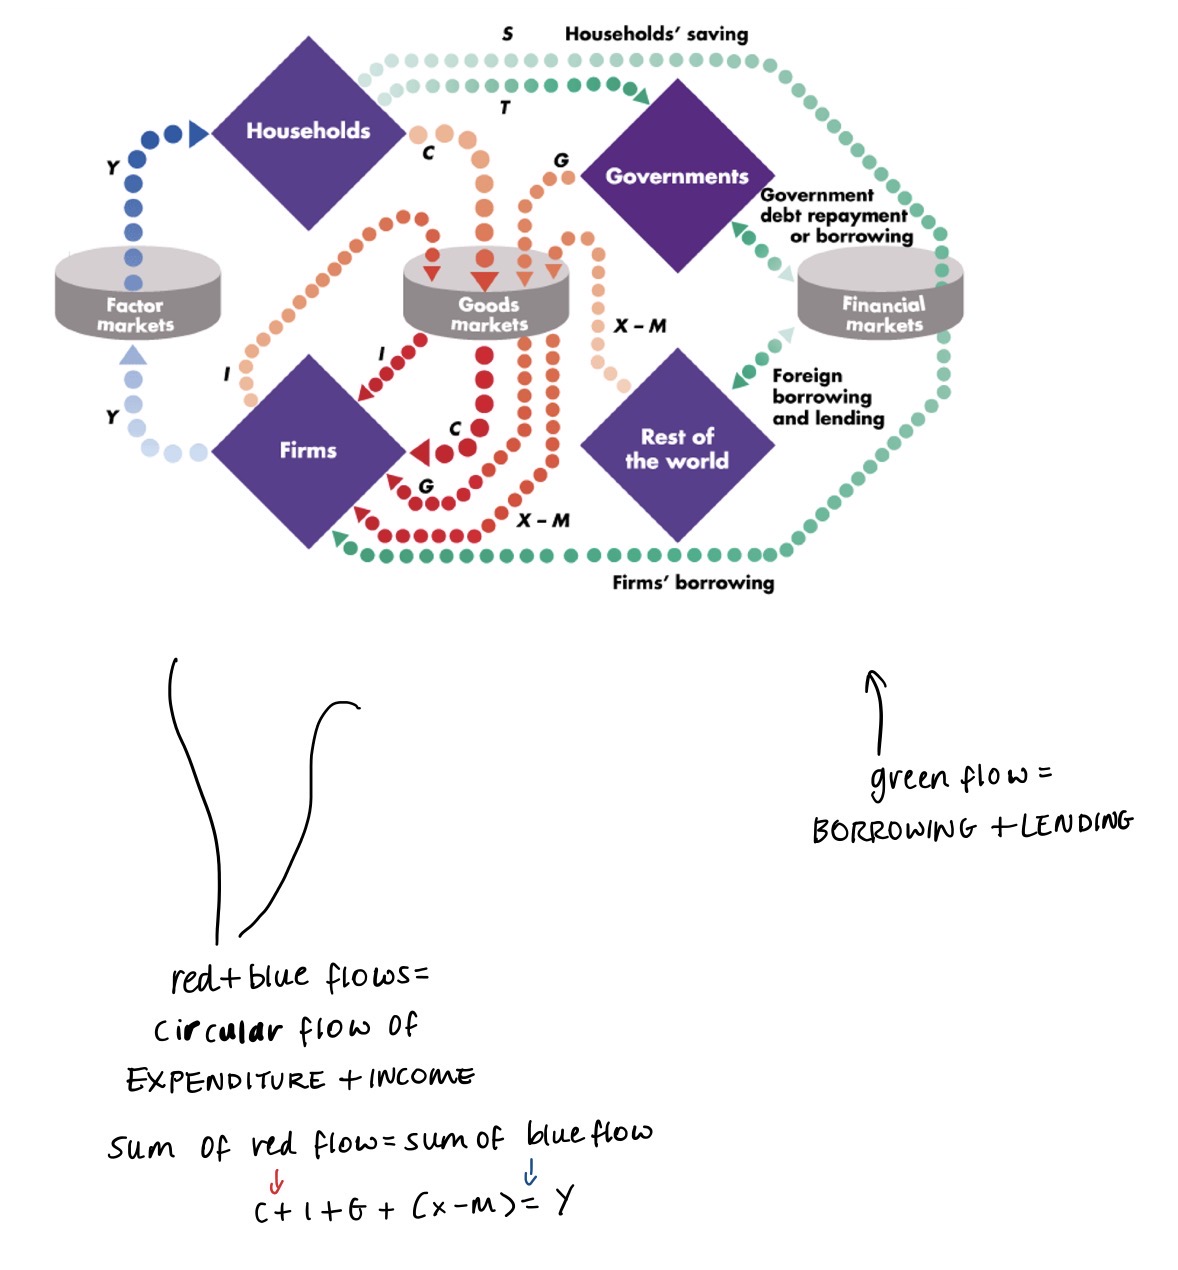
Circular flow of income, describe:
2 sector economy
3 sector economy
4 sector economy
*+leakages and injections*
2 sector economy = firms & households
Injection = investment from firms
Leakage = savings from consumers
3 sector economy = firms & households & government
Injection = gov. spending
Leakage = taxes
4 sector economy = firms & households & government & foreign sector
Injection = exports
Leakage = imports
What are the 2 types of GDP:
Nominal GDP
Real GDP
Nominal (current prices) = value of goods/services produced during a given year using the prices of that same year
Nominal = money terms
Real (constant prices) = value of goods/services produced in a given year using the prices of a base year
Measures actual physical volume of production - *THIS BETTER*
ECONOMIC GROWTH
ECONOMIC GROWTH
What are the 2 time periods we look at when looking at economic growth?
Long run - all variables can vary, e.g. GDP
Short run - one variable fixed, rest can vary, .e.g. business cycles i.e. recession
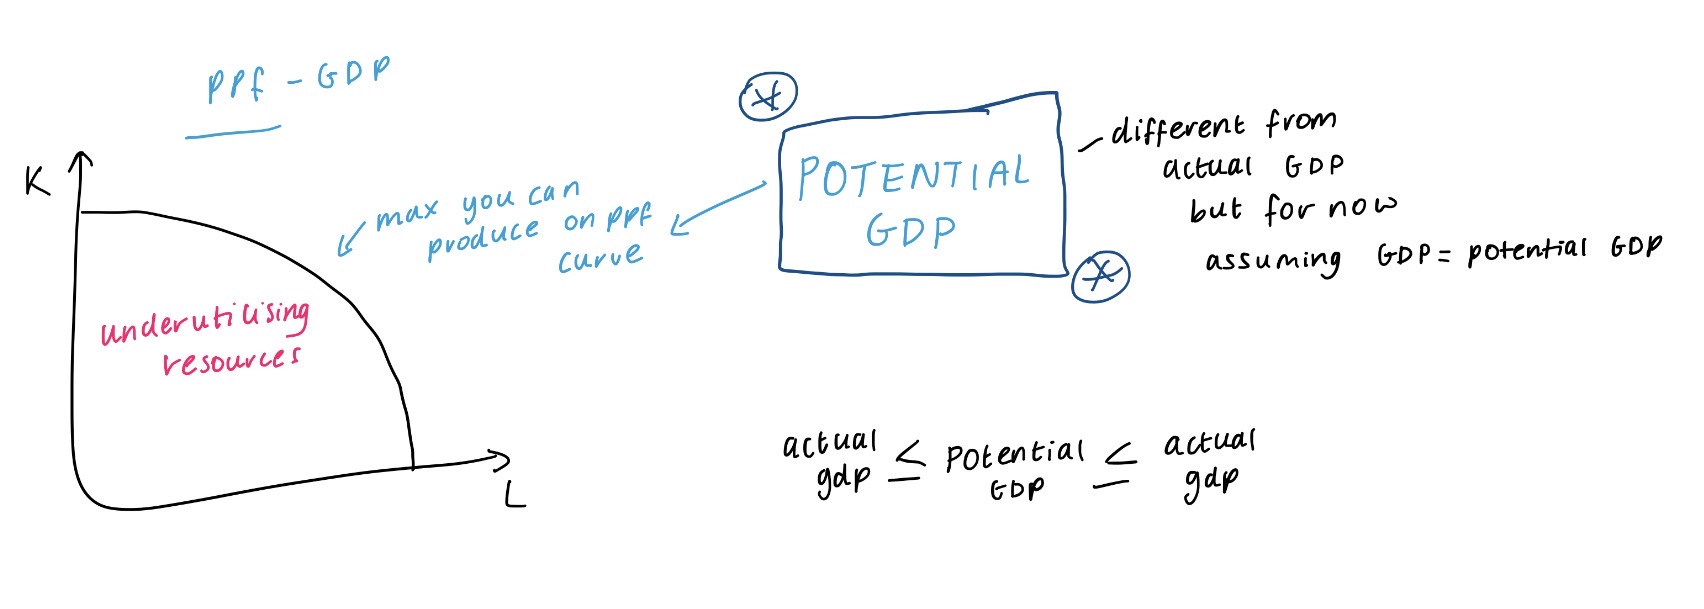
How does PPF link to GDP/economic growth?
Economic growth is all about finding ways to expand the PPF
On PPF curve = potential GDP for an economy
Under PPF curve = underutilising resources so not at potential GDP
What type of GDP do we use to measure economic growth?
What are the 2 factors that cause economic growth?
Real GDP
2 factors:
Quantity increased of resources used - e.g. larger labour force, more use of land/natural resources, more physical capital (e.g. machinery), etc.
Productivity increased of resources used - e.g. tech change, better management, gov. policies better, exploiting EOS
What are the main:
Benefits of growth
Costs of growth
SPEB
Benefits:
SOL - increased so means more time for leisure, access to better products as more affordable, etc.
Poverty - reduce absolute poverty & makes relative poverty easier to tackle (redistribution of wealth)
Costs:
Environmental factors - pollution, non-renewable resources, littering, etc.
Broken society - growth not equally distributed, e.g. north south divide in UK > leads to crime
What does the neoclassical model suggest about economic growth?
Neoclassical growth theory explains that a steady economic growth rate depends on labour, capital, and technology
Theory highlights technological change as crucial for sustaining long-term economic growth
As capital and labor increase, their returns diminish unless technological innovation boosts productivity
Describe the neoclassical growth model:
Different aspects of model
Key assumptions (5)
Equilibrium
Long run - FOP variable so constant returns to scale (K,L) - output will increase by the same proportion as in the increase in K,L (inputs)
Closed economy - Y = C + I
Y = Yp
s = i - fraction of income saved/invested constant (small)
Constant variables - e.g. population, savings rate, hours worked, human capital (education, training), tech advancement, etc.
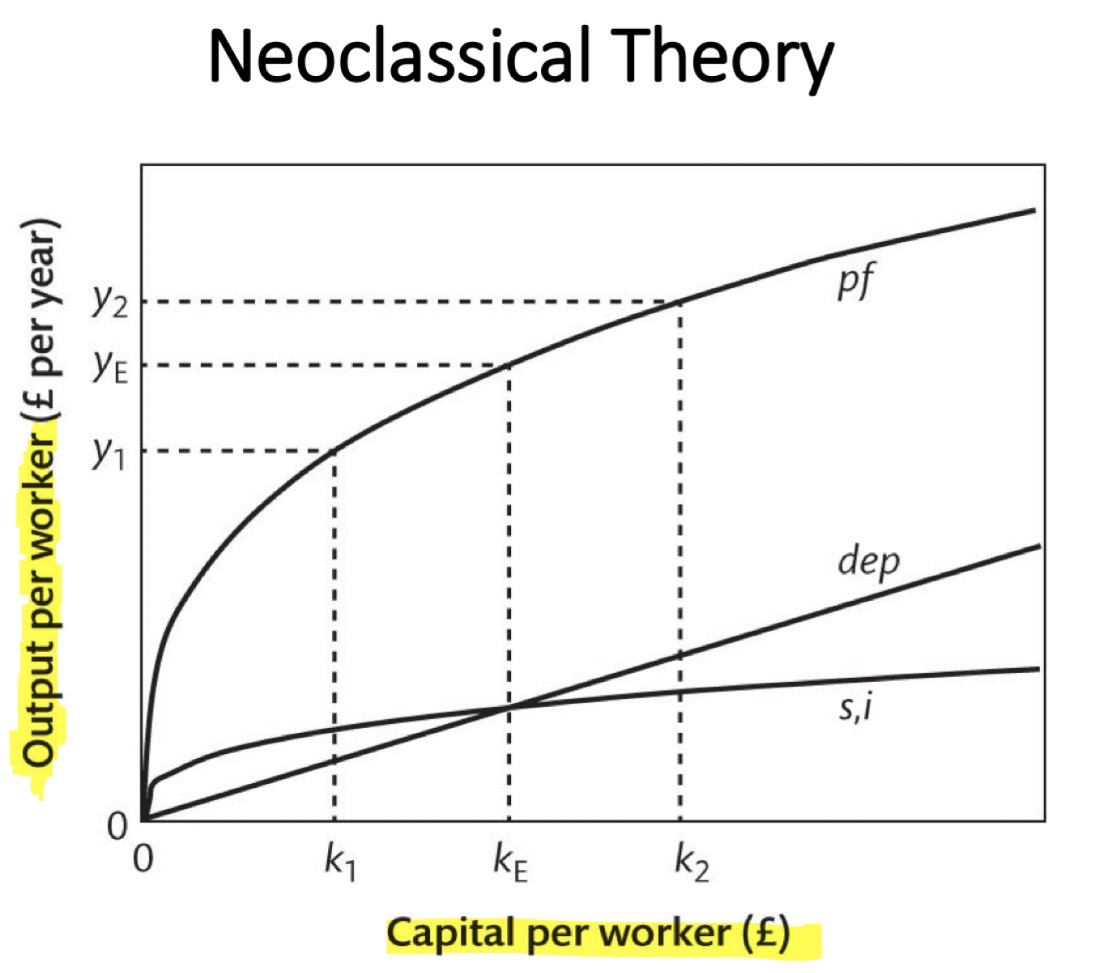
Why in the neoclassical growth model is the PPF concave?
Diminishing returns to capital
As the amount of capital used increases, so does output and therefore productivity
However, at a DECREASING RATE
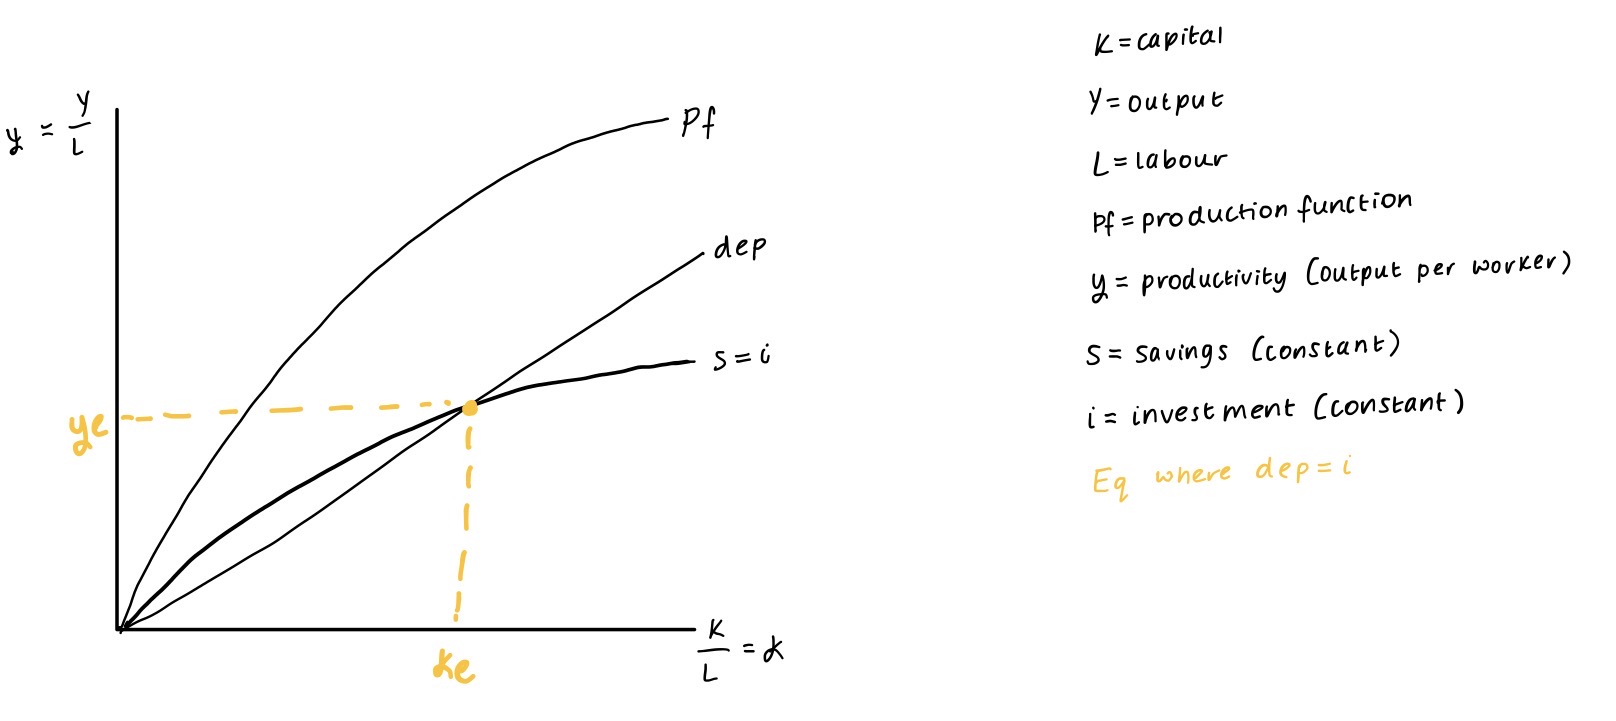
Describe where the equilibrium occurs in the neoclassical growth model and how it returns when:
i > dep
dep > i
Equilibrium is where i = dep, known as the steady state (level of production)
At k1, y1 we know i > dep (capital deepening):
Purchase of new capital > replacing depreciating capital
E.g. if i = 20 machines but dep = 15 machines
Therefore, K/L increases (more capital per labour) so K1 >
Productivity increases = econ growth = Yp equilibrium
At k2, y2 we know dep > i:
Replacing depreciating capital > purchase of new capital
E.g. if i = 15 machines but dep = 20 machines
Therefore, K/L decreases (less capital per labour) so K2 > Ke
Returns to equilibrium of Yp
What is capital accumulation?
What are the 2 types of capital accumulation?
Capital accumulation = increase in the economy’s stock of capital (machines, infrastructure, etc.) over time (when i > dep)
Capital deepening = capital per worker increases (K/L increases) > leads to higher productivity
Capital widening = maintains same level of capital per worker - capital increases constant to keep up with labour increases (K/L constant) > prevents productivity falling
give extra machines to existing workers (deepening)
give machines to new workers (widening)
When we relax the assumptions, what are the 3 ONE-OFF changes to the diagram we can make?
Swivel in depreciation curve - (dep + cw)
Population change
Shift in s,i curve
Change in savings ratio (higher saving rate)
Shift in pf curve - (as well as s,i curve)
Change in working hours
Change in human capital
Change in technology advancement
Assumption - population constant
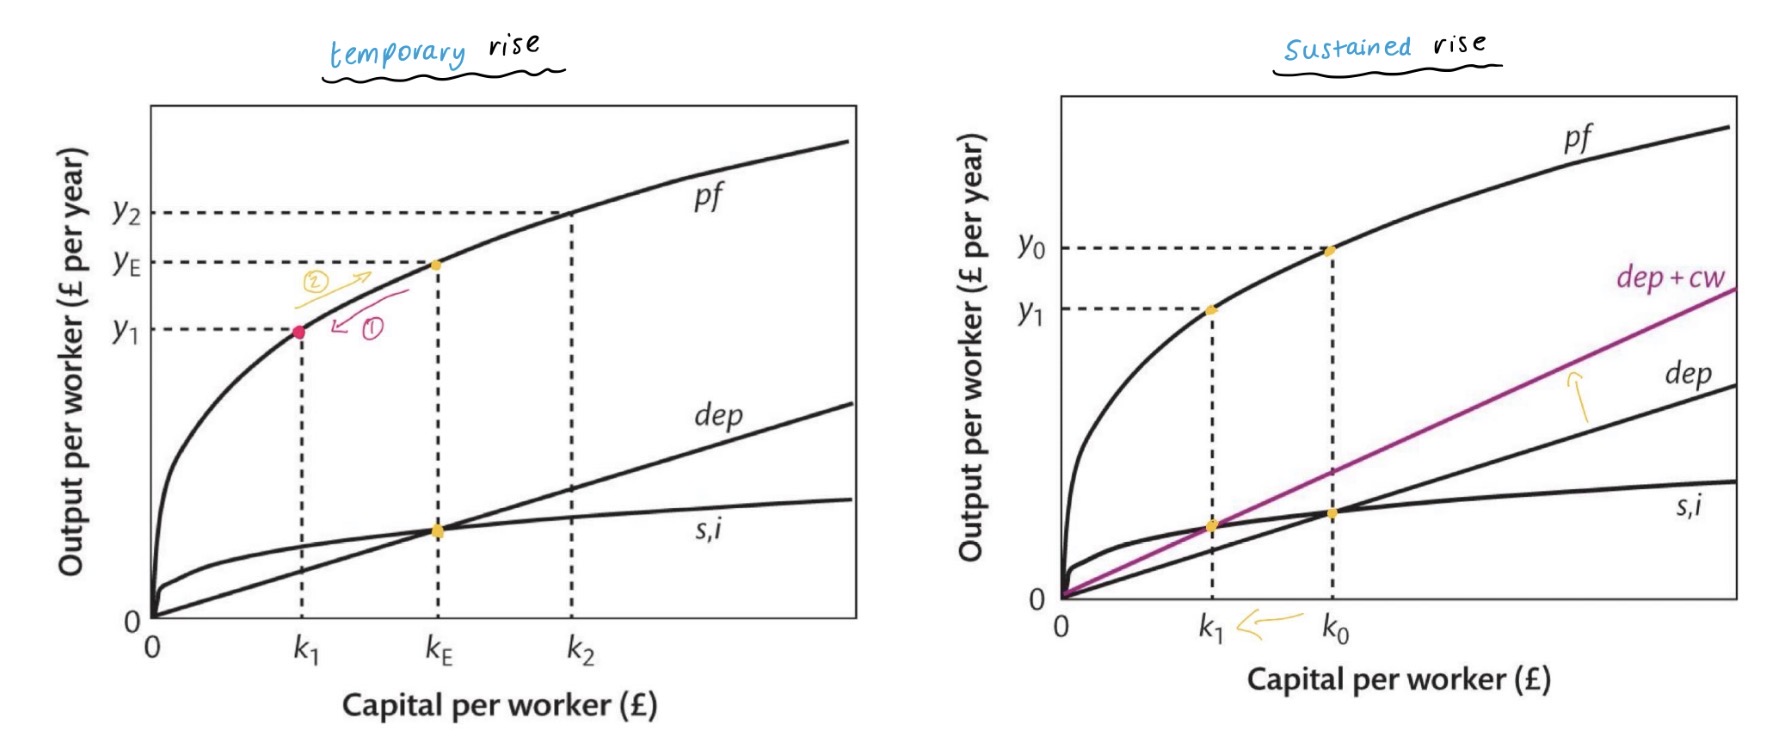
When population is relaxed, describe & show on a graph:
Temporary rise in population
Sustained growth in population
Temporary rise in population (shock to economy, one-off rise):
Population change - e.g. sudden spike in birth rate, surge in immigration
Disequilibrium - initially capital per worker falls as L increases instantly but K only changes gradually through investment (ke to k1) so output per worker falls/productivity reduces (ye to y1)
Capital widening - at k1, i > dep so capital begins to accumulate to keep up with labour increases, leading to more capital per worker
Steady state - returns to equilibrium (ke, ye) and productivity is prevented from a sustained fall
Sustained growth in population:
Population change - population continually rising
Disequilibrium - (same description as above)
Line swivels - therefore, as population continually rising, capital widening will become constant to keep up extra capital for increasing labour force, so dep line will swivel upwards, to make dep + cw (necessary to allow dep + cw to maintain any given level of capital per worker)
New equilibrium - where i = dep + cw, so y will be permanently lower (at y1) so productivity will fall (doesn’t necessarily mean GDP will fall)
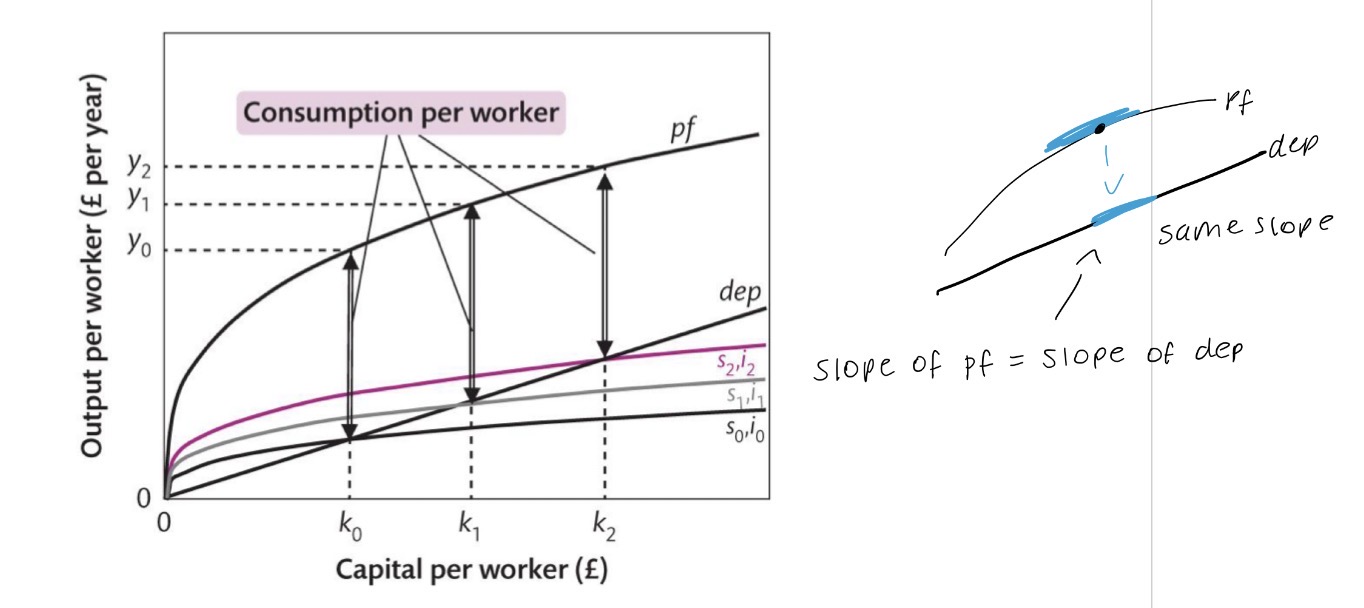
Assumption - savings rate constant
When savings rate is relaxed, describe & show on a diagram:
Higher saving ratio
Saving rate increases - e.g. 10% > 20% OR increases limit £20k > £30k
Shift s,i curve upwards - will keep increasing output per worker/productivity (y1 > y2 > y3 … ), however, will alternatively decrease consumption every time it rises (Y = c + i) so gap between Y and i becomes smaller
SO, golden rule is where slope of dep = slope of pf
Below golden rule - ↑ capital & ↑ consumption
Golden rule (optimum saving ratio) - ↑ capital (allows savings to grow) and max consumption
Above golden rule - ↑ capital but ↓ consumption
*therefore, a rise in the proportion saved/(invested) will result in a one-off rise in output per worker, but not sustained growth*
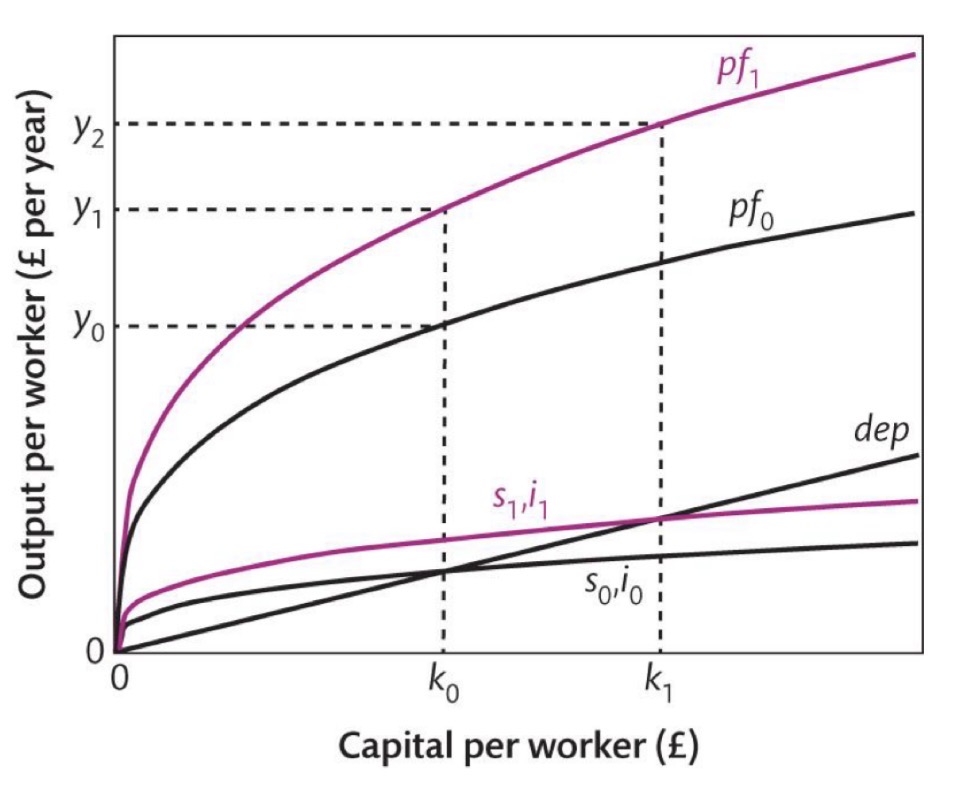
Assumption - working hours, human capital & technological change constant
When WH, HC & TC is relaxed, describe & show on a diagram:
One-off rise in working hours
One-off rise in human capital
One-off technological change
Change - WH, HC & TC all rise/improve
Shift in pf curve upwards - stay at k0 but output per worker increases from y0 to y1
Shift in s,i curve upwards - as output increases, a constant fraction of a larger output is saved/invested so this shifts upwards, shifting k0 to k1, further increasing productivity from y1 to y2
New equilibrium - at k1, y2 (steady state)
*however, this is only a one-off increase in productivity, if want sustained growth probably best to improve technology further rather than the other 2*
What do the 2 theories argue about how to sustain GDP growth?
Exogenous theory (neoclassical growth model)
Endogenous theory (Ak model)
Both theories believe sustained economic growth requires continuous technological progress
Exogenous theory = technological progress is exogenous (cannot be explained in model as comes from outside it)
Factors inside model only explain temporary growth e.g. saving, investment, population growth
Endogenous theory = technological progress is endogenous (can be explained by the variables in the model)
Factors inside the model can explain permanent growth, e.g:
> population growth - more people employed in R&D > leads to new ideas/innovation
> saving, investing - more money for R&D
Describe how
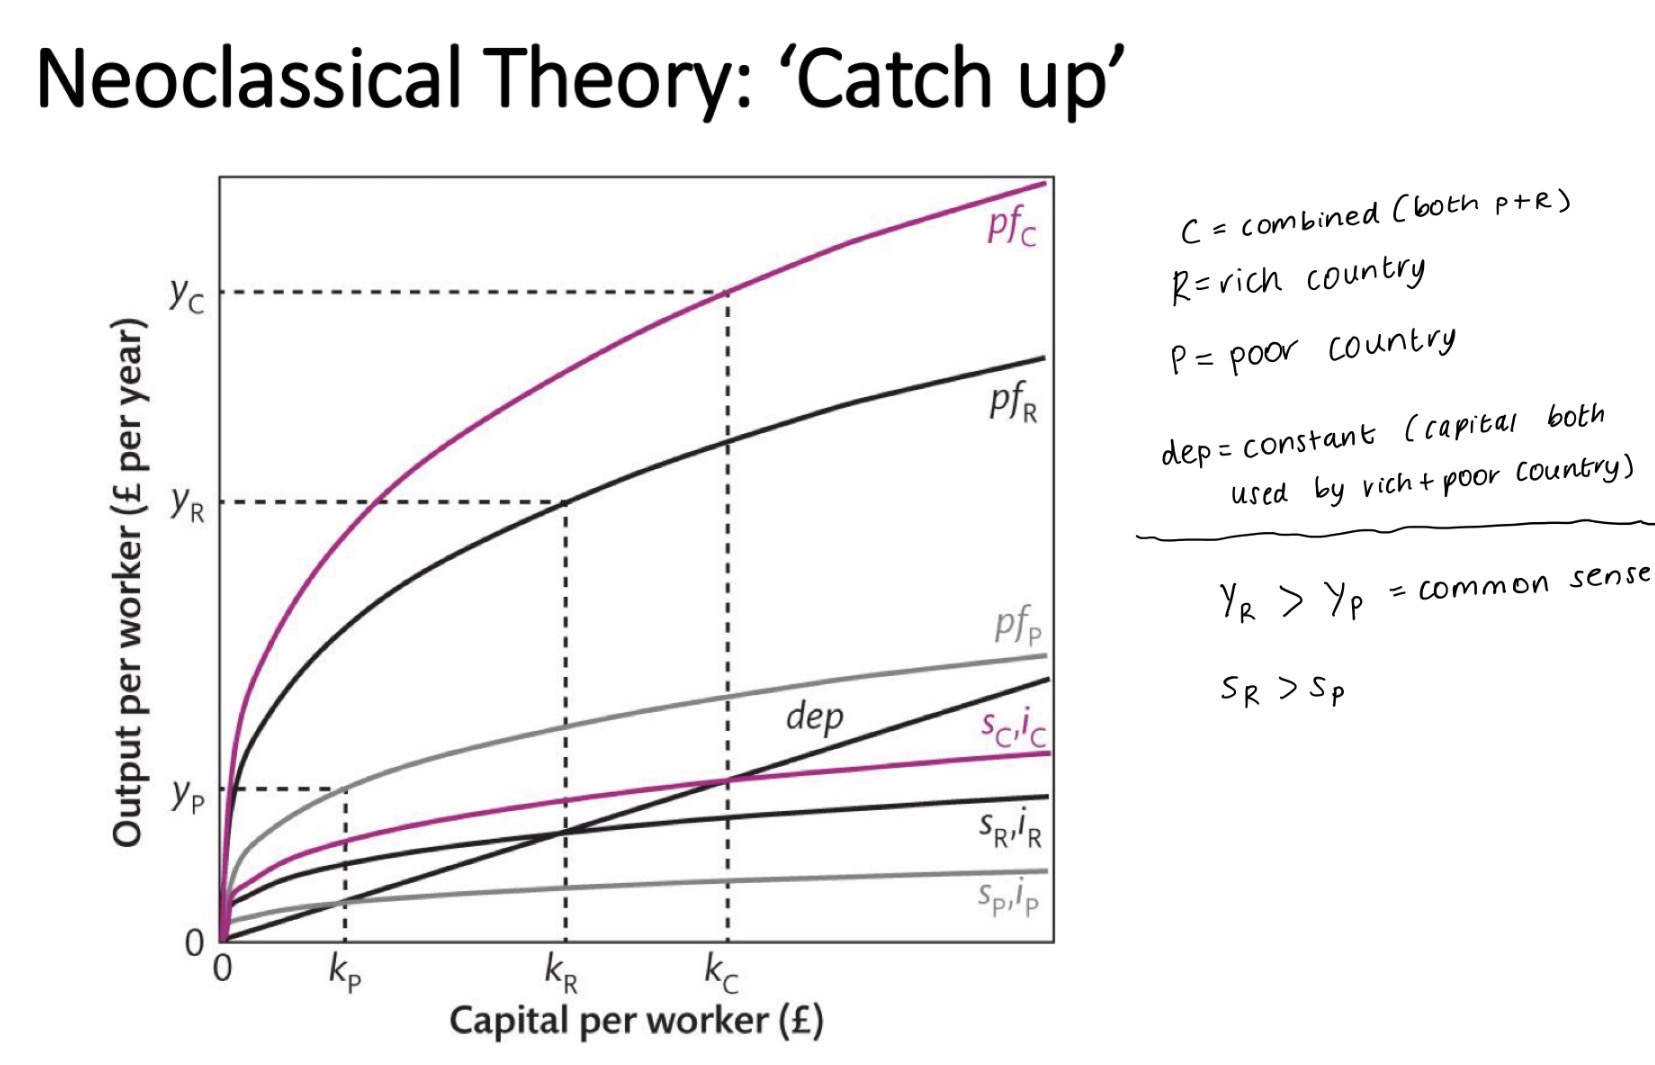
What is the neoclassical theory about why growth rates (due to technological change) differ between countries (‘catch up’)?
Technology transfer - help countries/firms ‘catch up’ and ‘close the gap’
Tech progress can be quicker in poor countries than rich countries as PC can copy the RC
RC can invest in R+D - PC can copy technology > ↑output & ↑capital at same time
So both end up at PFc due to technology transfer
E.g. China
*can’t always happen in PC - may be hindered by pop growth, political instability and low funds, etc.*
AGGREGATE EXPENDITURE & THE MULTIPLIER
AGGREGATE EXPENDITURE & THE MULTIPLIER
What is the equation for aggregate expenditure?
What is the key assumption?
AE = real output = real GDP
AE = C + I + G + (X-M)
key assumption = prices are fixed
What is disposable income comprised of & what can happen to it (in macro)?
Yd = Y - T and it can either Yd = C + S
Y = aggregate income/GDP
T = total tax revenue
C = consumed
S = saved
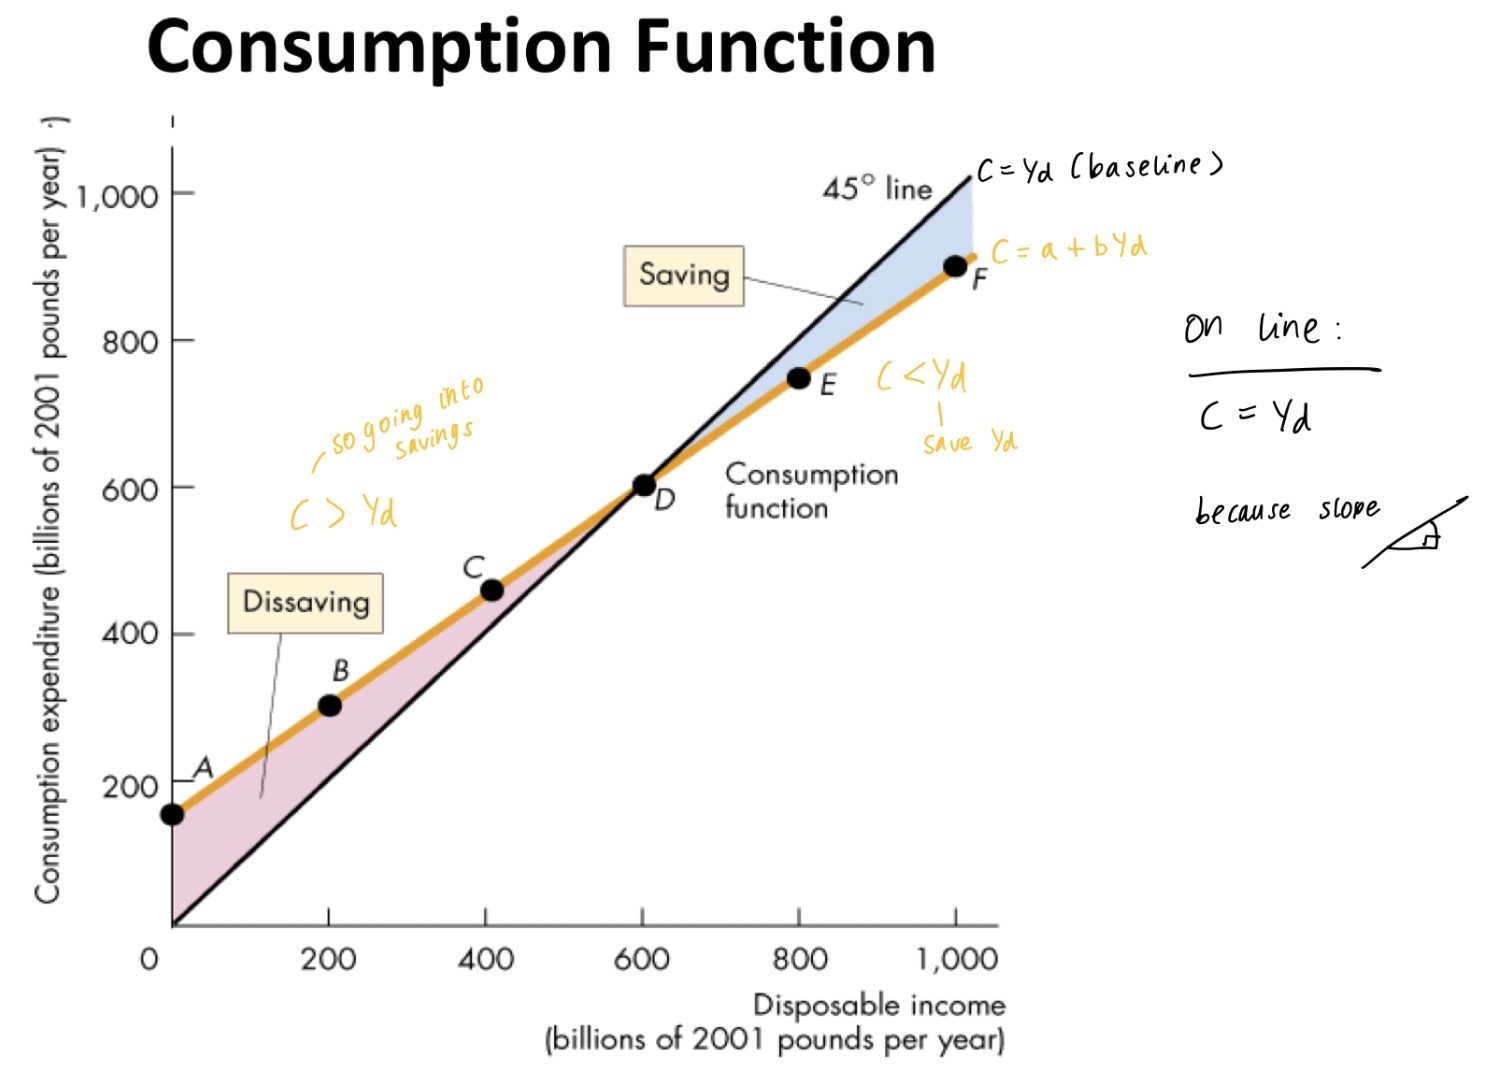
Consumption function:
What is the function?
Describe it diagrammatically.
C = a + bYd
C = consumption
a (intercept) = autonomous consumption > independent of income so have to pay regardless of Y, e.g. bills
b (slope) = induced consumption > induced by income so if income ↑£1, then consumption will increase by b (0 < b < 1)
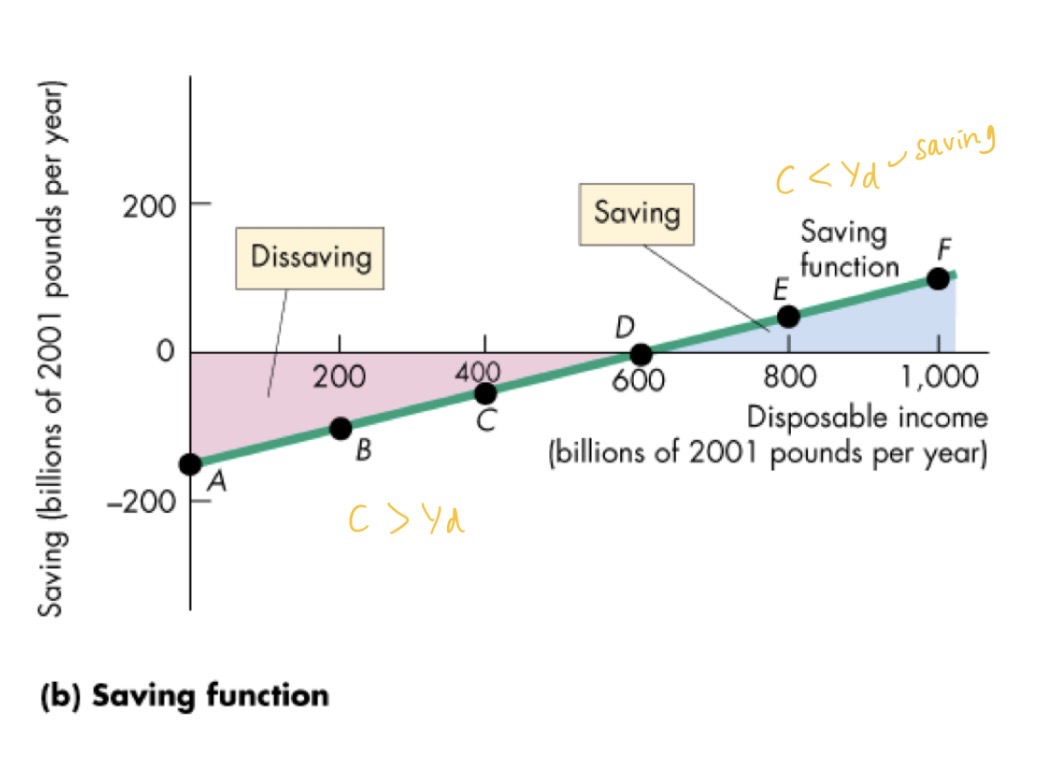
Savings function:
What is the function?
Describe it diagrammatically.
S = -a + (1-b)Yd
S = savings
-a (intercept) = independent of income so when income = 0, savings will be negative (just consuming a)
b (slope) = induced by income so if income ↑£1, then savings will increase by 1-b (0 < 1-b < 1)
What is the marginal propensity to:
Consume (MPC)
Save (MPS)
Import (MPM)
MPC = increase in consumption from an additional £1 in disposable income = slope (b)
mpc = ∆C/∆Yd
MPS = increase in saving from an additional £1 in disposable income = slope (1-b)
mps = ∆S/∆Yd
MPM = increase in imports from an additional £1 in economy’s income = slope (t)
mpm = ∆M/∆Yd
*triangle on a straight line when look at change in y and x*
What are the 2 components of investment?
Expenditure on new capital goods - e.g. buying physical capital i.e. machinery
Expenditure on adding new stocks - e.g. build up stock of unsold goods (inventories)
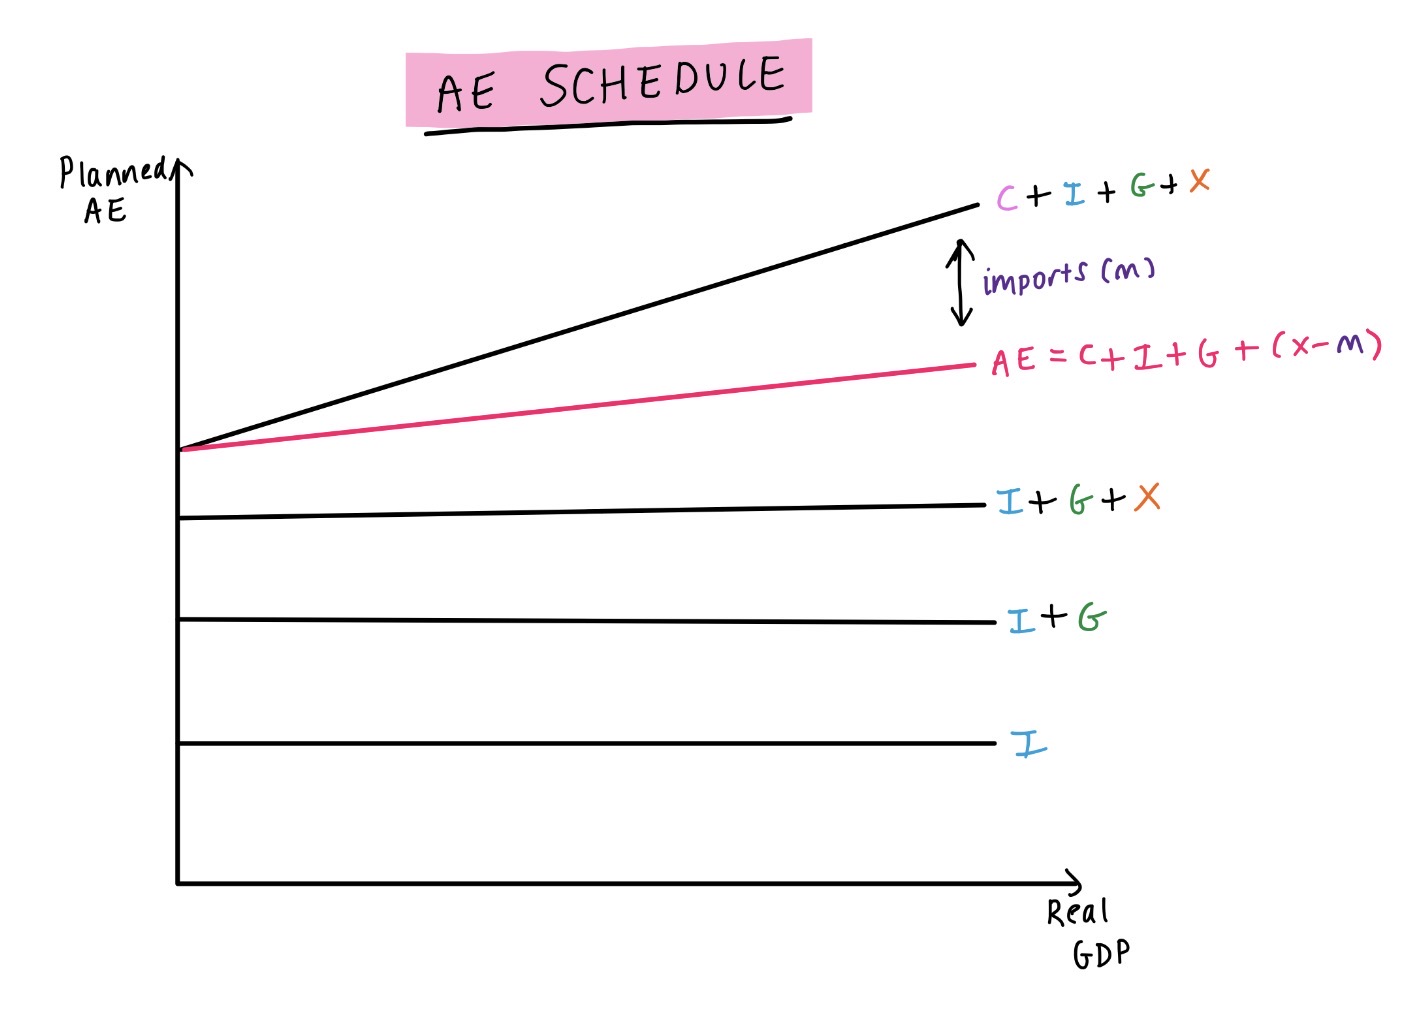
Keynesian cross:
What is the aggregate expenditure schedule?
What assumptions are made (prices, expenditures - autonomous or induced)?
Show how it is formed diagrammatically.
Aggregate expenditure schedule = shows relationship between planned AE and real GDP
Assumptions:
> Prices sticky (fixed)
> Autonomous expenditure (fixed bc independent on GDP):
Consumption
Investment
Gov. spending
Exports
> Induced expenditure (change bc depend on GDP):
Consumption
Imports (MPI)
Keynesian cross:
When is GDP at equilibrium (equilibrium expenditure)?
When is GDP at disequilibrium (unplanned changes to inventories)?
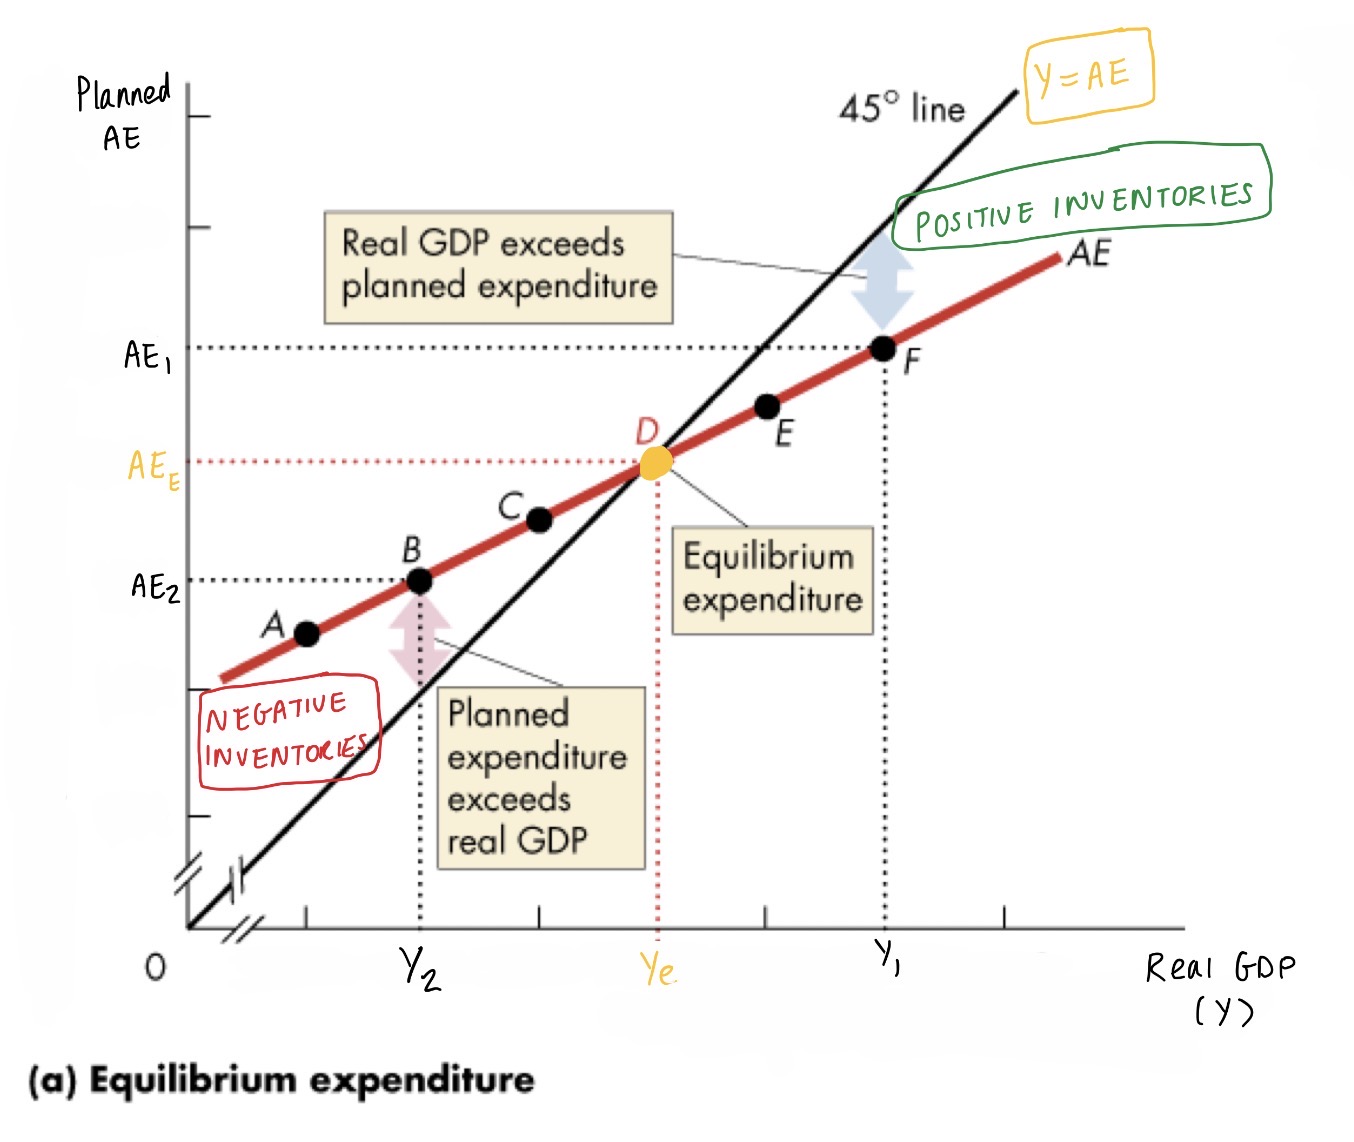
Equilibrium is when Y = AE
(planned AE = real GDP) - however, sometimes actual AE doesn’t equal planned AE which causes unplanned changes to inventories
> GDP > planned AE (AE curve is below 45° line):
Positive inventories - firms have unplanned INCREASE in inventories
Firms ↓production & ↓workforce > GDP FALLS (from Y1 to Ye)
> planned AE > GDP (AE curve is above 45° line):
Negative inventories - firms have unplanned DECREASE in inventories
Firms ↑production & ↑workforce > GDP RISES (from Y2 to Ye)
Keynesian cross:
What causes a parallel shift in the AE schedule line?
What is the effect of an upwards parallel shift of AE?
What is the effect of a downwards parallel shift of AE?
A change in autonomous expenditure (C[a], I, G, X)
> AE schedule shifts upwards:
Increase in autonomous expenditure
E.g. policies to increase consumer consumption, more government spending on hospitals, roads, better trade deals to increase exports, etc.
↑GDP (Ye > Ye2) and ↑planned AE (AEe > AE2)
Could help an economy get out of a recession - *spending (left of politics)*
> AE schedule shifts downwards:
Decrease in autonomous expenditure
E.g. decreasing consumer/business confidence!!!!, less government spending, end of trade deals, etc.
↓GDP (Ye > Y3) and ↓planned AE (AEe > AE3)
![<p><strong><u>A change in autonomous expenditure (C[a], I, G, X)</u></strong></p><p></p><p>> <span style="color: rgb(44, 174, 21);"><strong>AE schedule shifts upwards:</strong></span></p><ul><li><p>Increase in autonomous expenditure</p></li><li><p>E.g. policies to increase consumer consumption, more government spending on hospitals, roads, better trade deals to increase exports, etc. </p></li><li><p>↑GDP (Y<sub>e</sub> > Y<sub>e2</sub>) and ↑planned AE (AE<sub>e</sub> > AE<sub>2</sub>) </p></li><li><p>Could help an economy get out of a recession - *<em>spending (left of politics)</em>*</p></li></ul><p></p><p>> <span style="color: rgb(241, 70, 70);"><strong>AE schedule shifts downwards:</strong></span></p><ul><li><p>Decrease in autonomous expenditure </p></li><li><p>E.g. decreasing consumer/business confidence!!!!, less government spending, end of trade deals, etc.</p></li><li><p>↓GDP (Y<sub>e</sub> > Y<sub>3</sub>) and ↓planned AE (AE<sub>e</sub> > AE<sub>3</sub>)</p></li></ul><p></p>](https://assets.knowt.com/user-attachments/b7eaf730-2adf-4957-b4dc-85b48351f769.jpg)
Keynesian cross:
What causes a pivot in the AE schedule line?
What is the effect of an upwards swivel of AE?
What is the effect of a downwards swivel of AE?
A change in induced expenditure (C[b/mpc], M[mpm], T[mpt])
> AE schedule swivels upwards:
MPC increases at each level of income
MPM and MTR decreases - e.g. taxed less so spend more
↑GDP (Ye > Ye2) and ↑planned AE (AEe > AE2)
> AE schedule swivels downwards:
MPC decreases at each level of income
MPM and MTR increases - e.g. taxes more so spend less
↓GDP (Ye > Y3) and ↓planned AE (AEe > AE3)
![<p><strong><u>A change in induced expenditure (C[b/mpc], M[mpm], T[mpt])</u></strong></p><p></p><p>> <span style="color: rgb(21, 181, 79);"><strong>AE schedule swivels upwards:</strong></span></p><ul><li><p>MPC increases at each level of income</p></li><li><p>MPM and MTR decreases - e.g. taxed less so spend more</p></li><li><p>↑GDP (Y<sub>e</sub> > Y<sub>e2</sub>) and ↑planned AE (AE<sub>e</sub> > AE<sub>2</sub>)</p></li></ul><p></p><p>> <span style="color: rgb(200, 46, 46);"><strong>AE schedule swivels downwards:</strong></span></p><ul><li><p>MPC decreases at each level of income</p></li><li><p>MPM and MTR increases - e.g. taxes more so spend less </p></li><li><p>↓GDP (Y<sub>e</sub> > Y<sub>3</sub>) and ↓planned AE (AE<sub>e</sub> > AE<sub>3</sub>)</p></li></ul><p></p>](https://assets.knowt.com/user-attachments/9d740b1e-8744-4728-8b99-3ea44261741d.jpg)
Keynesian cross:
What is the expenditure multiplier (multiplier effect)?
Using a diagram, explain why this happens.
Multiplier effect = where an increase in autonomous investment will have a multiplied (magnified) effect on real GDP, amplifying the original expenditure
An increase in any component of autonomous expenditure (C,I,G,X, e.g. ↑gov. spending) will shift AE upwards and ↑real GDP (output)
Part of the output will be consumed (C = a + bY)
So, an ↑real GDP will lead to an increase in induced expenditure via consumption (bΔG as b times the change in Y)
Higher C leads to a further ↑real GDP & ↑AE
Overall - real GDP increases by more than the initial increase in autonomous expenditure, e.g. if gov. spending increases by £50 billion, real GDP will increase by more than £50 billion
Keynesian cross:
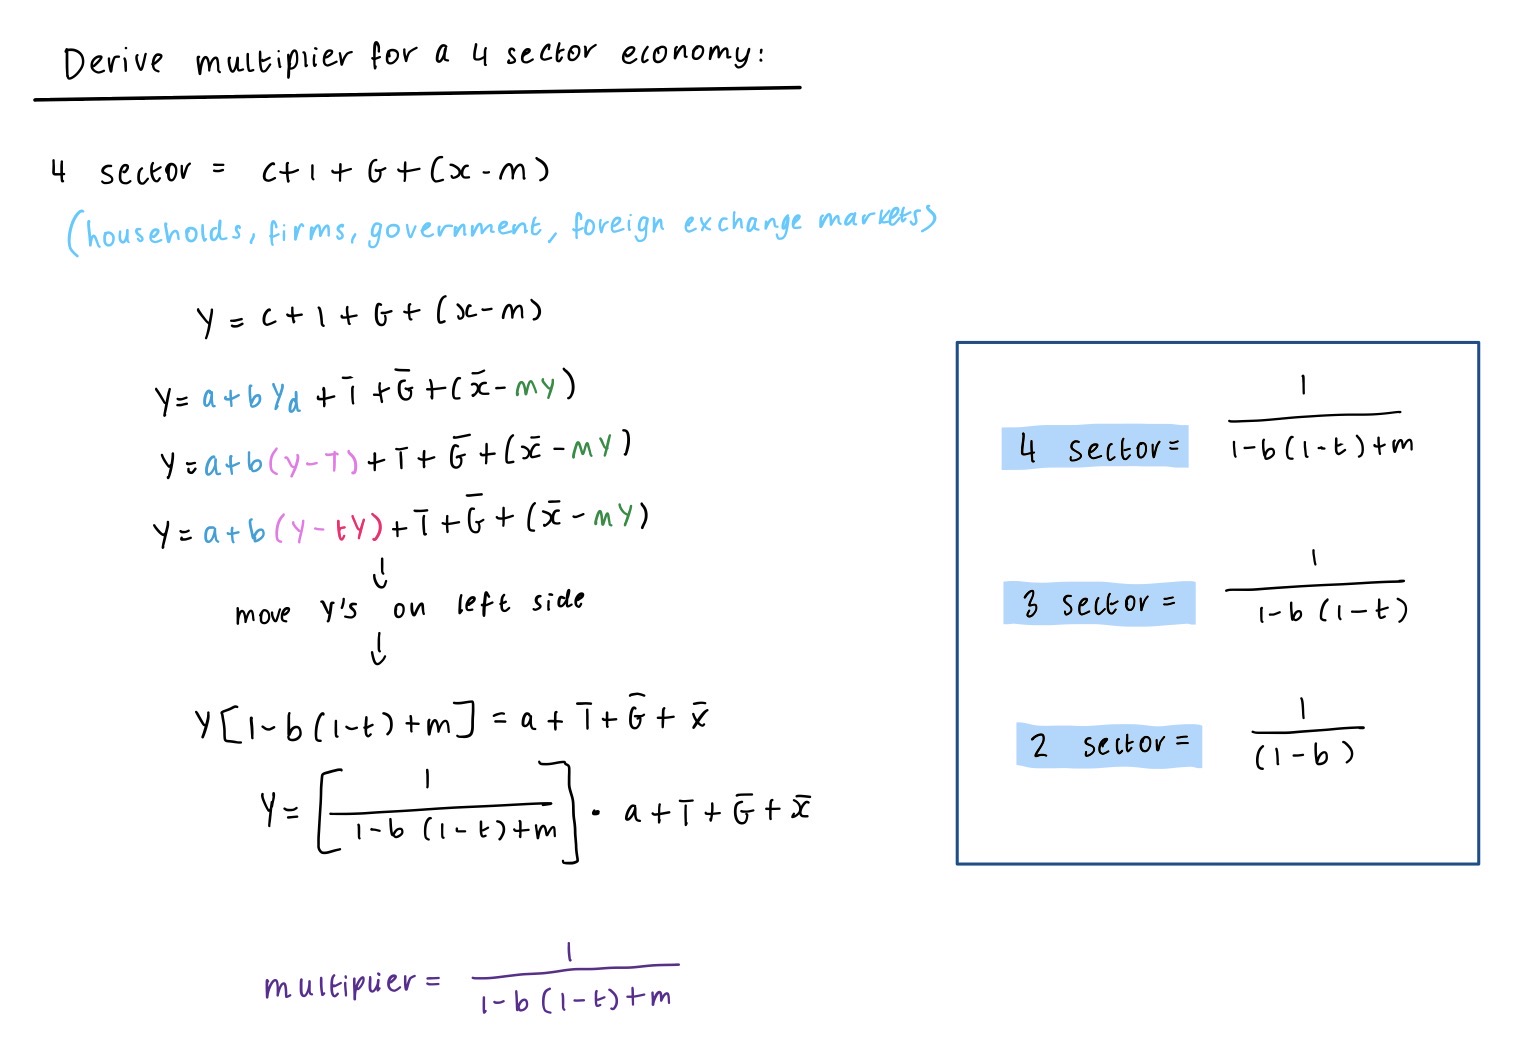
How can we derive the expenditure multiplier for a 4 sector economy (steps)?
What would the expenditure multiplier be for a:
> 4 sector economy
> 3 sector economy
> 2 sector economy
Y = sectors - write the sectors for what each economy is made up of
Replace components - by what we describe them by (equation or fixed)
> Consumption + imports
> Yd = Y - T
> T = tY
Y’s on left side - collect all Y’s and put on left side of equation
Derive multiplier - Y = components, where the multiplier is left (composed of all induced expenditure) which multiplies the autonomous expenditures
Keynesian cross:
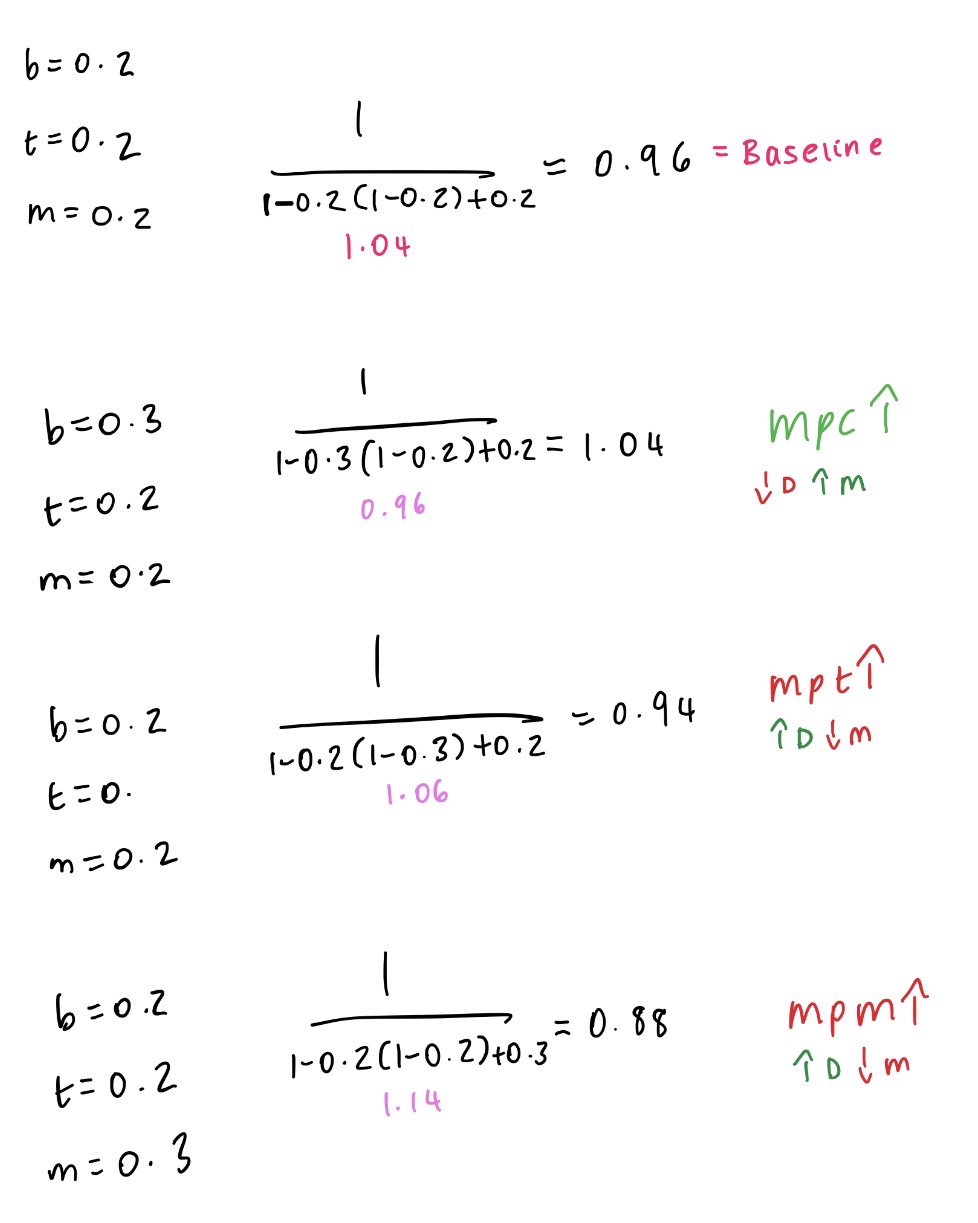
Explain how the expenditure multiplier changes if (link to swivel graph in exam!!!):
> b increases (MPC)
> t increases (MTR)
> m increases (MPM)
b increases (MPC):
More spending for each extra unit of income
Increase induced consumption
DENOMINATOR SMALLER > LARGER MULTIPLIER
t increases (MTR):
Taxed more so get less Yd so less spending for each extra unit of income
Decrease consumption at each income level
Decrease induced consumption
DENOMINATOR BIGGER > SMALLER MULTIPLIER
m increases (MPM):
Leakage in economy, as money flows out of country and into a foreign country
Less income in circular flow > lower domestic income
Decrease induced consumption
DENOMINATOR BIGGER > SMALLER MULTIPLIER

Multiplier > 1
the larger the denominator, the smaller the multiplier
the smaller the denominator, the larger the multiplier
the bigger the leakages in economy (savings, imports, higher taxes), the smaller the multiplier
multiplier dependent on leakages NOT injections
Multiplier > 1
the larger the denominator, the smaller the multiplier
the smaller the denominator, the larger the multiplier
the bigger the leakages in economy (savings, imports, higher taxes), the smaller the multiplier
multiplier dependent on leakages NOT injections
AS/AD MODEL
AS/AD MODEL
What is AD?
What are the features of an AD diagram?
Aggregate demand = relationship between the quantity of real GDP demanded (Y) and the price level of an economy (P or PL)
Planned AE=Y along the AD curve (produce amount that is planned to be spent)
Downward sloping AD curve - PL and Y/AE are inversely related (as P increases, AE falls) so creates movements along curve
Describe why the AD curve slopes downwards:
Wealth effect (real balances effect)
Substitution effect
Intertemporal (interest rate effect)
International (exchange rate effect)
Each effect reinforces the inverse relationship between PL & Y (quantity of output demanded)
Wealth effect:
Decrease PL leads to an increase in Y - real value of money/purchasing power increases (money, stocks, bonds)
More real wealth ppl spend more & decrease saving
Production ↑ so quantity of real GDP demanded ↑ (and vice versa)
Substitution effects:
2a. Intertemporal (interest rate effect):
Decrease in PL leads to an increase Y - real value of money increases
Because money holds more value now, they feel less need to hold money for everyday spending
Supply of money (loanable funds) in banks increase > pushes interest rates down
Cheaper to borrow so people borrow more & spend more so Q of Y ↑
2b. International (exchange rate effect):
Decrease in PL leads to an increase in Y - price of UK-made goods falls relative to foreign-made goods
Foreign buyers find domestic products (UK) more affordable (boost exports) and domestic consumers find foreign goods more expensive so may substitute for domestic products (decrease imports)
Net exports increase > ↑UK real GDP demanded