Cell Physiology Week 7-12
1/231
There's no tags or description
Looks like no tags are added yet.
Name | Mastery | Learn | Test | Matching | Spaced | Call with Kai |
|---|
No analytics yet
Send a link to your students to track their progress
232 Terms
Normal Blood Glucose Levels
Normal fasting blood glucose levels are between 3.9–5.4 mmol/L
Normal blood glucose levels two hours after starting a meal are between 6-10 mmol/L
Hypo and Hyperglycaemia Blood Glucose Levels
Hypoglycaemia – glucose levels < 4.0 mmol/L
Hyperglycaemia – fasting glucose levels > 7.0 mmol/L
Insulin vs Other Hormones in Changing BGL
Multiple hormones can increase blood glucose levels but insulin in the only one that can decrease it.
Pancreatic Islets
1-2% of total pancreatic mass
Islet receive ~10-15% pancreatic blood flow.
~ 0.5 to 14.8 million islets per adult human pancreas
1,000-3,000 endocrine cells per islets
50-75% beta cells, 25-35% alpha cells, 10% delta cells, <1% other cells
Formation and Transport of Insulin
Insulin starts as preproinsulin in the rough endoplasmic reticulum, where it is broken down into proinsulin.
Proinsulin is transported to the Golgi complex.
Within maturing secretory granules with a clathrin coat, enzymes remove the C-peptide, forming active insulin.
Insulin is stored in mature granules as a zinc-insulin hexamer and has a half life of up to 5 days.
Phases of Insulin Secretion
Secretion is bi-phasic and includes the triggering pathway and amplifying pathway.
Triggering Pathway for Insulin Release Process
GLUT2 mediated transport of glucose into the beta cell
G6P moves through the glycolysis pathway to form pyruvate, which enters the TCA cycle
In the mitochondria, oxidative respiration generates ATP, increasing the ATP/ADP ratio.
ATP binds and closes ATP-sensitive K+ channels
Depolarisation of plasma membrane, opening voltage-sensitive Ca2+ channels
Influx of Ca2+ triggers insulin granule exocytosis
Amplifying Pathway of Insulin Release Process
Glucose metabolism increases and additional coupling factors such as NADPH, GTP, cAMP, Glutamate, etc.
No further rise in Ca²⁺
Enhanced exocytosis of insulin granules
Results in sustained insulin release
Features of Triggering Pathway
Starts insulin secretion, raises ATP, closes K(ATP), Ca2+ influx, increases Ca2+, depolarizes the cell, and dominates the first phase.
Features of the Amplifying Pathway
Boosts insulin secretion already underway, makes Ca2+ more effective at releasing insulin, does not change Ca2+, no effect on membrane potential, and is a major contributor to the second phase.
Insulin Secretory Granules
10,000 ISGs per β-cell
Only 1-5% of ISGs undergo exocytosis
3 theories of what determines which granules will be released
Proximity to the plasma membrane
Restless newcomer granules
Granule age
Proximity of Granules to the Plasma Membrane
The closer to the membrane a granule is, the more likely it will be to released
Readily releasable pool = granules that sit super close to the membrane and are ready to be released
Once the readily releasable pool is drained then granules will come from the reserve pool
Restless Newcomer Insulin Granules
Highly mobile, highly Ca2+ sensitive
Contributes to the majority of secretory response
A specialized class of insulin-containing granules within pancreatic beta cells that are newly recruited and immediately fuse to the plasma membrane upon stimulation, typically without a preceding docking phase.
Insulin Granule Age
When β-cells are stimulated by glucose there is preferential release of young insulin granules because they are more mobile and calcium sensitive, with older granules preferentially targeted for degradation.
This preferential release of young insulin granules is dysregulated underconditions of metabolic stress and T2D
Insulin Secretion in Response to an Oral vs IV Glucose
Glucose given orally stimulates more insulin than intravenous or intraperitoneal glucose. Secretion of gastro-intestinal hormones, stimulate insulin secretion by beta-cells.
Dual Actions of Fatty Acids on Pancreatic Beta-cells
Fatty acids on their own don’t induce insulin secretion but with glucose they increase secretion. Fatty acids potentiate glucose-stimulated insulin secretion by activating GPR40. This activation triggers a signalling cascade to open calcium channels on the ER to increase calcium release.
Acute vs Chronic Fatty Acid Stimulation of Beta Cells
Potentiation of insulin release only works for acute stimulation:
If you give beta cells fatty acids for 1 hour with high glucose then there will be a doubling in insulin secretion
If you give beta cells fatty acids for 24 hours with high glucose then the beta cells become dysfunctional
Beta Cell Adaptability and Plasticity during Pregnancy
Pregnancy causes beta cell mass expansion, increased insulin synthesis and secretion, increased glucose sensing, and increased anti-oxidative function.
Bioactive Lipids
Function as either extracellular or intracellular signals. Function in Inflammation, Development, Neurogenesis, Cognition, Motor Control, Feeding, Pain, Proliferation, Migration, and Apoptosis.Dysregulation implicated in many pathological conditions.
Major Classes of Bioactive Lipids
Eicosanoids, Endocannabinoids (eCBs), phospholipids/sphingolipids, and steroids.
What are the eicosanoids?
Leukotriene, prostaglandin, thromboxane, and prostacyclin
What are the endocannabinoids?
Anandamide, arachidonoylglycerol, and palmitoylethanolamine.
What are the phospholipids/sphingolipids?
Phosphatidylserine, phosphatidylinositol, lysophosphatidic acid, and sphingosine-1-phosphate.
Steroids
Glucocorticoids, mineralocorticoids, androgens, estrogens, progesterones
Most act through nuclear receptors to regulate gene expression
Lipid Receptors
G-Protein Coupled Receptors
Lysophosphatidic acid (LPA) - LPA1, LPA2, LPA3 Receptors
Sphingosine-1-phosphate (S1P) - S1P1-5 Receptors
Platelet activating factor (PAF) - PAF Receptor
Endocannabinoids - CB1 and CB2 receptors
Prostaglandins - 9 different Eicosanoid Receptors
Retinol derivatives - Rhodopsin Receptor
Production of Lipid Signalling Molecules
Made by phospholipases that cleave the lipids off
Depends on what tail and head groups you have what it will produce
Phospholipase A1 produces free fatty acids
Phospholipase A2 produces arachidonic acid
Phospholipase C produces inositol-phosphates
Phospholipase D produces anandamide
Arachidonic Acid
A precursor for many bioactive lipids such as COX-1, COX-2, and prostaglandin
A precursor for the biosynthesis of eicosanoid
Obtained from the diet (meat or eggs) or synthesized from linoleic acid
Classified as an omega-6 fatty acid
Endocannabinoids
Derivatives of arachidonic acid
Anandamide and 2-Arachidonylglycerol are the predominant ones
Regulate synapse formation and neurogenesis
Can influence cognition, motor control, feeding behaviour, pain
CB1-R are the most abundant GPCRs in the brain
CB1-R and CB2-R are Gi/o coupled receptors
Brain functions are mediated predominantly by CB1-Rs
Biosynthesis of Anandamide
Phosphatidylethanolamine → N-arachidonoyl-PE → anandamide
Biosynthesis of 2-arachidonyl glycerol (2-AG)
Phosphatidylinositol → Lyso-Pl or 1,2-DAG → 2-AG
Anandamide Transport
Endocannabinoids (ECs) are soluble in both aqueous and membrane environments
Various proteins have been suggested as being EC transporters.
EC Transporters may be involved in both release and re-uptake of ECs
Cholesterol appears to regulate EC transport
Metabolism of Endocannabinoids
FAAHs breakdown anandamide
MAGLs breakdown 2-AG
Both break down into arachidonic acid
Possible Mechanism of Action of Acetaminophen (Paracetamol/Panadol)
Not actually quite sure how it works
Acetaminophen is first converted to p-aminophenol and then conjugated with arachidonic acid (possibly by FAAH) to produce AM404
AM404 is a TRPV1 agonist
AM404 also inhibits COX-1 and COX-2 and prostaglandin synthesis
AM404 also inhibits anandamide transport
Combination of effects could partially explain its analgesic, anti- pyretic and weak anti-inflammatory activities
Locations of enzymes involved in biosynthesis and breakdown
Phospholipase C, Diacylglycerol lipase (2-AG biosynthesis), N-acyltransferase, N-acylphosphatidyl-ethanolamine phospholipase D (AEA biosynthesis) - located postsynaptically
Transporter (EMT) - both pre- and post-synaptic
Breakdown
Fatty acid amide hydrolase – postsynaptic
Monoacylglycerol lipase - presynaptic
What does cannabinoid receptor activation cause?
Activation of CB1/2 stimulates
Gi/o heteromeric proteins inhibits Adenylate cyclase (AC) – which reduces PKA activity
Mitogen activated protein kinase
Both lead to changes in gene expression
Stimulation of Gi/o by CB1 receptors
Inhibits voltage dependent Ca2+ channels and
Stimulation of K+ channels
which inhibits neurotransmitter release
3 Types of Endocannabinoid Signalling at the Synapse
Retrograde, non-retrograde, and neuron-astrocyte signalling.
Retrograde eCB Signalling
eCBs are mobilized from postsynaptic neurons and target presynaptic cannabinoid type 1 receptors (CB1Rs) to suppress neurotransmitter release.
Non-Retrograde eCB Signalling
eCBs produced in postsynaptic neurons activate the same postsynaptic neuron CB1Rs or TRPV1 channels.
Neuron-Astrocyte eCB Signalling
eCBs released from postsynaptic neurons stimulate astrocytic CB1Rs, thereby triggering glutamate release.
3 molecular mechanisms underlying endocannabinoid-mediated short and long-term synaptic signalling
Short-term plasticity, homosynaptic excitatory long-term depression, and heterosynaptic inhibitory long-term depression.
Short-Term Plasticity
Release of 2-AG from postsynaptic neuron acts on CB1R on presynaptic neuron to cause inhibition of neurotransmitter release
This temporary reduction in transmitter release is a form of short-term plasticity, because it transiently changes synaptic strength without altering synaptic structure.
Homosynaptic Excitatory Long-Term Depression
Glutamate is released from presynaptic neuron that causes 2-AG to be released from postsynaptic neuron
2-AG acts on the same neuron that the glutamate was released from to cause downregulation of the release mechanisms and inhibition of glutamate release
Can last hours, days, or longer. It often involves changes in presynaptic signaling pathways
Heterosynaptics Inhibitory Long-Term Depression
2-AG is released from a post-synaptic neuron and acts on cannabinoid receptors on presynpatic GABAergic neurons which suppresses GABA release over the long term.
Current Bioactive Lipid Research in Vandenberg Lab
Glycine neurotransmission in the spinal cord
Glycinergic interneurons play a gate keeper role in regulating pain signals sent to the brain
In neuropathic pain there is a reduction in glycinergic neurotransmission
Glycine transport inhibitors will elevate [glycine] and restore normal pain processing
N-Arachidonyl Glycine is an endogenous analgesic
Structurally related to the endocannabinoid anandamide
An endogenous lipid found in highest concentrations in the spinal cord
Reduces mechanical allodynia and thermal hyperalgesia in rat models of neuropathic pain
No activity on Cannabinoid receptors, but inhibits Glycine Transporters
Problems with N-Arachidonyl Glycine
Not very potent
Readily metabolised
Acts on a range of targets
How was N-arachidonyl glycine improved?
Modify the head and tail groups to produce a more potent Glycine Transporter 2 inhibitor. Made Oleoyl-D-Lysine which has a D-lysine attached to a Oleoyl tail. Found that there was no activity on off target sites after screening so it is selective.
Prediabetes T2
Blood glucose levels are higher than normal but not yet high enough for a diabetes diagnosis. During this phase, pancreatic beta cells begin working overtime to compensate for resistance.
Type 2 Diabetes Diagnosis
When the pancreas can no longer produce enough insulin to overcome resistance, blood sugar levels rise to a diagnostic range. At diagnosis, it is estimated that 50-70% of insulin-producing pancreatic cells may have been lost.
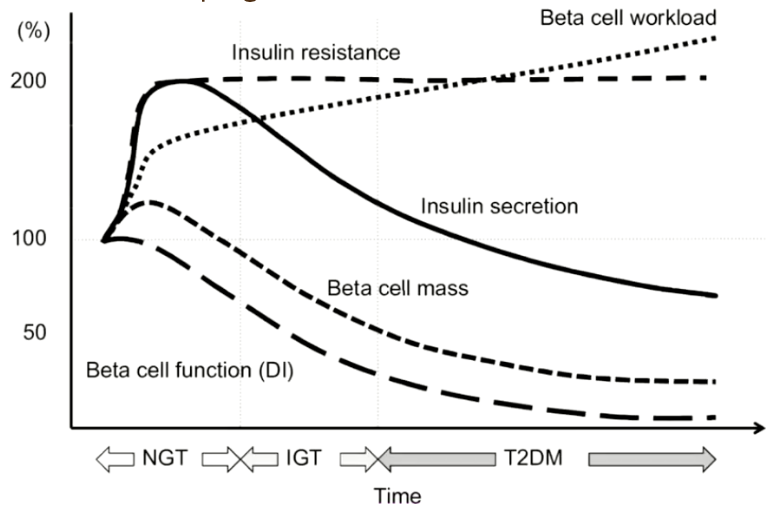
Changes During Development of T2 Diabetes
Insulin resistance increases to a point where it plateaus
Insulin secretion increases before decreasing
Beta cell mass and function increase before decreasing
Beta cell workload increases not quite exponentially
Insulin Resistance Lead to Beta-Cell Compensation
Increase in beta cell mass and individual beta cells also secrete more insulin
This is often sufficient to keep the glucose tolerance “normal” because most people have the genetic predisposition to be able to do this
When people have a genetic predisposition for type 2 diabetes this compensatory mechanism fails and leads to a decrease in beta cell mass and insulin secretion
Inability to Compensate for Insulin Resistance is Genetically Driven
> 80% of human genetic variants associated with T2 diabetes are involved in β-cell function (from genome-wide association studies)
T2 diabetes occurs at the intersection between genetics and environment
Environment = obesity, diet, smoking…
3 Key Mechanisms of Beta-Cell Failure in T2D
Inflammation
Oxidative stress and mitochondrial dysfunction
ER stress
Which all cause dysfunction, apoptosis, and/or dedifferentiation
Role of Inflammation in Beta-Cell Failure
Chronic metabolic stress recruits and activates macrophages in islets, and their cytokines directly impair beta-cell function and survival
Islets normally contain resident macrophages for homeostasis and remodelling.
In T2D, macrophage numbers increase, driven by metabolic stress
Macrophage Polarization
M1-like macrophages → pro-inflammatory, secrete pro-inflammatory cytokines
M2-like macrophages → anti-inflammatory, tissue-repairing
Obesity and nutrient excess push macrophages toward an M1-dominant state, amplifying inflammation
Oxidative Stress and Mitochondrial Dysfunction in Beta-Cell Failure
β-cells are uniquely vulnerable to oxidative stress because they have low antioxidant capacity.
When exposed to chronic hyperglycaemia and elevated fatty acids the mitochondria work harder to produce ATP and they generate excessive reactive oxygen species, which damage mitochondrial electron transport chain components.
Ros damages DNA, proteins, and lipids contributing to beta-cell dysfunction and apoptosis.
ER Stress in Beta-Cell Failure
β-cells are highly secretory cells that depend on a tightly regulated ER to fold proinsulin.
Chronic metabolic stress (obesity, insulin resistance) overwhelms this system, activating the unfolded protein response (UPR) and eventually driving β-cell failure
Key ER Stressors
Increased insulin demand → more proinsulin synthesis → folding burden
Hyperglycaemia and lipotoxicity → misfolded proteins accumulate
Genetic susceptibility → impaired ER proteostasis
Unfolded Protein Response (UPR)
There are UPR sensors that are always found in the membrane of the ER. These include ATF6, PERK, and IRE1 which are bound to BIP to keep them in an inactive state.
When there is misfolding of insulin within the lumen of the ER BIP will dissociate and the sensors will be activated.
ATF6 (UPR)
Upregulates genes encoding ER chaperones, folding enzymes, and ER-degrading components
Expands the ER’s capacity to fold proteins and clear misfolded ones
PERK (UPR)
Reduces global protein translation, lowering the influx of new protein into the ER
PERK at the same time activates ATF4 transcription
If ER stress persists, ATF4 induces CHOP, a pro-apoptotic transcription factor.
IRE1 (UPR)
Increases ER folding capacity, ER-associated degradation and lipid synthesis
Degradation is to reduce ER load
Key function: Increase ER folding and degradation capacity; fine-tune UPR adaptiveness
Effect of Unfolded Protein Response in Chronic Metabolic Stress
Adaptive UPR becomes maladaptive
CHOP and other pro-apoptotic pathways are activated
ER Ca²⁺ handling becomes disrupted
Beta-cells lose their ability to maintain insulin production
Signal Transduction Key Steps
Extracellular ligand binding (hormones, neurotransmitters, cytokines)
Activation of transmembrane receptors (conformational change / enzymatic activation)
Intracellular signalling cascades (e.g. kinase-mediated phosphorylation)
Second messenger generation (Ca²⁺, cAMP, DAG, IP₃ – rapid and transient)
Amplification and integration of signals
Altered cellular responses (metabolism, gene expression, transport, motility)
Types of Receptors
GPCRs, enzyme-linked receptors (RTKs), channel-linked receptors, and intracellular receptors.
First and Second Messengers
First messengers are extracellular ligands (such as hormones or neurotransmitters) that bind to cell-surface receptors to initiate signaling. Because they do not enter the cell, they activate second messengers, which are intracellular molecules that amplify and relay the signal to target proteins within the cytosol
Second Messengers Overview
Small molecules and ions (Ca²⁺, cAMP, DAG, IP₃ – rapid and transient)
Present at low or inactivated states in resting cells
Activation leads to amplification and integration of signals
3 Classic Second Messenger Pathways
Activation of adenylyl cyclase by GPCRs to generate cAMP
The receptor is an enzyme that stimulates the production of PI3K by growth factors to generate the lipid second messenger PIP3
Activation of PLC by GPCRs to generate two second messengers: the membrane bound DAG and water soluble IP3
IP3 activates IP3R to cause the release of calcium from the ER
DAG activates PKC
GPCRs Overview
Receptors have 7 transmembrane domains and have various extra and intracellular loops
Ligands bind at various different sites on the receptors
Largest family of cell-surface receptors in many organisms.
Largest and among the most efficacious class of therapeutic targets
How do GPCRs work?
When GPCRs are inactive the alpha subunit of the g-protein heterotrimeric complex is bound to GDP.
When a ligand binds to the extracellular domain of the GPCR, GPCRs act as a GEF and exchange the GDP with GTP on the alpha subunit.
The activated GTP bound alpha subunit will dissociate from the rest of the complex and interacts with downstream effect proteins which are mostly enzymes or ion channels
Activation-Inactivation Cycle of Heterotrimeric G-proteins
Gα proteins are GTPases that catalyse the hydrolysis of GTP to GDP.
Once downstream proteins are activated the alpha subunit deactivates itself as it is a GTPase itself that catalyses the hydrolysis of GTP to GDP.
The GDP bound alpha subunit will now bind to the beta-gamma dimmer and form the inactive heterotrimeric complex
Signalling Through Gαi Protein
Inhibitory G protein
Inhibits adenylyl cyclase
Decreases cytosolic cAMP levels
Signaling through Gαs Protein
Stimulatory G protein
Activates adenylyl cyclase
Increases cytosolic cAMP levels
Activation of Adenylyl Cyclase to Generate cAMP
cAMP is synthesised from ATP via the action of adenyl cyclase and is inactivated by hydrolysis by cyclic nucleotide phosphodiesterase.
The principal task of cAMP is to stimulate protein phosphorylation by PKA.
Action of cAMP on PKA
Inactive PKA has a regulatory subunit and inactive catalytic subunit. cAMP binds to the regulatory subunit to cause the catalytic subunits to dissociate and become active. These subunits travel to the nucleus to activate CREB which binds to CRE on target genes.
Regulation of cAMP/PKA Activity
Spatial and temporal organisation of signal transduction.
AKAP: A-Kinase Anchoring Protein - one of the main targets of PKA
AKAPS also interact with PDEs which maintain the local pool of cAMP
Signaling through Gαq Protein
Activates phospholipase C
Generates inositol 1, 4, 5-triphosphate and diacylglycerol
Inactivation or Desensitization of GPCRs
Activated GPCR stimulates GRK to phosphorylate the GPCR on multiple sites. Arrestin binds to the phosphorylated GPCR.
Enzyme-Linked Receptors
Catalytic receptors
Cytosolic domain has intrinsic enzyme activity
Single pass transmembrane proteins - only have a single transmembrane domain
Involved in cell division, programmed cell death or cell differentiation.
Most common example : receptor tyrosine kinase
Activation of Enzyme-Linked Receptors
Ligand binding stimulates kinase activity
Autophosphorylation phosphorylates the tyrosine causing intracellular signalling proteins to bind to them
Receptor Tyrosine Kinases in Disease
Cancer (EGFR, HER2, PDGFR mutations)
Insulin resistance & metabolic disease
Therapeutic targeting (RTK inhibitors)
RTKs Overview
1 TM
Ligands: growth factors
Activation: dimerisation
Speed: slow, long-term
Signalling: kinase cascades
Outcomes: growth, metabolism
GPCRs Overview
7 TM
Ligands: hormones, neurotransmitters
Activation: G-protein activation
Speed: fast, transient
Signalling: second messengers
Outcomes: rapid physiological responses
Points of Crosstalk Between RTKs and GPCRs
GPCRs can activate MAPK
RTKs can influence cAMP levels
Integration allows fine-tuned cellular responses
Fasted vs Fed Insulin Metabolism
Fasted: liver provides glucose to the brain and adipose tissue provides fat to the muscles
Fed: pancreas secretes insulin due to high blood glucose and stops the liver from producing glucose and increases uptake of glucose by adipose tissue and muscle.
How does insulin increase glucose uptake into muscle and adipose tissue?
Insulin increases the abundance of glucose transporters on the surface of muscle and fat cells
Muscle and fat cells have a unique glucose transporter called GLUT4
Insulin binds to its receptor which activates a signaling cascade which moves GLUT4 to the cell surface
Why is GLUT4 regulated?
To prevent hypoglycemia - otherwise muscle would just continually be taking the glucose out of the blood
Prevents muscle stealing the brain’s glucose
Why do muscle, adipose and liver cells respond to insulin?
Because they have the insulin receptor but not all cells do
Note: same receptor, different cell, different outcome
Ozempic and the Glp1 receptor as an example
Type 2 diabetes medication that targets GLP1R on beta-cells to cause insulin secretion
Caused weight loss because the GLP1R receptor also happens to be found in the hypothalamus and attenuates hunger
This wasn’t the original target but is actually a bit of a side effect
Same receptor, different cell, different physiological outcome
Insulin Signal Transduction
Insulin activates a network of kinases
Kinases phosphorylate lipids, metabolites and proteins
Alter protein activity, localization, and interactions
Protein Kinases
Serine and Threonine kinases are the most common
64% of tyrosine kinases are hormone receptors (only 3% for S/T kinases).
The insulin receptor is an example of an RTK
Requirements for a protein kinase to phosphorylate a serine, threonine or tyrosine:
The phosphorylation site needs to be exposed
The target protein needs to be near the kinase
The surrounding amino acids needs to match the kinases targeting motif.
Ex. Akt motif: RXRXXS (don’t need to remember)
Insulin Signalling Process
Insulin binds to the insulin receptor on the outside of the cell. This changes the shape of the insulin receptor and activates tyrosine kinase activity.
The insulin receptor phosphorylates itself and IRS-1 (insulin receptor substrate-1).
Phosphorylation of tyrosine on IRS-1 attracts a lipid kinase called phosphoinositide 3-kinase (PI3K).
PI3K phosphorylates a lipid in the inner leaflet of the plasma membrane called PIP2, converting it to PIP3.
PIP3 attracts proteins which contain a PH-domain (pleckstrin homology).
PDK1, Akt and mTORC2 all contain PH-domains. By coming together at PIP3 on the plasma membrane they come into proximity. Both PDK1 and mTORC2 phosphorylate Akt, thereby activating it.
Overall Phosphorylation Caused by Akt
Phosphorylates the protein AS160 which sits on the outside of vesicles that contain GLUT4. This then allows them to be transported and fuse with the cell membrane
Phosphorylates PFKFB2 which increases glycolysis - metabolised for fuel
Phosphorylates GSK3 which then activates glycogen synthase
Phosphorylates FOXO
Insulin-mediated GLUT4 translocation: AS160
Myosin and Rab proteins work together to move GLUT4
AS160 inhibits Rab proteins. This means it keeps GLUT4 inside the cell
Akt inhibits AS160 by phosphorylation of 4 different sites
Exercise through AMPK also triggers this process via muscle contraction not just insulin
FOXO and Regulation of Transcription by Insulin
FOXO is a transcription factor normally found in the nucleus
When it is phosphorylated by Akt it is removed from the nucleus because of the negative charge of the phosphate
In low energy conditions (starvation) FOXO activates genes involved in survival
When fuel is abundant FOXO is switched off because these genes are no longer needed
Phosphoproteomics
A way to use mass spectrometers to measure thousands of phosphorylation sites at a time.
Protein extraction
Protein digestion
Phosphopeptide enrichment
Mass spectrometry
Protein/PTM quantification
Bioinformatic analysis
Use of Phosphoproteomics for Insulin Signalling Discovery
Used this to find that insulin signalling is vastly complicated
Phosphoproteomics has revealed thousands of insulin regulated phosphorylation sites on hundreds of proteins
We only know what ~20% of these do
Negative feedback makes interpretation very difficult
Insulin Resistance
A failure of insulin to stimulate glucose uptake, suppress lipolysis or liver glucose production, despite sufficient insulin concentrations. Characterised by elevated fasting insulin concentrations.