Ornithology Quiz 4
1/36
There's no tags or description
Looks like no tags are added yet.
Name | Mastery | Learn | Test | Matching | Spaced | Call with Kai |
|---|
No analytics yet
Send a link to your students to track their progress
37 Terms
Migration
Seasonal long-distance movement from one geographic location or habitat to another
Breeding season
Arctic, boreal, temperate areas
Non-breeding season
Temperate, subtropical, tropical areas
Long Distance Migration → Arctic Tem
Travel ~40k km/25k mi per year
Flyways
Migration corridors that generally follow major geographical features such as mountain ranges, rivers, and valleys
Atlantic Flyway
Flyway that follows the Atlantic Coast
Mississippi Flyway
Flyway that follows the Mississippi River
Central Flyway
Flyway that follows the Great Plains
Pacific Flyway
Flyway that follows the Pacific Coast
Tracking Innovation
GPS devices getting smaller and more lightweight, can now be solar powered
Doppler Radar for Tracking
Distinguishes dense flocks of migratory birds, often appearing in reflectivity when filtering out weather
Climate change and spring migration
Many bird species are migrating earlier in response to climate change, but responses vary among taxa and ecologies
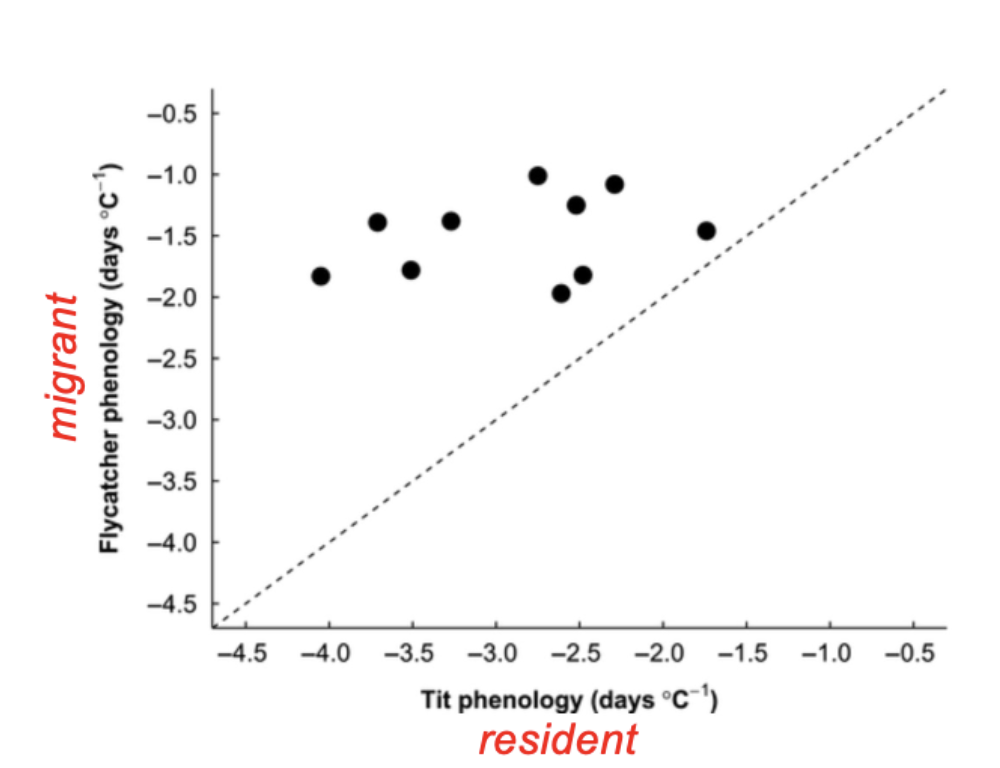
Some evidence that resident species are shifting their breeding earlier than migratory species
Pros of living in/migrating to Tropics
Increased efficiency in thermoregulation
More dependable, year-round food resources
Cons of living in/migrating to Tropics
Less land mass = higher density of birds per square area, thus troublesome to claim territory
Higher predation rates
Pros of living in/migrating to Temperate/Boreal/Arctic
Long summer days = abundant resources (water, nesting, etc)
More landmass = more space, less density
Less predation
Cons of living in/migrating to Temperate/Boreal/Arctic
Cold winters
Costly to thermoregulate
Low food resources
Photoperiod
Length of the day/sunlight
increasing/decreasing → restlessness, eating to excess, fat deposition, and weight increases
Migratory restlessness
innate, anxious behavior migratory birds exhibit before and during migration seasons when caged
Fat deposition
Subcutaneous layer of fat to fuel long-distance flights
metabolized by enzyme lipase —> free fatty acids and glycerol
Birds lose 0.2-0.9 percent of their body weight per hour of flight; How far individuals can fly is dependent on how much fat they have in reserve
Stopovers
Areas where birds stop their migration to rest and forage to restore fat reserves
Often high food resources near large areas with low resources
Diurnal migrations
Birds that employ thermal soaring to take advantage of rising warm air
Birds that feed on insects while flying
Nocturnal migrations
more common; more stable/favorable and cooler weather, leading to less heat loss
Lesser likelihood of predation by hawks, especially smaller birds
Birds that migrate day + night
Anseriformes and shorebirds
True navigation
Birds navigate to specific patches of habitat hundreds or thousands of km away
Visual landmarks → recognize features like coastlines, rivers, mountains, highways, and railways as reference points
Sun compass → sun’s position in the sky, together with their internal circadian clock, to determine direction during migration
Star compass → pattern and position of multiple stars at night to orient themselves and maintain the correct migratory direction
Geomagnetism → detect Earth’s magnetic field, which acts like a map of horizontal space and helps them navigate
Threats during migration
Predation
Run out of fuel and die of exhaustion
Strikes with buildings, particularly glass
Land use changes can also affect navigation and disorient birds
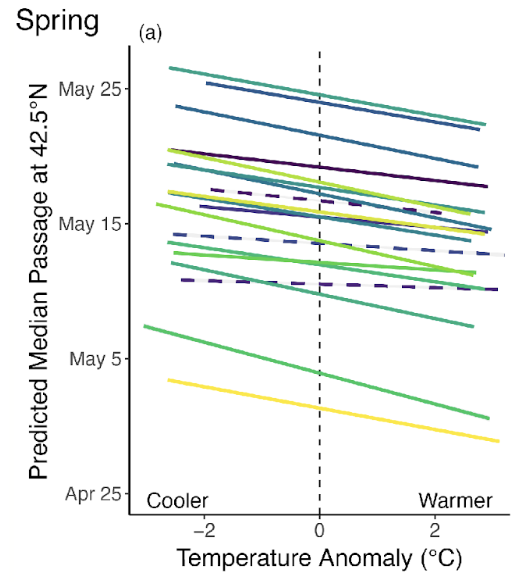
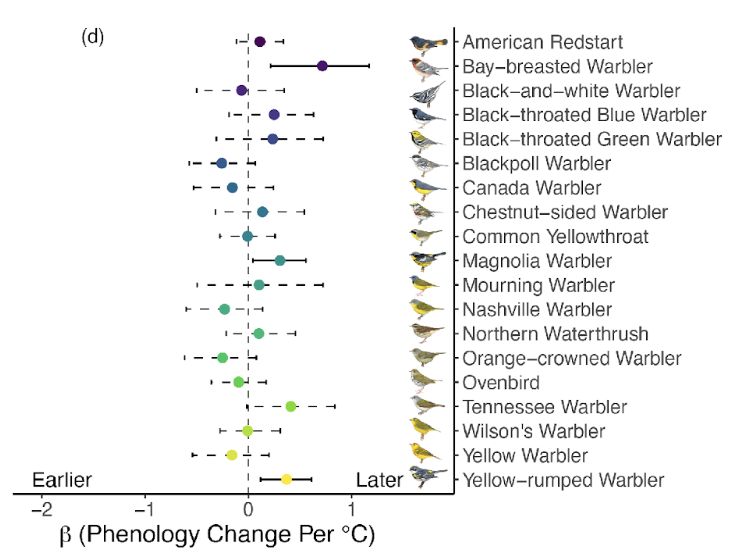
Species-specific responses to changing temperatures for spring migration, x-axis = temp change, y-axis = migratory passage
In most species, species arrive earlier in warmer years
Shows the effect size for each species, which is how many days the phenology changes for each degree celsius
In general, most species’ estimate is within the negative range, indicating significantly earlier arrival with an increase of 1ºC
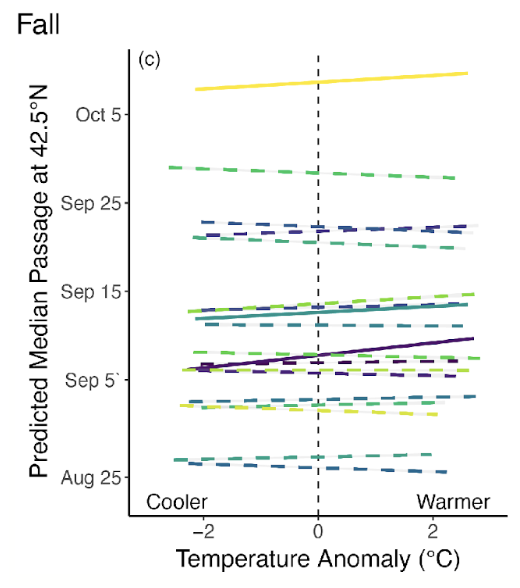
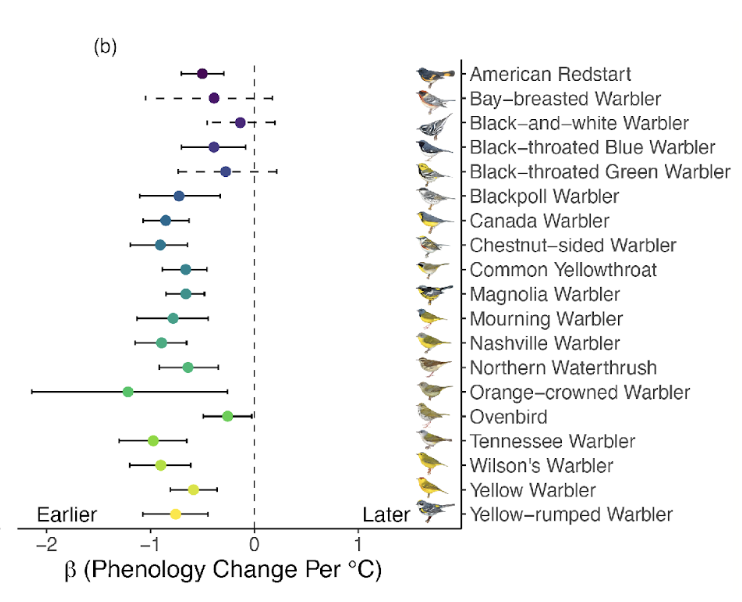
Species-specific responses to changing temperatures for Fall migration, x-axis = temp change, y-axis = migratory passage
Most species are not adjusting their fall migration timing with changing temperatures
Shows the effect size for each species, which is how many days the phenology changes for each degree Celsius
Only 3 species are migrating later in the Fall with warmer temperatures
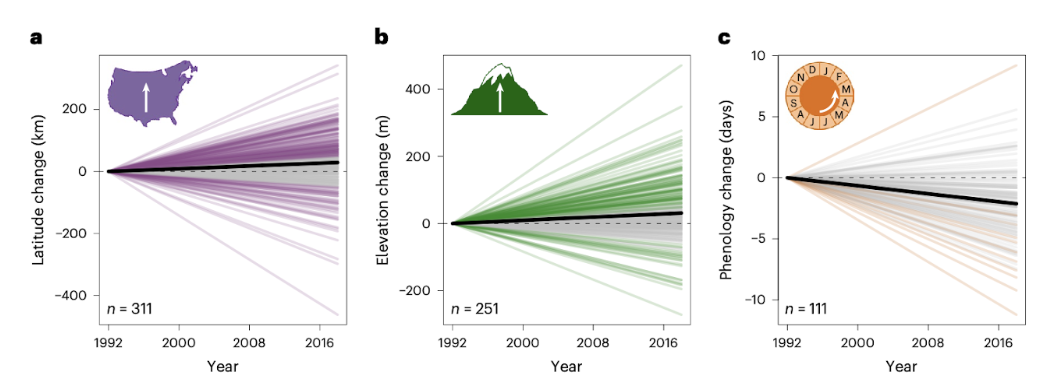
x-axis = years, and the y-axis shows latitude change, elevation change, and phenology change for Figures 1a, 1b, and 1c, respectively
Birds are shifting to higher latitudes (a) and elevations (b) for breeding; most species are shifting to earlier return dates (c)
Shift Ratio
How birds are changing their latitude, elevation, or phenology as compared to how they are expected to change based on the warming rate of the climate
Observable change/rate of warmth
Shift of 100% = “perfectly” tracking climate change
Negative shift ratios = species arriving later with warming climate
Positive shift ratios = species arriving earlier with warming climate
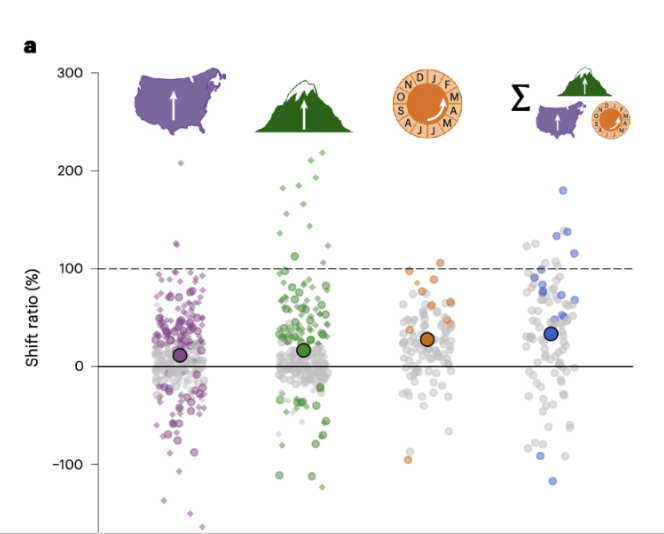
Y-axis = shift ratio
Black = 0
dashed = perfect tracking
Average shift ratios are positive but well below 100, with the greatest overall shift seen for breeding phenology
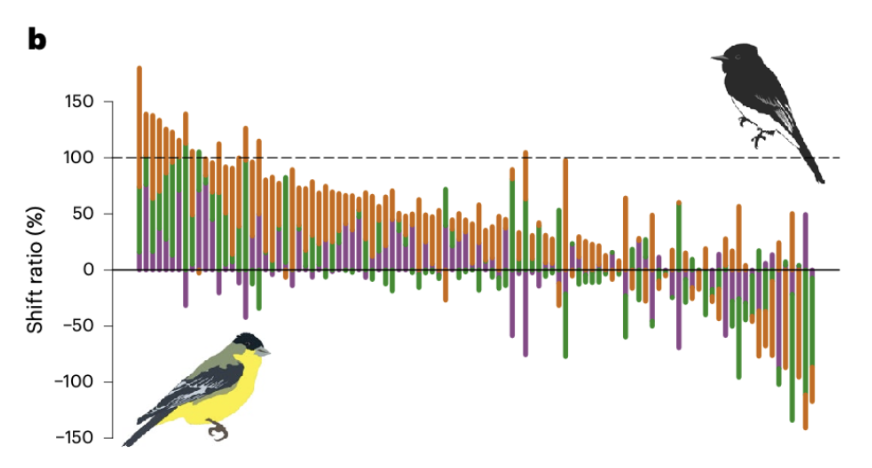
Majority of birds have a positive sum, mostly b/c breeding phenology was the greatest contributor
Y-axis = average shift ratio
X- axis = individual species
Bars = one species representing shift bar contributions
How does climate change influence birds to migrate sooner?
Climate change causes earlier spring warming, which makes food resources become available earlier, so many birds migrate earlier to track those conditions.
What issues arise for birds if they migrate earlier than intended?
Migrating too early can cause phenological mismatch, where birds arrive before or out of sync with peak food resources or breeding conditions, which can hurt survival and reproduction.