Unit 2 Lec 3
 Call Kai
 Learn
Learn Practice Test
 Spaced Repetition
 Match
Match Flashcards
 Knowt Play
1/23

There's no tags or description
Looks like no tags are added yet.
Name | Mastery | Learn | Test | Matching | Spaced | Call with Kai |
|---|
No analytics yet
Send a link to your students to track their progress
24 Terms
Testing Our Model
How well does our model predict the patterns of selection we see in real data?
1. Selection on recessive and dominant alleles
2. Selection on heterozygotes and homozygotes
3. Frequency dependent selection
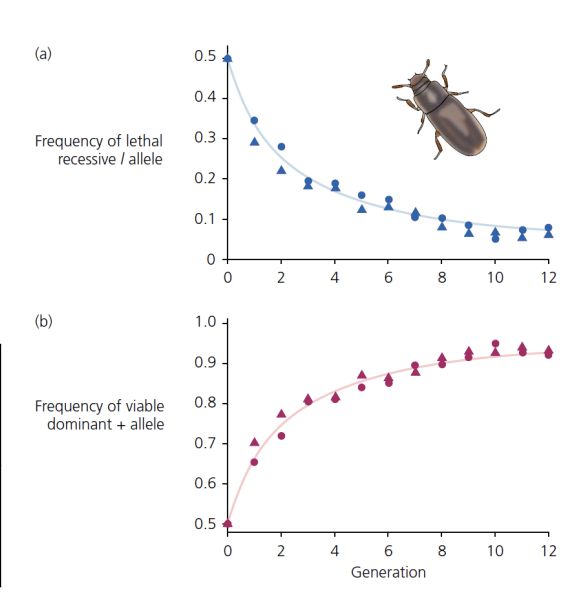
Dawson (1970): Selection on a recessive allele
Studied a lab colony of flour beetles at the l locus. This locus has two alleles: + and /.
Individuals with genotype +/+ or +/l genotypes survive. Individuals with the genotype l/ l do not survive. l is a recessive lethal allele.
Dawson collected heterozygotes from his colony and established two experimental populations. p = q = 0.5 initially.
Prediction: the populations would evolve toward lower and lower frequencies of the l allele, and higher frequencies of the + allele.
Dawson conducted calculations to predict how the allele frequencies would change. He found that the changes in allele frequency in the two beetle populations matched what he predicted!
Conclusion: dominance and allele frequency interact to determine the rate of evolution.
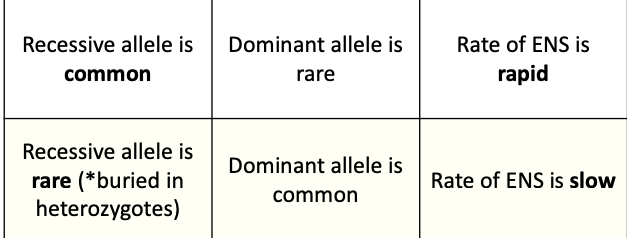
Top: When a harmful recessive allele is common, many individuals are homozygous recessive (aaaaaa), so the trait is expressed and selection can remove it easily.
Bottom: When the recessive allele becomes rare, most copies are hidden inside heterozygotes (Aa). Because heterozygotes look normal, natural selection cannot “see” the recessive allele very well.
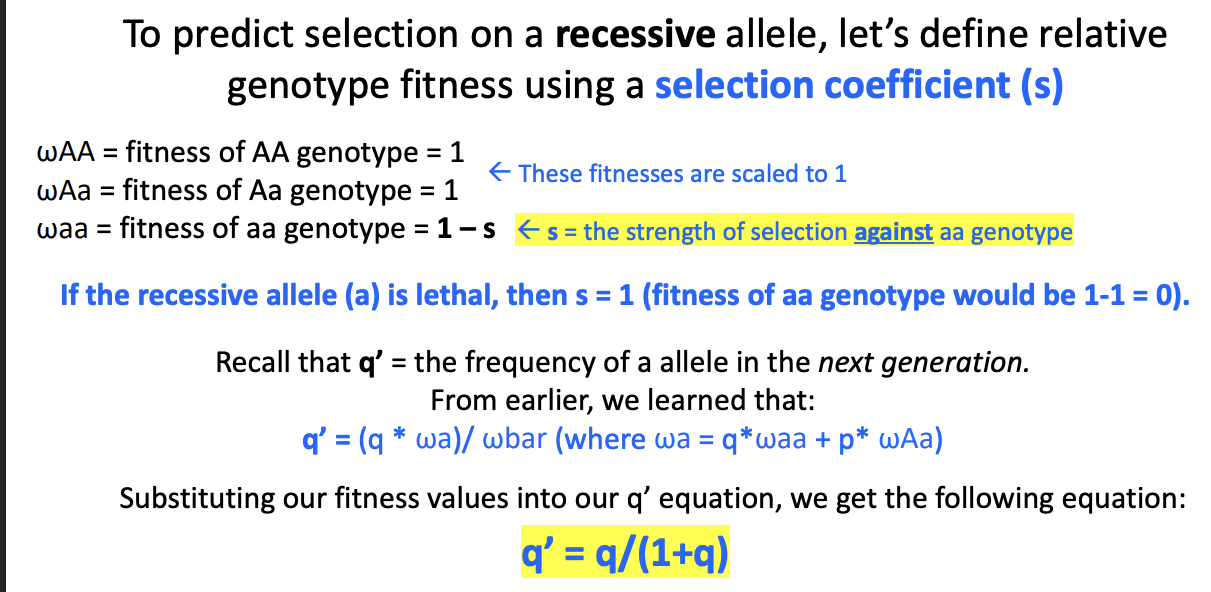
To predict selection on a recessive allele, let’s define relative genotype fitness using a selection coefficient (s)
s=?
wAA=
wAa=
waa=
what happens if the recessive allele (a) is lethal?
Explain
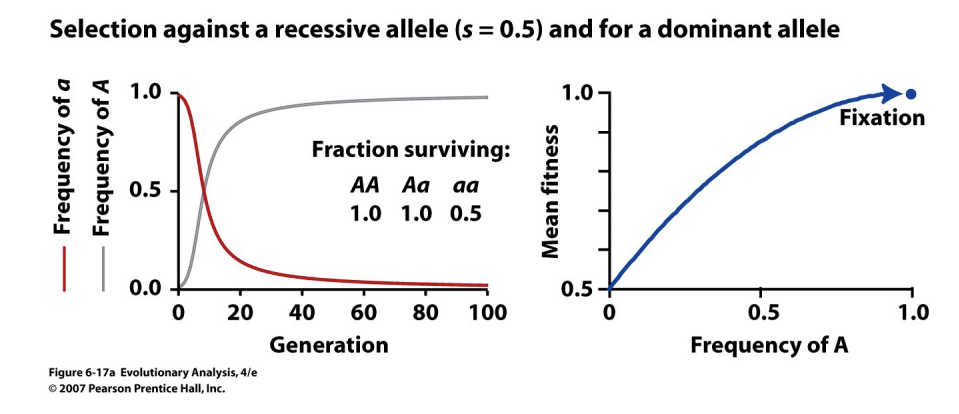
This relationship holds true even if the recessive allele is not lethal (here s = 0.5). As the recessive allele becomes rare, the rate of evolution slows dramatically. Most copies of a in the population are in heterozygous individuals, where they are “hidden” from selection!
Mean fitness of the population increases as A becomes more common
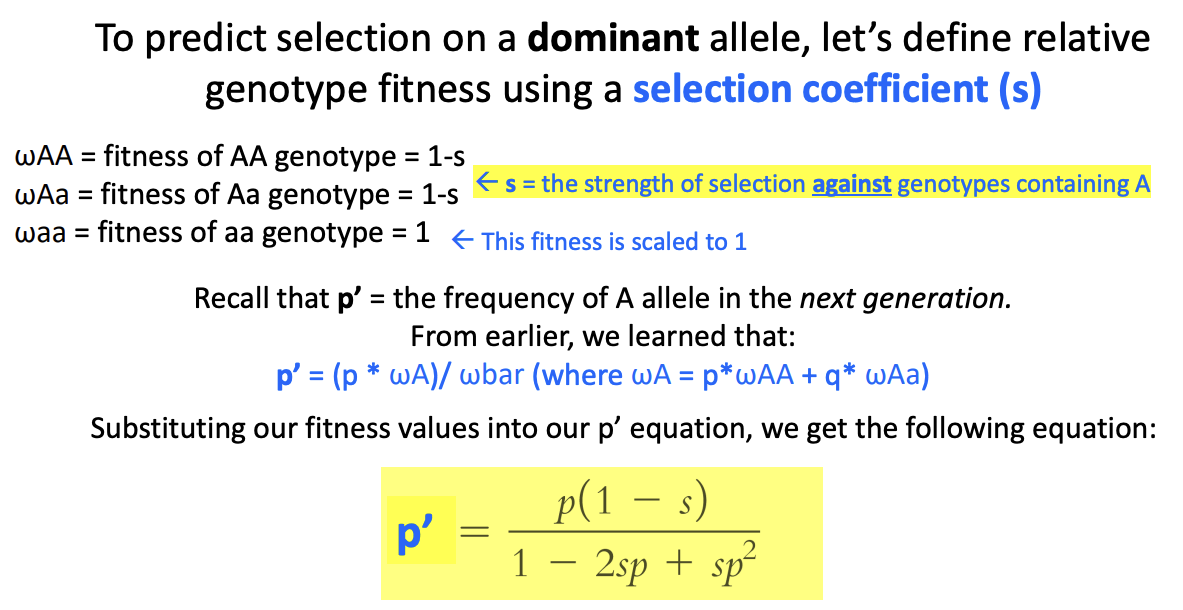
To predict selection on a dominant allele, let’s define relative genotype fitness using a selection coefficient (s)
wAA=
wAa=
waa=
s=
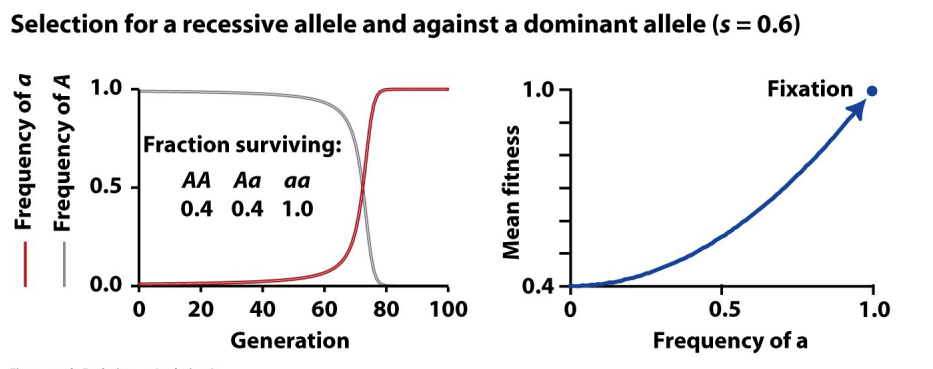
Explain
Here, the recessive allele is favored (selection against A). Since a starts out rare, it is “hidden” from selection in heterozygotes, even though favorable. But as a becomes more common, it will appear in more homozygotes, and the rate of evolution will pick up dramatically!
Hardy Weinberg equilibrium conditions
No selection (all genotypes have equal fitness)
No mutation
No immigration/emigration
Large population size (no drift or chance events)
Random mating
Why is Mutation Important?
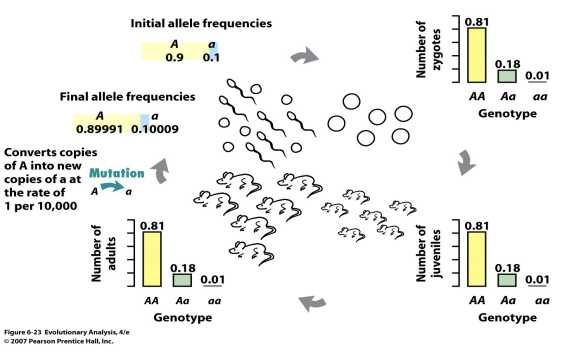
Mutation causes slight changes to allele frequency, so by itself, mutation has small effects on allele frequency change
So why care about mutation? It is the source of all genetic novelty!
Mutation AND selection can cause a new allele to become more common
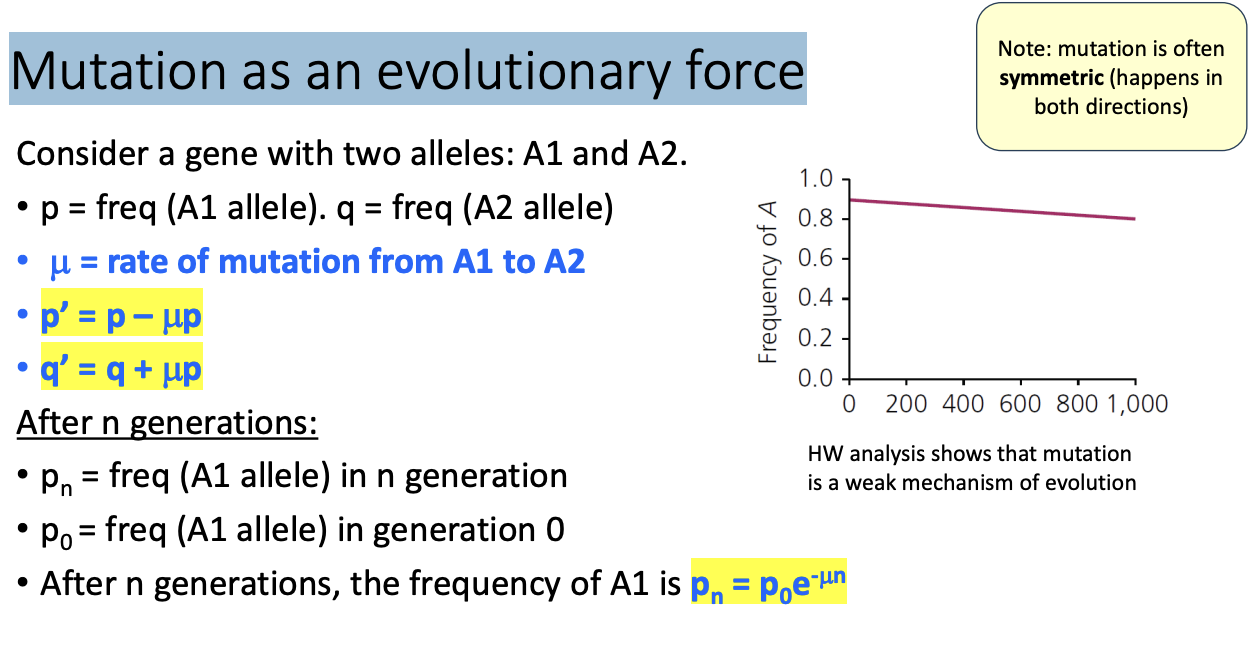
Mutation as an evolutionary force
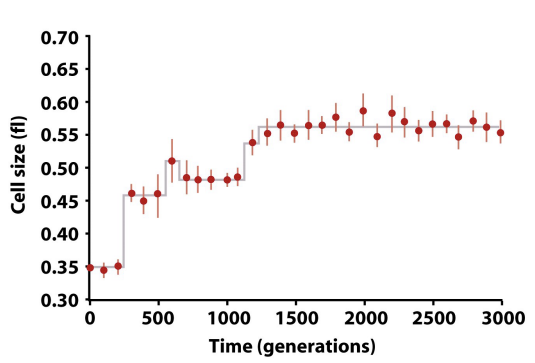
Mutation and Selection: Lenski et al
Lenski et al. raised a strain of E. coli in which only mutation was the source of genetic variation
Measured fitness by growth rate, which was related to cell size in most cases
Fitness and cell size increased in dramatic jumps in response to selection
Steplike pattern:
A new mutation enabled bacteria to divide at a faster rate
Frequency of mutants quickly increased - Eventually, the mutation reached fixation
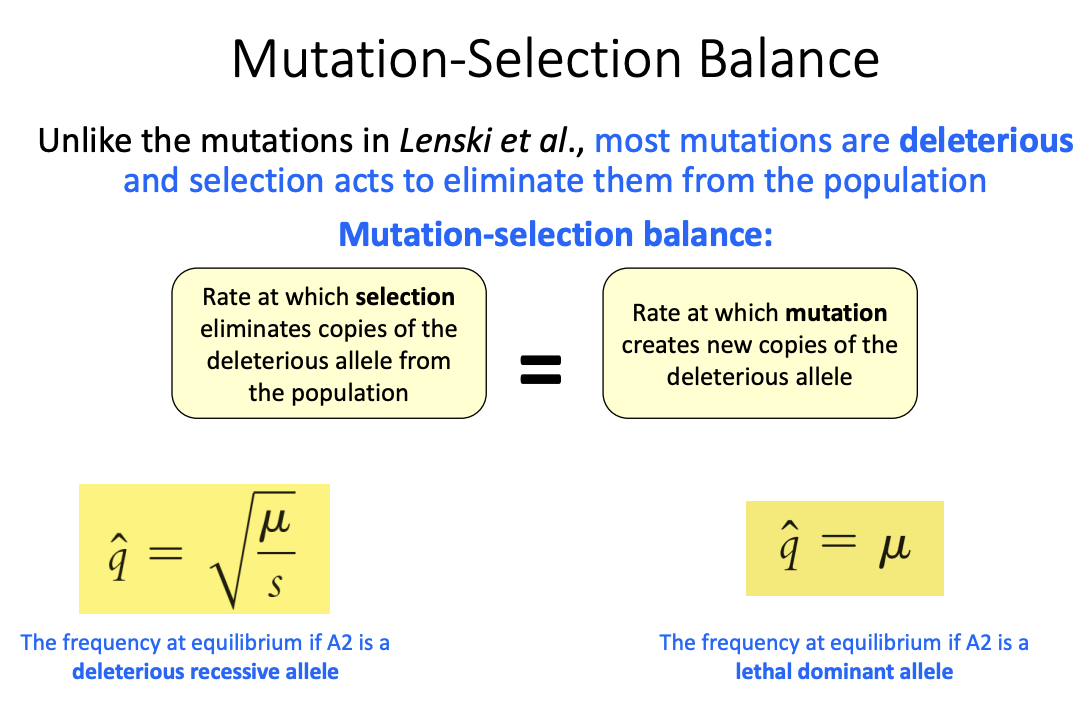
Mutation-Selection Balance
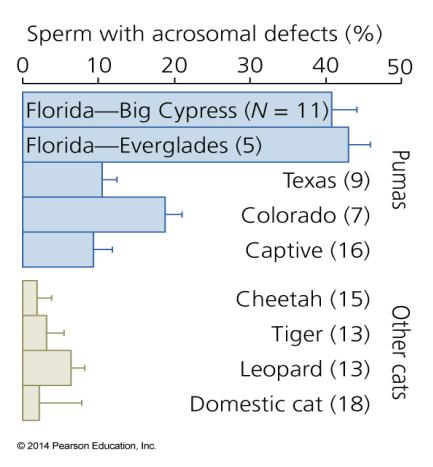
Florida Panther
The Florida Panther once ranged across SE N. America, now it is reduced to dwindling swampland in S. Florida
The surviving panthers suffer poor health and high rates of defective sperm
Wildlife managers intervened and used key ideas from migration, drift, and nonrandom mating
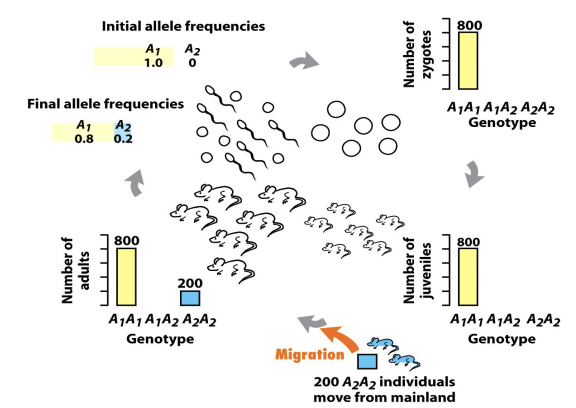
Migration as an Evolutionary Force
what is migration?
what is migration caused by?
what does migration prevent?
what can migration cause?
Migration = the movement of alleles between populations
Migration can be caused by many things (seeds, spores, pollen, movement of juveniles, gametes, etc.)
Migration (gene flow) is an important mechanism that prevents populations from diverging
It can cause changes in allele frequency and can counteract the effects of drift/selection
Water Snakes of Lake Erie
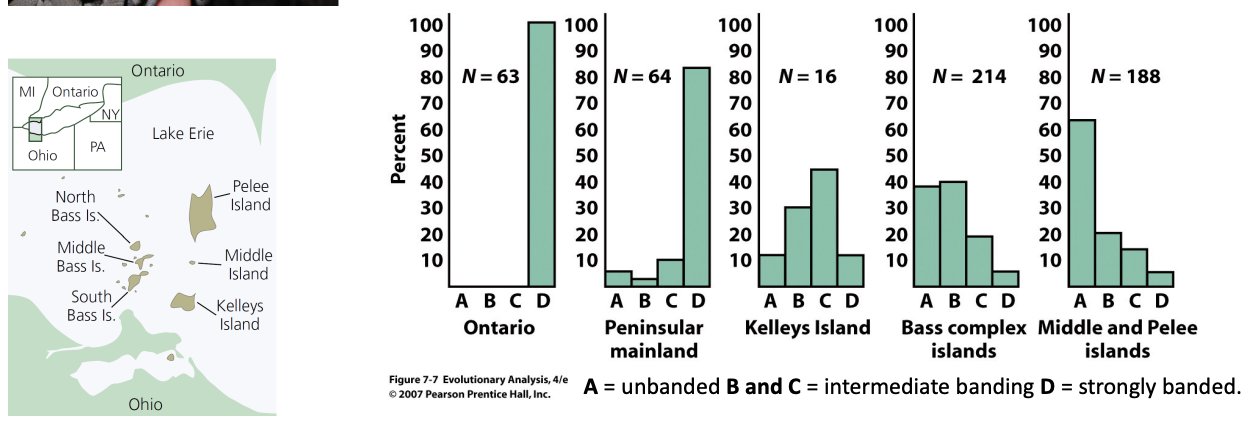
Water snakes of Lake Erie: mainland and island populations. Individuals vary in appearance, ranging from strongly banded to unbanded
Migration of mainland snakes to island populations maintains the banded allele there
If allowed to proceed unopposed by any other mechanism of evolution, migration will eventually…
If allowed to proceed unopposed by any other mechanism of evolution, migration will eventually homogenize allele frequencies across populations
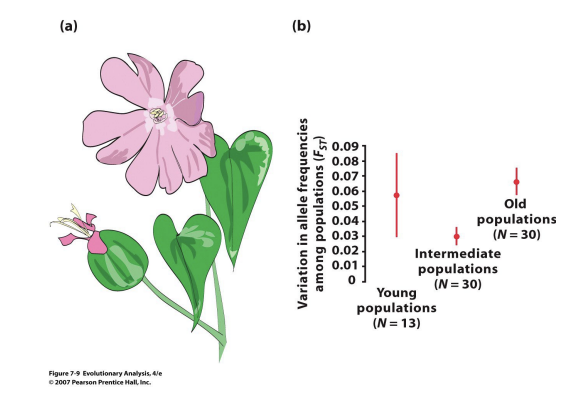
Giles and Goudet (1997)- documented this effect in red bladder campion
explain FST: the definition, formula
FST = 1 meaning
FST 0 meaning
Their predictions:
Young populations would vary in allele frequencies across loci
Intermediate populations would be more homogenous due to migration
Old populations would again vary due to declining migration
For each group, they calculated
FST = a statistic that reflects the variation in allele frequencies among populations
FST =( “Differences between pops” – “Differences within pops”) / “Differences between pops”
FST of 1 means complete separation
FST of 0 means complete mixing
Giles and Goudet (1997) Elaboration
Some populations were:
large and connected
small and isolated
They measured genetic differences between populations using FST
Results:
Small isolated populations had:
higher FST
lower genetic diversity
more genetic differences from other populations
This happened because:
Genetic drift is stronger in small populations.
Little migration/gene flow occurred between patches.
Allele frequencies changed randomly over time.
The study became a classic example showing that:
habitat fragmentation reduces gene flow
small populations experience stronger drift
isolated populations become genetically differentiated
It demonstrated how conservation problems can develop even in plants if populations become too separated.
What is Genetic Drift?
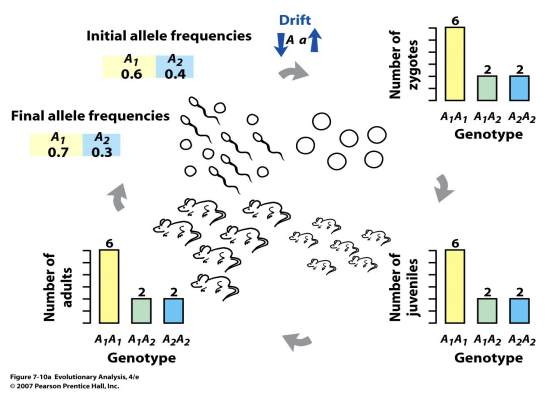
Genetic Drift = Random/chance changes in allele frequency due to sampling error
Drift is the only evolutionary force that occurs in nearly all situations. Drift is a universal feature of finite (limited) population size.
Similar to outcomes of coin tosses or dice rolls. However, in drift, the outcome ‘resets’ the probability for the next generation.
Drift is not just accidents (ex: tree falls on some squirrels). Any difference NOT due to NS can cause drift (chance changes).
“Blind luck is, by itself, a mechanism of evolution” – your textbook
Genetic Drift Ex
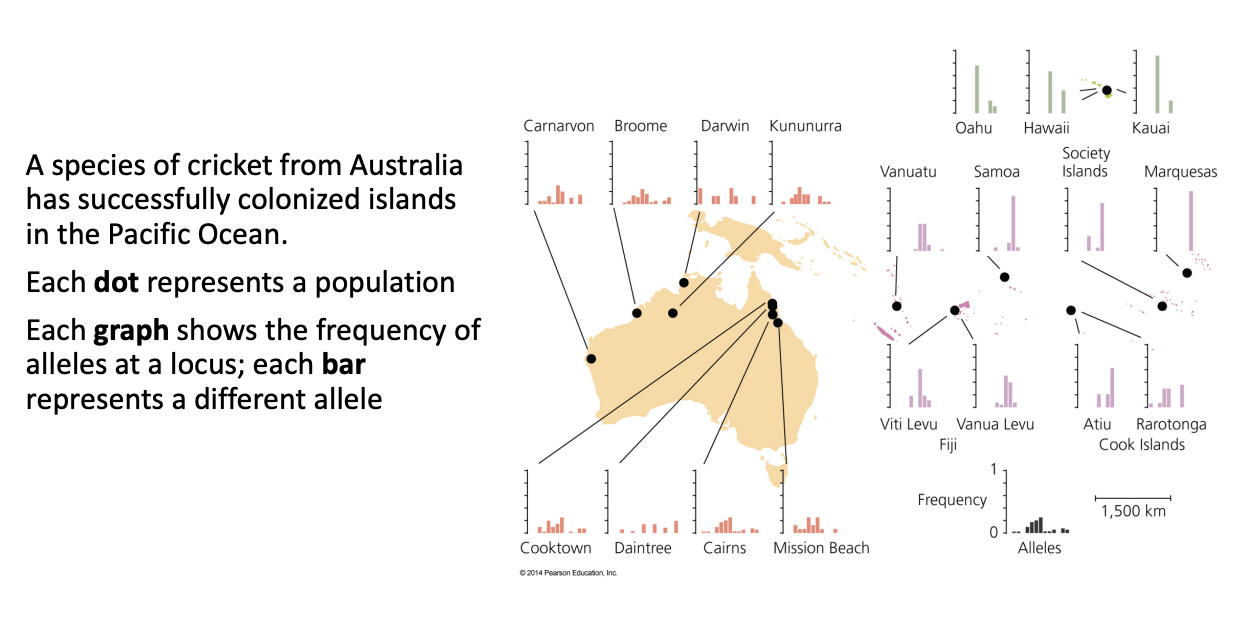
What is this an example of?
This is an example of the founder effect. A small number of founders represent a random sample of the main population. These founders establish a population with less alleles (i.e. loss of genetic diversity) and the alleles brought over are determined by chance.
Why are the fewest alleles found on the Hawaiian islands? Note: bottleneck is similar (loss of genetic diversity) but founder effect involves moving and establishing a new population.
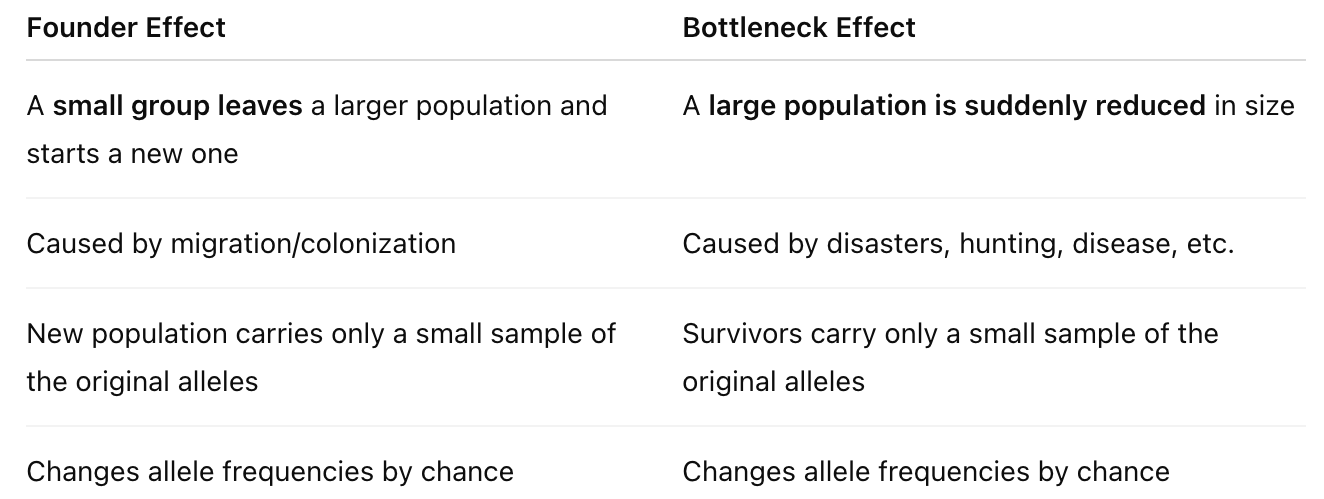
Founder Effect vs Bottle Neck Effect
Founder Effect
A few individuals leave and form a new population.
Bottleneck Effect
Most individuals die, leaving a few survivors behind.
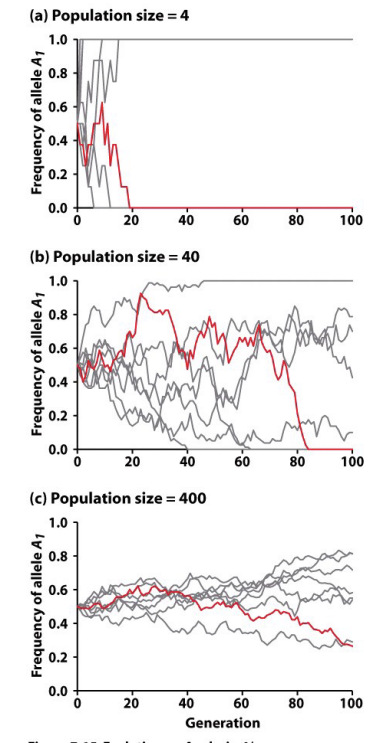
How is Drift Related to population Size?
3 patterns
Because fluctuations in allele frequencies from one generation to the next are caused by random sampling error, every population follows a unique evolutionary path
Genetic drift has a more rapid/dramatic effect on allele frequencies in small populations
given sufficient time, drift can produce substantial changes in allele frequencies, even if the population is large
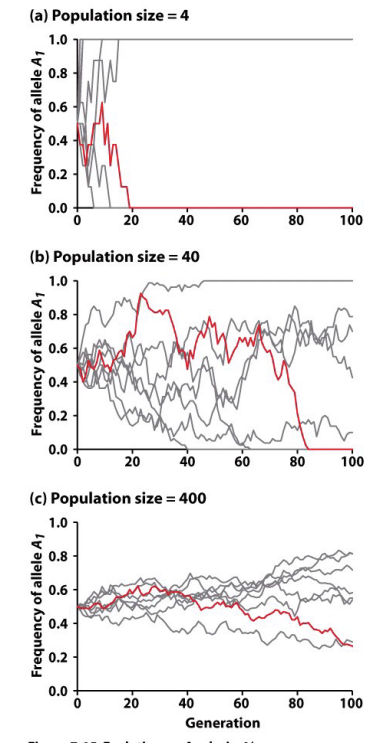
How is drift related to population size?
what two affects do wandering allele frequencies have?
N=?
what is equal to its initial frequency?
Wandering allele frequencies have two effects:
Eventually, alleles drift to fixation or loss
The frequency of the heterozygotes declines (figures d-f)
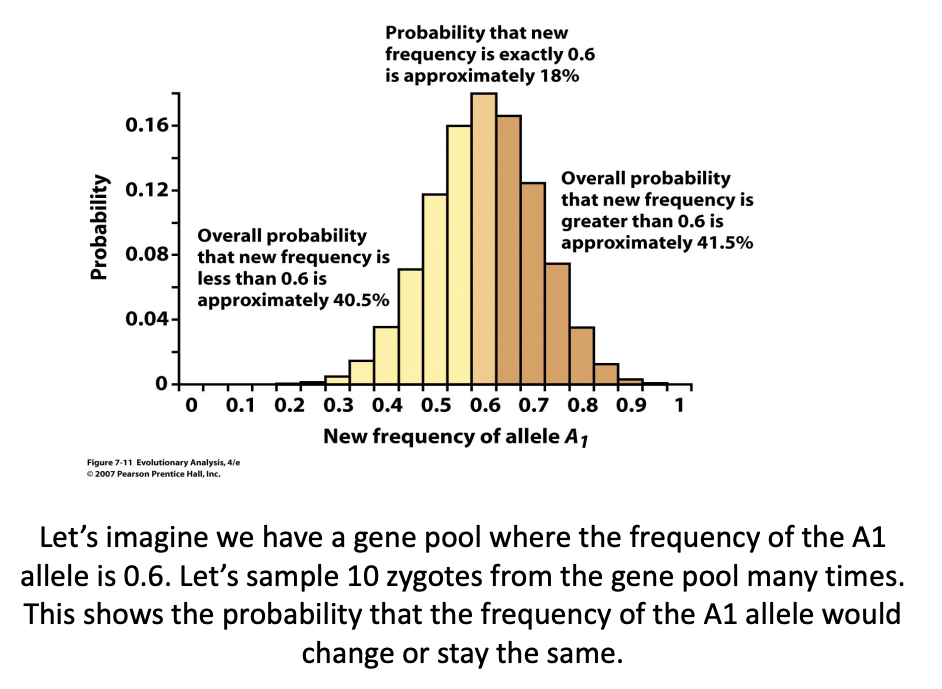
N = the number of individuals in the population Probability (a new allele in a pop reaching fixation) = 1/2N
Assume now that there are x number of A1’s already in the gene pool. The probability is = x * 1/2N = x/2N = p
AKA, the probability that a given allele will be the one that drifts to fixation is equal to its initial frequency